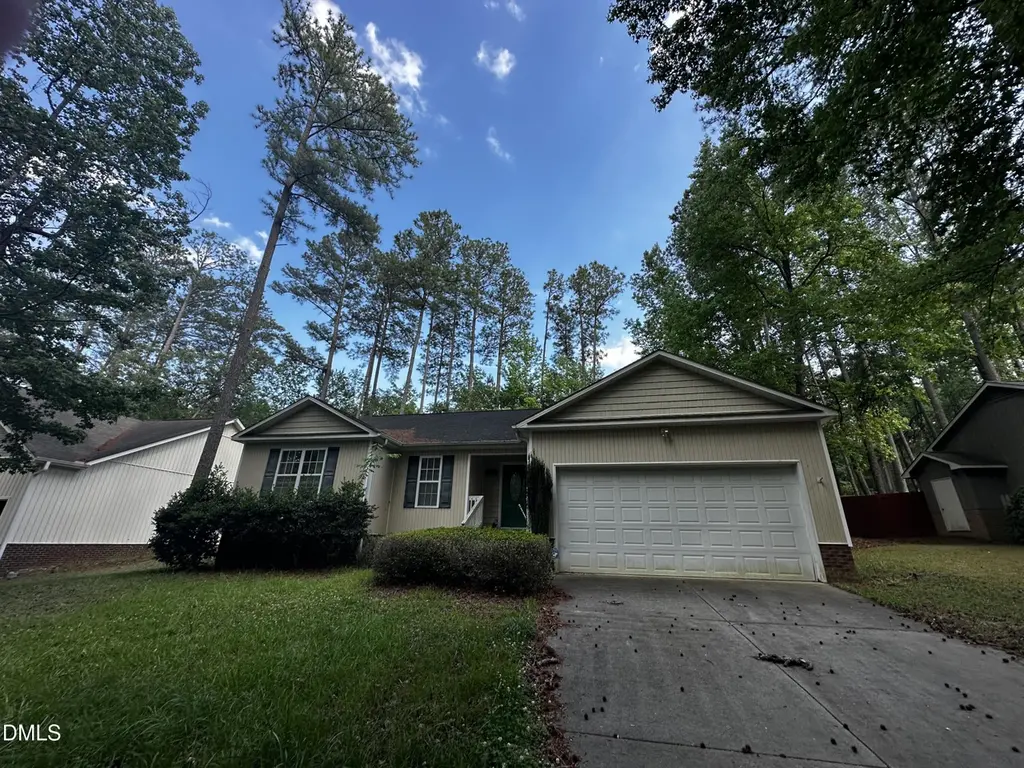
1483 Kentucky Ave
Sanford, NC 27332
$230,000D+
3 bd · 2.0 ba ·
1,516 sqft ·
Built 2005
· SingleFamily
· Active
· 23 DOM
Cashflow @ list (25.0% down · 7.5%)
Estimated rent
$1,894/mo
Mortgage (P&I)
−$1,206
Tax + insurance
−$273
HOA
−$63
Vac / Maint / Mgmt
−$398
Net cashflow
$-46/mo
Annual
$-546/yr
Cap rate
6.06%
Cash-on-cash
-0.85%
DSCR
0.96
1% rule
0.82%
Cash to close
$64,400
Investor read
- This is a 3-bed/2.0-bath single-family listed at $230k.
- At list price, monthly cash flow is $-46 ($-546/yr) — negative.
- To cash-flow at today's rent, offer at most $222k (3.5% below list).
- To meet the 1% rule (rent ≥ 1% of price), the offer needs to be $189k (17.6% below list).
- It's been on market 23 days — a 2% lower offer ($227k) is reasonable based on typical stale-listing flexibility.
- Recommended offer: $189k (17.6% below list) — sets the bar for 1% rule.
- Local home prices are declining (-3.0%/yr); year-one equity from $2k of loan paydown is wiped out by about $7k of value loss. Plan a longer hold.
- Location reads 72/100 on livability (#92 in NC) — a middle-class / working-renter tenant base. Strengths: cost of living A+, housing A+, health & safety A+; Watch: employment D, crime D-, commute F.
- Lee County Schools (rural): math 31% / reading 39% proficiency, ranked #131 of 178 in NC (top 74%) — families likely to look elsewhere, expect single-tenant / working-renter base with shorter leases.
- Zoned schools: East Lee Middle (math 21% / reading 37%, grade F, #350 of 475 statewide, top 74%, 531 students, 71% FRL).
- Market conditions: Rents rising fast (+4.9%/yr); 458 active listings in the ZIP; 1 comparable units currently listed for rent nearby; solid renter incomes; 602 units permitted in Lee County in 2024 (0 in 5+ unit buildings).
- Lee County population projected at +8% by 2050 — modest demand growth; plan on rents tracking national, not racing it.
- 3 sale attempts since 10y ago with the ask held roughly flat each time — persistent listings suggest the price (not the market) is what's stuck; bring a comps-based counter.
- Current owner paid $154k; 50% above their basis — modest negotiation headroom, anchor on the comps not their cost.
- Climate carrying-cost: major wind risk, 62% chance of damaging wind over 30y; extreme-heat days projected 7→17/yr by 2055 (HVAC capex compounding) — expect insurance premiums to compound above CPI over the hold.
- Cap rate 6.1% vs local median 3.6% in Sanford — top-decile yield for the area; either an underpriced asset or a hidden risk that comps aren't pricing in. Stress-test before assuming the spread holds.
Questions for listing agent
- What do current leases actually rent for vs. the listed asking? Can we see a recent rent roll and the last 12 months of T-12 income?
- What does the HOA fee cover, when was the last increase, and are there any pending special assessments or reserve-fund shortfalls?
- Is there a deadline driving the sale (1031 exchange, divorce, estate, relocation)? That informs how much negotiation room exists.
- Schools are F-rated, which usually means shorter tenancies and higher turnover. Who's the typical renter profile here, and what's been the actual vacancy rate?
- Crime grade is D in this area — have there been break-ins, vandalism, or insurance claims at this property in the last 3 years? What carrier currently insures it and at what premium?
- The area grade is low — what's the realistic commute time and amenity access for the typical tenant pool here? Any planned neighborhood developments (good or bad) we should know about?
- What's the average days-on-market for RENTAL listings here right now (not sales)? A rising rental-DOM trend means longer vacancies and softer asking-rent achievability than the comps imply.
- What's the recent tenant-quality profile in this submarket — average credit score on applications, eviction rate, late-payment / NSF rate, and stable-employment percentage? A property-management company in the area should have these aggregated.
CashFlowRE · CFR-ZPYBM7EYNEC53Q
· Data 1 day ago
cashflowre.app · 2026-05-29