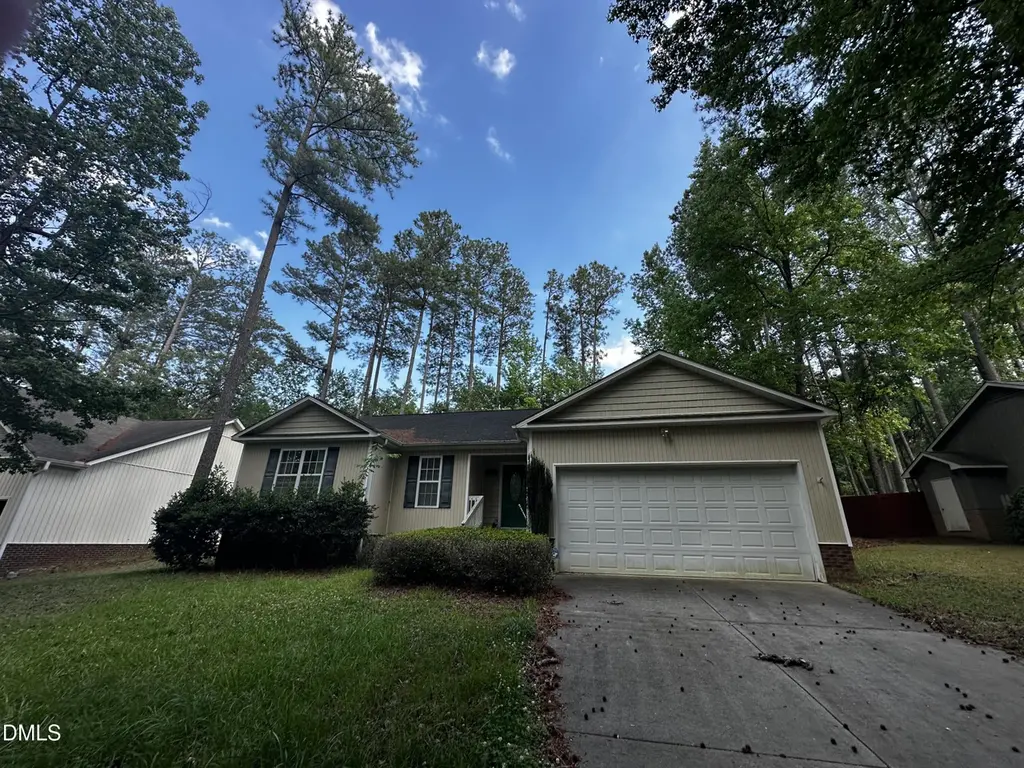
1483 Kentucky Ave · Sanford, NC
Flood risk 1/10 · Minimal
- FEMA flood zone
- X (unshaded)
- Chance of flooding over 30 yrs
- 0.0%
- Est. flood insurance / yr
- $507 – $1,088
Fire risk 4/10 · Minor
- Est. fire insurance / yr
- $906 – $1,684
Heat risk 6/10 · Moderate
- Hot days now (above 105°F)
- 7 days/yr
- Hot days in 30 yrs
- 17 days/yr
Wind risk 6/10 · Moderate
- Chance of severe wind over 30 yrs
- 62.0%
Air-quality risk 2/10 · Minimal
- Unhealthy air days now
- 1 days/yr
- Unhealthy air days in 30 yrs
- 1 days/yr
Risk factors via First Street. Map © Google.
Why this score? — see what drove the D+ grade
The composite is a weighted blend of 9 inputs, each scored 0–100. Each bar is that input's sub-score; the figure is the points it added to the 100-point composite (weight × sub-score).
- ARV discount +15.0/15.0
- Cash flow +12.2/30.0
- Rent growth +3.7/5.0
- DSCR +3.6/10.0
- Livability +3.6/5.0
- 1% rule +3.2/10.0
- Schools +3.0/10.0
- Condition / age +2.5/5.0
- Appreciation +0.0/10.0
$230,000
🖨 Deal sheet 📄 Offer letter ✓ Due diligence
Listing remarks MLS
Meticulously maintained ranch home that has been owner's second home for 10 years. Split, open floor plan with 3 bedrooms, 2 baths, two car attached garage & rear deck. Lovely tiled entry foyer that opens to living room with fireplace and hard wood floors. Easy flow to dining area with hardwood floors and tiled kitchen, offering double sinks, smooth top range, microwave, dishwasher and pantry
Key facts
- Gated community
- Tile floors
- 2yr old hvac
Tags
Neighborhood map
What this means for you Summary
Snapshot
- This is a 3-bed/2.0-bath single-family listed at $230k.
Deal economics
- At list price, monthly cash flow is $-46 ($-546/yr) — negative.
- To cash-flow at today's rent, offer at most $222k (3.5% below list).
- To meet the 1% rule (rent ≥ 1% of price), the offer needs to be $189k (17.6% below list).
- Recommended offer: $189k (17.6% below list) — sets the bar for 1% rule.
- Cap rate 6.1% vs local median 3.6% in Sanford — top-decile yield for the area; either an underpriced asset or a hidden risk that comps aren't pricing in. Stress-test before assuming the spread holds.
Location & tenants
- Location reads 72/100 on livability (#92 in NC) — a middle-class / working-renter tenant base. Strengths: cost of living A+, housing A+, health & safety A+; Watch: employment D, crime D-, commute F.
- Lee County Schools (rural): math 31% / reading 39% proficiency, ranked #131 of 178 in NC (top 74%) — families likely to look elsewhere, expect single-tenant / working-renter base with shorter leases.
- Zoned schools: East Lee Middle (math 21% / reading 37%, grade F, #350 of 475 statewide, top 74%, 531 students, 71% FRL).
- Market conditions: Rents rising fast (+4.9%/yr); 458 active listings in the ZIP; 1 comparable units currently listed for rent nearby; solid renter incomes; 602 units permitted in Lee County in 2024 (0 in 5+ unit buildings).
Forward outlook
- Local home prices are declining (-3.0%/yr); year-one equity from $2k of loan paydown is wiped out by about $7k of value loss. Plan a longer hold.
- Lee County population projected at +8% by 2050 — modest demand growth; plan on rents tracking national, not racing it.
Negotiation context
- It's been on market 23 days — a 2% lower offer ($227k) is reasonable based on typical stale-listing flexibility.
- 3 sale attempts since 10y ago with the ask held roughly flat each time — persistent listings suggest the price (not the market) is what's stuck; bring a comps-based counter.
- Current owner paid $154k; 50% above their basis — modest negotiation headroom, anchor on the comps not their cost.
Risks & watch-outs
- Climate carrying-cost: major wind risk, 62% chance of damaging wind over 30y; extreme-heat days projected 7→17/yr by 2055 (HVAC capex compounding) — expect insurance premiums to compound above CPI over the hold.
Questions for the listing agent
- What do current leases actually rent for vs. the listed asking? Can we see a recent rent roll and the last 12 months of T-12 income?
- What does the HOA fee cover, when was the last increase, and are there any pending special assessments or reserve-fund shortfalls?
- Is there a deadline driving the sale (1031 exchange, divorce, estate, relocation)? That informs how much negotiation room exists.
- Schools are F-rated, which usually means shorter tenancies and higher turnover. Who's the typical renter profile here, and what's been the actual vacancy rate?
- Crime grade is D in this area — have there been break-ins, vandalism, or insurance claims at this property in the last 3 years? What carrier currently insures it and at what premium?
- The area grade is low — what's the realistic commute time and amenity access for the typical tenant pool here? Any planned neighborhood developments (good or bad) we should know about?
- What's the average days-on-market for RENTAL listings here right now (not sales)? A rising rental-DOM trend means longer vacancies and softer asking-rent achievability than the comps imply.
- What's the recent tenant-quality profile in this submarket — average credit score on applications, eviction rate, late-payment / NSF rate, and stable-employment percentage? A property-management company in the area should have these aggregated.
- How much new for-sale + rental construction is in the pipeline within 1–3 miles? Heavy new supply typically softens prices + rents 12–24 months out; constrained supply supports both.
Investment metrics
- 1% rule
- 0.82% ✗
- Cap rate
- 6.06%
- Cash-on-cash
- -0.85%
- DSCR
- 0.96
- GRM
- 10.1
CMA / ARV
- ARV (on-the-fly)
- $286,524
- Comps found
- 12
Show comp detail 12 sales within ~0.75 mi
| Address | Dist | Beds/Ba | Sqft | Sold | Price | $/sf | Match |
|---|---|---|---|---|---|---|---|
| 1401 Pennsylvania Ave | 0.24mi | 3/2.0 | 1,495 (-1%) | 0mo | $295,000 | $197 | 86 |
| 1541 Louisiana Ln | 0.13mi | 3/2.0 | 1,498 (-1%) | 11mo | $276,100 | $184 | 83 |
| 2114 Traceway S | 0.28mi | 3/2.0 | 1,504 (-1%) | 11mo | $285,000 | $189 | 76 |
| 1534 Delaware Pl | 0.10mi | 3/2.5 | 1,655 (+9%) | 4mo | $335,000 | $202 | 74 |
| 2142 Philadelphia St | 0.47mi | 3/2.0 | 1,452 (-4%) | 7mo | $275,000 | $189 | 65 |
| 2147 Detroit Blvd | 0.56mi | 4/2.0 (+1) | 1,610 (+6%) | 5mo | $330,000 | $205 | 54 |
| 1030 Windrace Trl | 0.66mi | 3/2.0 | 1,674 (+10%) | 2mo | $285,000 | $170 | 50 |
| 2194 Cleveland Cir | 0.68mi | 3/2.0 | 1,628 (+7%) | 11mo | $319,000 | $196 | 47 |
| 990 Whistling Wind | 0.70mi | 3/2.0 | 1,672 (+10%) | 5mo | $265,000 | $158 | 46 |
| 1051 Upland Reach | 0.75mi | 3/2.0 | 1,645 (+8%) | 6mo | $309,000 | $188 | 46 |
| 903 Windrace Trl | 0.71mi | 3/2.0 | 1,389 (-8%) | 9mo | $250,650 | $180 | 46 |
| 1021 N Windrace Trl | 0.66mi | 2/3.0 (-1) | 1,648 (+9%) | 7mo | $255,000 | $155 | 40 |
Match score weights: distance 35% · size 25% · config 20% · recency 20%. Top-matched comps best support the ARV.
Projected returns pro-forma
-3.0% appreciation · 4.87% rent growth · sell at horizon
- IRR
- -15.7%
- Equity multiple
- 0.43×
- Total profit
- $-36,539
- Equity at exit
- $34,294
- IRR
- -4.4%
- Equity multiple
- 0.69×
- Total profit
- $-20,076
- Equity at exit
- $19,886
Cash invested: $64,400 (down + closing). Projections, not guarantees.
Landlord ↔ Tenant lean methodology
- Overall (STATE)
- 85 Strongly Landlord-Friendly
- State North Carolina
- 85 Strongly Landlord-Friendly · R+3
- County
- — inherits STATE
- City
- — inherits STATE
ZIP-level market 27332
- Home prices YoY
- -17.8%
- Rents YoY
- 4.9%
- Active inventory
- 458
- Price-to-rent
- 10.1×
Monthly cashflow live
- Estimated rent
- $1,894 medium interval (Pro) →
- Mortgage (P&I)
- −$1,206
- Tax from tax record
- −$177 /mo · $2,123/yr
- Insurance
- −$96
- HOA
- −$63
- Vacancy / Maint / Mgmt
- −$398
- Net cashflow
- $-46
Break-even live
UW: 25.0% down · 7.5% · 30yr · 1.5% tax · 5.0% vac · 8.0% maint · 8.0% mgmt
Financing live
Cash to close
- Down payment
- $57,500
- Closing costs
- $6,900
- Reserves months
- —
- Total cash needed
- —
Loan-product check · same deal, 3 products live
Conventional
25% down · 7.5% · 30yr
- Down + closing
- —
- Monthly P&I
- —
- Monthly cashflow
- —
- DSCR
- —
- Eligible?
- —
Personal DTI + credit; lowest rate.
DSCR
20% down · 8.5% · 30yr
- Down + closing
- —
- Monthly P&I
- —
- Monthly cashflow
- —
- DSCR
- —
- Eligible?
- —
No personal income docs; deal must DSCR.
Hard money
10% down · 12.0% · 12mo
- Down + closing
- —
- Monthly P&I
- —
- Monthly cashflow
- —
- DSCR
- —
- Eligible?
- —
Short-term bridge; refi at stabilization.
Rent comps 1 comps
| Address | Beds | Baths | Sqft | Rent | $/sqft | DOM | Units | Dist |
|---|---|---|---|---|---|---|---|---|
| 1963 Wedgewood Dr Sanford, NC | 3.0 | 2.5 | 1763 | $1,900 | $1.08 | 23d | 1 | 0.93mi |
HOA detail
- Monthly dues
- $63 · $756/yr
Listing history 23 events
-
2026-06-19days on market $230,000 Active 23 DOM
-
2026-06-18days on market $230,000 Active 22 DOM
-
2026-06-17days on market $230,000 Active 21 DOM
-
2026-06-16days on market $230,000 Active 20 DOM
-
2026-06-15days on market $230,000 Active 19 DOM
-
2026-06-14days on market $230,000 Active 17 DOM
-
2026-06-13days on market $230,000 Active 16 DOM
-
2026-06-10days on market $230,000 Active 14 DOM
-
2026-06-09days on market $230,000 Active 13 DOM
-
2026-06-08days on market $230,000 Active 12 DOM
-
2026-06-07days on market $230,000 Active 11 DOM
-
2026-06-05days on market $230,000 Active 8 DOM
-
2026-06-03days on market $230,000 Active 7 DOM
-
2026-06-02days on market $230,000 Active 6 DOM
-
2026-06-01days on market $230,000 Active 5 DOM
-
2026-05-31days on market $230,000 Active 4 DOM
-
2026-05-30days on market $230,000 Active 3 DOM
-
2026-05-27$230,000 Active
-
2016-04-15soldstatus $153,500 399-char remark
Show marketing remark (401 chars)
Meticulously maintained ranch home that has been owner's second home for 10 years. Split, open floor plan with 3 bedrooms, 2 baths, two car attached garage & rear deck. Lovely tiled entry foyer that opens to living room with fireplace and hard wood floors. Easy flow to dining area with hardwood floors and tiled kitchen, offering double sinks, smooth top range, microwave, dishwasher and pantry
-
2016-04-15soldstatus $153,500 401-char remark
Show marketing remark (401 chars)
Meticulously maintained ranch home that has been owner's second home for 10 years. Split, open floor plan with 3 bedrooms, 2 baths, two car attached garage & rear deck. Lovely tiled entry foyer that opens to living room with fireplace and hard wood floors. Easy flow to dining area with hardwood floors and tiled kitchen, offering double sinks, smooth top range, microwave, dishwasher and pantry
-
2016-04-15soldstatus $154,000
Show marketing remark (401 chars)
Meticulously maintained ranch home that has been owner's second home for 10 years. Split, open floor plan with 3 bedrooms, 2 baths, two car attached garage & rear deck. Lovely tiled entry foyer that opens to living room with fireplace and hard wood floors. Easy flow to dining area with hardwood floors and tiled kitchen, offering double sinks, smooth top range, microwave, dishwasher and pantry
-
2016-03-01$157,750 399-char remark
Show marketing remark (401 chars)
Meticulously maintained ranch home that has been owner's second home for 10 years. Split, open floor plan with 3 bedrooms, 2 baths, two car attached garage & rear deck. Lovely tiled entry foyer that opens to living room with fireplace and hard wood floors. Easy flow to dining area with hardwood floors and tiled kitchen, offering double sinks, smooth top range, microwave, dishwasher and pantry
-
2016-03-01$157,750 401-char remark
Show marketing remark (401 chars)
Meticulously maintained ranch home that has been owner's second home for 10 years. Split, open floor plan with 3 bedrooms, 2 baths, two car attached garage & rear deck. Lovely tiled entry foyer that opens to living room with fireplace and hard wood floors. Easy flow to dining area with hardwood floors and tiled kitchen, offering double sinks, smooth top range, microwave, dishwasher and pantry
ⓘ Source: listings_history table (triggers on properties + properties_extension) + one-shot
backfill from property_details.listing_events for pre-trigger history.
Tax reassessment forecast NC · Resets to sale price
- Current annual tax
- $2,123 · $177/mo
- Projected year-2 tax
- $2,123 · $177/mo
- Expected delta
- $0/yr ($0/mo · 0.0%)
ⓘ Screening estimate from a state-policy table — verify with the county assessor before closing.
Climate risk First Street
- Flood 1/10 Low FEMA zone X (unshaded) · 0% chance over 30 yrs
- Wildfire 4/10 Moderate
- Heat 6/10 Major 7 d/yr ≥105°F today · 17 d/yr by 30 yrs out
- Wind 6/10 Major 62% chance of damaging wind over 30 yrs
- Air quality 2/10 Low 1 unhealthy d/yr today · 1 by 30 yrs out
Nearby sold comps map
Loading sold comps map…
Walkable amenities ~0.75 mi
Loading nearby amenities…
Taxation est. · year 1
- Rental income
- $22,730
- − Mortgage interest
- −$12,884
- − Property taxes
- −$2,123
- − Insurance
- −$1,150
- − Repairs & maintenance
- −$1,818
- − Management
- −$1,818
- − HOA
- −$756
- − Depreciation
- −$6,691
- Taxable loss
- −$4,510
- Est. tax savings @ 24.0%
- +$1,082
- After-tax cash flow
- $536/yr
For passive investors: Depreciation is non-cash, so a rental often shows a tax loss while cash-flowing — sheltering income. Rental losses are passive: they offset passive income freely, and up to $25,000/yr can offset ordinary (W-2) income if you actively participate and your MAGI is under $100k (phasing out to $0 by $150k); unused losses carry forward. On sale, claimed depreciation is recaptured at up to 25%, and gains may owe capital-gains tax (a 1031 exchange can defer both). Figures are a year-1 estimate at your 24.0% rate — not tax advice; consult a CPA.
Schools (NCES district)
- District
- Lee County Schools
- NCES district ID
- 3702560
- Math proficiency
- 31% ▼ -6.00%
- Reading proficiency
- 39% ▬ 0.00%
- Median HH income
- $45,300
- Composite
- 29.87/100
- National rank
- #6403
- State rank
- #131 of 178 in NC
Livability — Sanford
- Score
- 72/100
- State rank
- #92
- US rank
- #6134
Category grades
Schools grade is shown separately in the Schools card above.
Census & demographics
- County
- Lee County · 76,725 people
- City population
- 76,725
- Metro
- Sanford, NC
- Population (ZIP)
- 36,947
- Household income
- $78,447
- Rent vs Own
- Severe rent burden
- 632.0
Population outlook (Lee County) Hauer SSP2
- Today (2025)
- 63,008 people
- By 2030
- 64,443 · +2.3%
- By 2040
- 66,898 · +6.2%
- By 2050
- 68,310 · +8.4%
- By 2075
- 70,920 · +12.6%
- By 2100
- 70,402 · +11.7%
Race, ethnicity, and origin ACS 2023
- Neighborhood character
- Diverse neighborhood (Simpson 0.59)
- Race & ethnicity
- White 59% Hispanic / Latino 19% Black 16% Two or more races 11% Asian 1%
- Hispanic origin (detail)
- Mexican 9% Puerto Rican 4% Cuban 2%
- Common ancestry
- Serbian 2% Italian 2% Slovak 2%
- Foreign-born
- 8% · Canada, South Korea
- Languages at home
- 82% English-only · Spanish 15%
Political lean MEDSL · Lee
- 2024 margin
- R (+17.5) · D 40.8% · R 58.3%
- 2008→2024 swing
- -9.1pp toward R · 2008: -8.4pp · 2024: -17.5pp
- All cycles
- 2024: R+17.5 2020: R+14.9 2016: R+13.2 2012: R+10.2 2008: R+8.4
Not yet ingested
- Civics
- —
Market trends
- HPI YoY
- ▼ -54.61%
- Current HPI
- 252.2719
- Rent YoY
- ▲ 4.87%
- Metro
- Sanford, NC
- State GDP YoY
- ▲ 3.28%
- F500 in state
- 26
Industry mix (Fortune 500 HQ in NC)
| Industry | F500 HQs | Revenue |
|---|---|---|
| Financial Services | 2 | $213B |
|
||
| Retail | 2 | $95B |
|
||
| Industrial Conglomerate | 1 | $38B |
|
||
| Metals / Steel | 1 | $35B |
|
||
| Utilities | 1 | $30B |
|
||
| Industrial Machinery | 1 | $19B |
|
||
Price history
+45.8% since first listed6 events — show timeline
- 2026-05-27 Listed $230,000 TMLS
- 2016-04-15 Sold (Public Records) $154,000 Public Records
- 2016-04-15 Sold (MLS) $153,500 LPRMLS
- 2016-04-15 Sold (MLS) $153,500 TMLS
- 2016-03-01 Listed $157,750 LPRMLS
- 2016-03-01 Listed $157,750 TMLS
Property tax history
+3.9%/yrLatest (2025): $2,123 · +2.0% YoY. Source: county tax records.
Cash-flow waterfall
monthlySold comps — $/sqft
last 12 mo · ≤1 miLoading sold comps…