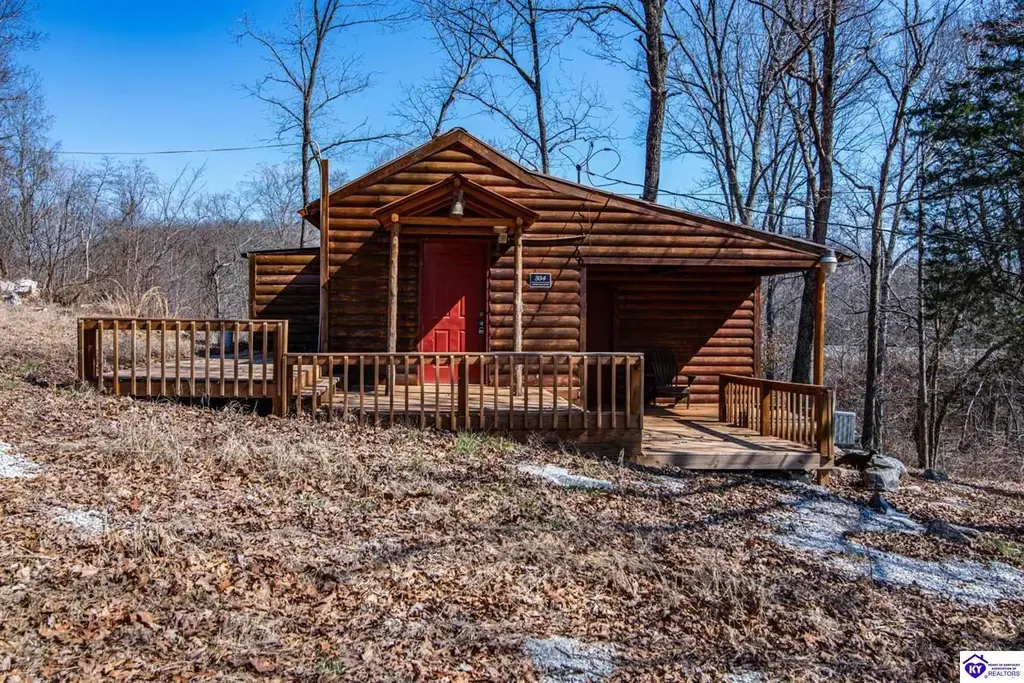
354 Raider Hollow Rd
Munfordville, KY 42765
$119,500D
1 bd · 1.0 ba ·
501 sqft ·
Built 1998
· SingleFamily
· Active
· 11 DOM
Cashflow @ list (25.0% down · 7.5%)
Estimated rent
$776/mo
Mortgage (P&I)
−$627
Tax + insurance
−$88
HOA
−$0
Vac / Maint / Mgmt
−$163
Net cashflow
$-101/mo
Annual
$-1,213/yr
Cap rate
5.28%
Cash-on-cash
-3.63%
DSCR
0.84
1% rule
0.65%
Cash to close
$33,460
Investor read
- This is a 1-bed/1.0-bath single-family listed at $120k.
- At list price, monthly cash flow is $-101 ($-1k/yr) — negative.
- To cash-flow at today's rent, offer at most $102k (14.9% below list).
- To meet the 1% rule (rent ≥ 1% of price), the offer needs to be $78k (35.0% below list).
- Only 11 days on market — expect competitive offers; lowballing is unlikely to land.
- Recommended offer: $78k (35.0% below list) — sets the bar for 1% rule.
- In year one you build about $13k of equity ($826 loan paydown + $12k appreciation (10.0% local appreciation)).
- Location reads 72/100 on livability (#128 in KY) — a middle-class / working-renter tenant base. Strengths: crime A+, cost of living A+, health & safety A+; Watch: amenities F, commute F, employment F.
- Hart County (rural): math 21% / reading 38% proficiency, ranked #119 of 165 in KY (top 72%) — low school quality limits family demand, transient renter base, plan for 1-2y turnover.
- Zoned schools: Munfordville Elementary School (math 27% / reading 44%, grade F, #293 of 676 statewide, top 44%, 492 students, 64% FRL); Hart County High School (math 22% / reading 32%, grade F, #158 of 254 statewide, top 68%, 679 students, 55% FRL).
- Market conditions: 47 active listings in the ZIP; 79 units permitted in Hart County in 2024 (60 in 5+ unit buildings).
- 3 sale attempts since 12y ago; this cycle's ask has dropped $49k (29%) from the opening price — seller is motivated, your offer sets the floor, not the list.
- By year 3, paydown + projected appreciation supports a ~$32k cash-out refi (75% LTV) — recoverable capital for the next deal without selling this one.
- Cap rate 5.3% vs local median 2.8% in Munfordville — top-decile yield for the area; either an underpriced asset or a hidden risk that comps aren't pricing in. Stress-test before assuming the spread holds.
Questions for listing agent
- What do current leases actually rent for vs. the listed asking? Can we see a recent rent roll and the last 12 months of T-12 income?
- Is there a deadline driving the sale (1031 exchange, divorce, estate, relocation)? That informs how much negotiation room exists.
- Schools are F-rated, which usually means shorter tenancies and higher turnover. Who's the typical renter profile here, and what's been the actual vacancy rate?
- The area grade is low — what's the realistic commute time and amenity access for the typical tenant pool here? Any planned neighborhood developments (good or bad) we should know about?
- What's the average days-on-market for RENTAL listings here right now (not sales)? A rising rental-DOM trend means longer vacancies and softer asking-rent achievability than the comps imply.
- What's the recent tenant-quality profile in this submarket — average credit score on applications, eviction rate, late-payment / NSF rate, and stable-employment percentage? A property-management company in the area should have these aggregated.
- How much new for-sale + rental construction is in the pipeline within 1–3 miles? Heavy new supply typically softens prices + rents 12–24 months out; constrained supply supports both.
CashFlowRE · CFR-ZQ7RN38YPPZ0DM
· Data 3 h ago
cashflowre.app · 2026-05-29