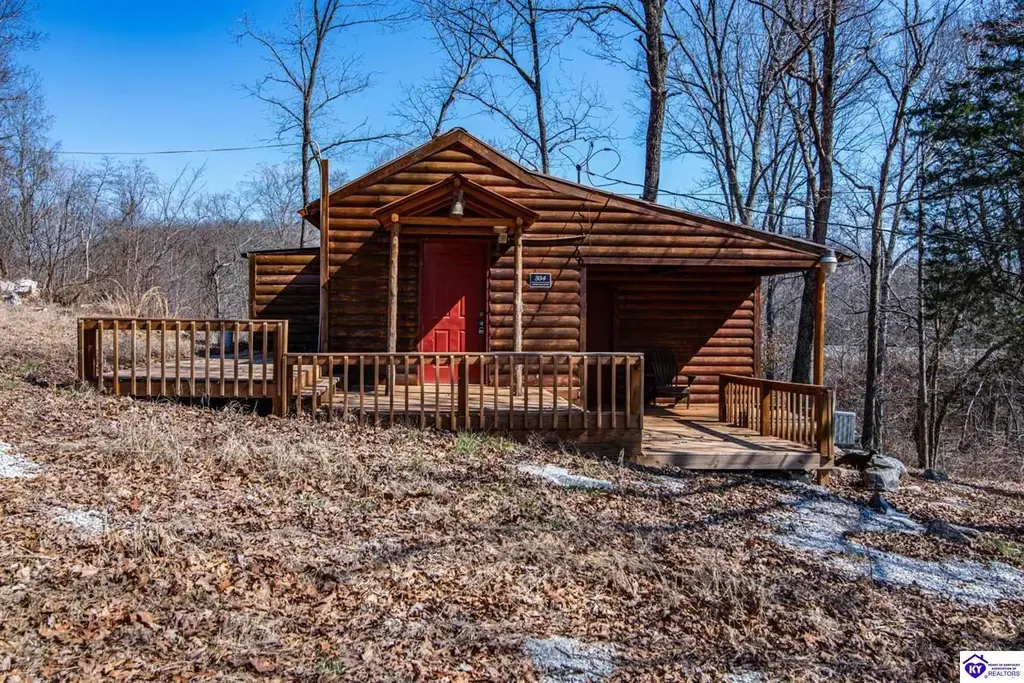
354 Raider Hollow Rd · Munfordville, KY
Flood risk 3/10 · Minor
- FEMA flood zone
- X (unshaded)
- Chance of flooding over 30 yrs
- 0.2%
- Est. flood insurance / yr
- $507 – $1,088
Fire risk 4/10 · Minor
- Est. fire insurance / yr
- $839 – $1,559
Heat risk 4/10 · Minor
- Hot days now (above 106°F)
- 6 days/yr
- Hot days in 30 yrs
- 16 days/yr
Wind risk 2/10 · Minimal
- Chance of severe wind over 30 yrs
- 3.0%
Air-quality risk 2/10 · Minimal
- Unhealthy air days now
- 0 days/yr
- Unhealthy air days in 30 yrs
- 1 days/yr
Risk factors via First Street. Map © Google.
Why this score? — see what drove the D grade
The composite is a weighted blend of 9 inputs, each scored 0–100. Each bar is that input's sub-score; the figure is the points it added to the 100-point composite (weight × sub-score).
- Appreciation +10.0/10.0
- Cash flow +8.7/30.0
- ARV discount +7.5/15.0
- Livability +3.6/5.0
- Rent growth +2.5/5.0
- Condition / age +2.5/5.0
- DSCR +2.4/10.0
- Schools +2.4/10.0
- 1% rule +1.5/10.0
$119,500
🖨 Deal sheet (PDF) 📄 Offer letter ✓ Due diligence
Listing remarks MLS
18.44+/- Acres. Log-sided, 500 sqft, 1 bed, 1bath (w/large walk-in closet) hunting cabin with water, electric, one car garage & storage building. Mostly wooded with some open bottom land for a garden or horses. Hunting opportunities throughout with deer stand and enclosed metal shooting blind to remain. Road frontage with phone and internet available.
Key facts
- Large deck
- Open floor plan
- Metal roof
Tags
Property features AI
Exterior
- Parking: Detached garage with 1 parking space
- Home design: Single-family residence; Residential property
- Construction: Log construction; Metal roof
- Exterior features: Deck; Outbuilding; Wooded lot
Interior
- Kitchen: Range; Oven; Refrigerator
- Flooring: Laminate
- Bathrooms: One full bathroom (main level)
- Heating & cooling: Heat pump; Electric heating; Natural gas heating; Central air conditioning
- Interior features: Eat-in kitchen; Vaulted ceilings
- Laundry & utility: Electric water heater
Neighborhood map
What this means for you Summary
Snapshot
- This is a 1-bed/1.0-bath single-family listed at $120k.
Deal economics
- At list price, monthly cash flow is $-101 ($-1k/yr) — negative.
- To cash-flow at today's rent, offer at most $102k (14.9% below list).
- To meet the 1% rule (rent ≥ 1% of price), the offer needs to be $78k (35.0% below list).
- Recommended offer: $78k (35.0% below list) — sets the bar for 1% rule.
- Cap rate 5.3% vs local median 2.8% in Munfordville — top-decile yield for the area; either an underpriced asset or a hidden risk that comps aren't pricing in. Stress-test before assuming the spread holds.
Location & tenants
- Location reads 72/100 on livability (#128 in KY) — a middle-class / working-renter tenant base. Strengths: crime A+, cost of living A+, health & safety A+; Watch: amenities F, commute F, employment F.
- Hart County (rural): math 21% / reading 38% proficiency, ranked #119 of 165 in KY (top 72%) — low school quality limits family demand, transient renter base, plan for 1-2y turnover.
- Zoned schools: Munfordville Elementary School (math 27% / reading 44%, grade F, #293 of 676 statewide, top 44%, 492 students, 64% FRL); Hart County High School (math 22% / reading 32%, grade F, #158 of 254 statewide, top 68%, 679 students, 55% FRL).
- Market conditions: 47 active listings in the ZIP; 79 units permitted in Hart County in 2024 (60 in 5+ unit buildings).
Forward outlook
- In year one you build about $13k of equity ($826 loan paydown + $12k appreciation (10.0% local appreciation)).
- By year 3, paydown + projected appreciation supports a ~$32k cash-out refi (75% LTV) — recoverable capital for the next deal without selling this one.
Negotiation context
- Only 11 days on market — expect competitive offers; lowballing is unlikely to land.
- 3 sale attempts since 12y ago; this cycle's ask has dropped $49k (29%) from the opening price — seller is motivated, your offer sets the floor, not the list.
Questions for the listing agent
- What do current leases actually rent for vs. the listed asking? Can we see a recent rent roll and the last 12 months of T-12 income?
- Is there a deadline driving the sale (1031 exchange, divorce, estate, relocation)? That informs how much negotiation room exists.
- Schools are F-rated, which usually means shorter tenancies and higher turnover. Who's the typical renter profile here, and what's been the actual vacancy rate?
- The area grade is low — what's the realistic commute time and amenity access for the typical tenant pool here? Any planned neighborhood developments (good or bad) we should know about?
- What's the average days-on-market for RENTAL listings here right now (not sales)? A rising rental-DOM trend means longer vacancies and softer asking-rent achievability than the comps imply.
- What's the recent tenant-quality profile in this submarket — average credit score on applications, eviction rate, late-payment / NSF rate, and stable-employment percentage? A property-management company in the area should have these aggregated.
- How much new for-sale + rental construction is in the pipeline within 1–3 miles? Heavy new supply typically softens prices + rents 12–24 months out; constrained supply supports both.
Investment metrics
- 1% rule
- 0.65% ✗
- Cap rate
- 5.28%
- Cash-on-cash
- -3.63%
- DSCR
- 0.84
- GRM
- 12.8
CMA / ARV
No comps found within radius.
Projected returns pro-forma
10.0% appreciation · 3.0% rent growth · sell at horizon
- IRR
- 21.7%
- Equity multiple
- 2.75×
- Total profit
- $58,587
- Equity at exit
- $107,655
- IRR
- 19.5%
- Equity multiple
- 6.30×
- Total profit
- $177,479
- Equity at exit
- $232,162
Cash invested: $33,460 (down + closing). Projections, not guarantees.
Landlord ↔ Tenant lean methodology
- Overall (STATE)
- 83 Strongly Landlord-Friendly
- State Kentucky
- 83 Strongly Landlord-Friendly · R+16
- County
- — inherits STATE
- City
- — inherits STATE
ZIP-level market 42765
- Home prices YoY
- 26.8%
- Active inventory
- 47
- Price-to-rent
- 12.8×
Monthly cashflow live
- Estimated rent
- $776 medium interval (Pro) →
- Mortgage (P&I)
- −$627
- Tax from tax record
- −$38 /mo · $456/yr
- Insurance
- −$50
- HOA
- −$0
- Vacancy / Maint / Mgmt
- −$163
- Net cashflow
- $-101
Break-even live
Sensitivity live
| Price | -10% $-33 | -5% $-67 | +0% $-101 | +5% $-135 | +10% $-169 |
|---|---|---|---|---|---|
| Rent | -10% $-162 | -5% $-132 | +0% $-101 | +5% $-70 | +10% $-40 |
| Rate | -1.0pp $-41 | -0.5pp $-71 | base $-101 | +0.5pp $-132 | +1.0pp $-164 |
UW: 25.0% down · 7.5% · 30yr · 1.5% tax · 5.0% vac · 8.0% maint · 8.0% mgmt
Financing live
Cash to close
- Down payment
- $29,875
- Closing costs
- $3,585
- Reserves months
- —
- Total cash needed
- —
Loan-product check · same deal, 3 products live
Conventional
25% down · 7.5% · 30yr
- Down + closing
- —
- Monthly P&I
- —
- Monthly cashflow
- —
- DSCR
- —
- Eligible?
- —
Personal DTI + credit; lowest rate.
DSCR
20% down · 8.5% · 30yr
- Down + closing
- —
- Monthly P&I
- —
- Monthly cashflow
- —
- DSCR
- —
- Eligible?
- —
No personal income docs; deal must DSCR.
Hard money
10% down · 12.0% · 12mo
- Down + closing
- —
- Monthly P&I
- —
- Monthly cashflow
- —
- DSCR
- —
- Eligible?
- —
Short-term bridge; refi at stabilization.
Listing history 26 events
-
2026-06-22days on market $119,500 Active 11 DOM
-
2026-06-21days on market $119,500 Active 10 DOM
-
2026-06-21days on market $119,500 Active 9 DOM
-
2026-06-18days on market $119,500 Active 7 DOM
-
2026-06-17days on market $119,500 Active 6 DOM
-
2026-06-16days on market $119,500 Active 5 DOM
-
2026-06-15days on market $119,500 Active 4 DOM
-
2026-06-13days on market $119,500 Active 2 DOM
-
2026-06-12pricedays on market $119,500 Active 1 DOM
-
2026-06-08days on market $139,500 Active 252 DOM
-
2026-06-07days on market $139,500 Active 251 DOM
-
2026-06-05days on market $139,500 Active 249 DOM
-
2026-06-04days on market $139,500 Active 247 DOM
-
2026-06-02days on market $139,500 Active 246 DOM
-
2026-06-01days on market $139,500 Active 245 DOM
-
2026-05-31days on market $139,500 Active 244 DOM
-
2026-05-31days on market $139,500 Active 243 DOM
-
2026-04-10price $139,500
-
2025-11-04price $148,990
-
2025-09-29$168,990 Active
-
2025-05-01price $169,000
-
2025-03-07price $189,000
-
2015-05-05soldstatus $125,000 359-char remark
Show marketing remark (359 chars)
18.44+/- Acres. Log-sided, 500 sqft, 1 bed, 1bath (w/large walk-in closet) hunting cabin with water, electric, one car garage & storage building. Mostly wooded with some open bottom land for a garden or horses. Hunting opportunities throughout with deer stand and enclosed metal shooting blind to remain. Road frontage with phone and internet available.
-
2015-05-05soldstatus $45,000
Show marketing remark (359 chars)
18.44+/- Acres. Log-sided, 500 sqft, 1 bed, 1bath (w/large walk-in closet) hunting cabin with water, electric, one car garage & storage building. Mostly wooded with some open bottom land for a garden or horses. Hunting opportunities throughout with deer stand and enclosed metal shooting blind to remain. Road frontage with phone and internet available.
-
2014-10-19$54,950 359-char remark
Show marketing remark (359 chars)
18.44+/- Acres. Log-sided, 500 sqft, 1 bed, 1bath (w/large walk-in closet) hunting cabin with water, electric, one car garage & storage building. Mostly wooded with some open bottom land for a garden or horses. Hunting opportunities throughout with deer stand and enclosed metal shooting blind to remain. Road frontage with phone and internet available.
-
2014-10-19$54,950
Show marketing remark (359 chars)
18.44+/- Acres. Log-sided, 500 sqft, 1 bed, 1bath (w/large walk-in closet) hunting cabin with water, electric, one car garage & storage building. Mostly wooded with some open bottom land for a garden or horses. Hunting opportunities throughout with deer stand and enclosed metal shooting blind to remain. Road frontage with phone and internet available.
ⓘ Source: listings_history table (triggers on properties + properties_extension) + one-shot
backfill from property_details.listing_events for pre-trigger history.
Tax reassessment forecast KY · Resets to sale price
- Current annual tax
- $456 · $38/mo
- Projected year-2 tax
- $1,028 · $86/mo
- Expected delta
- +$572/yr (+$48/mo · 125.4%)
ⓘ Screening estimate from a state-policy table — verify with the county assessor before closing.
Climate risk First Street
- Flood 3/10 Moderate FEMA zone X (unshaded) · 20% chance over 30 yrs
- Wildfire 4/10 Moderate
- Heat 4/10 Moderate 6 d/yr ≥106°F today · 16 d/yr by 30 yrs out
- Wind 2/10 Low 3% chance of damaging wind over 30 yrs
- Air quality 2/10 Low 0 unhealthy d/yr today · 1 by 30 yrs out
Nearby sold comps map
Loading sold comps map…
Walkable amenities ~0.75 mi
Loading nearby amenities…
Taxation est. · year 1
- Rental income
- $9,317
- − Mortgage interest
- −$6,694
- − Property taxes
- −$456
- − Insurance
- −$598
- − Repairs & maintenance
- −$745
- − Management
- −$745
- − Depreciation
- −$3,476
- Taxable loss
- −$3,398
- Est. tax savings @ 24.0%
- +$815
- After-tax cash flow
- $-398/yr
For passive investors: Depreciation is non-cash, so a rental often shows a tax loss while cash-flowing — sheltering income. Rental losses are passive: they offset passive income freely, and up to $25,000/yr can offset ordinary (W-2) income if you actively participate and your MAGI is under $100k (phasing out to $0 by $150k); unused losses carry forward. On sale, claimed depreciation is recaptured at up to 25%, and gains may owe capital-gains tax (a 1031 exchange can defer both). Figures are a year-1 estimate at your 24.0% rate — not tax advice; consult a CPA.
Schools (NCES district)
- District
- Hart County
- NCES district ID
- 2102640
- Math proficiency
- 21% ▼ -21.00%
- Reading proficiency
- 38% ▼ -20.00%
- Median HH income
- $34,931
- Composite
- 24.28/100
- National rank
- #7714
- State rank
- #119 of 165 in KY
Livability — Munfordville
- Score
- 72/100
- State rank
- #128
- US rank
- #6111
Category grades
Schools grade is shown separately in the Schools card above.
Census & demographics
- Census place
- Munfordville, KY
- Population (ZIP)
- 7,030
Population outlook (Hart County) Hauer SSP2
- Today (2025)
- 18,897 people
- By 2030
- 19,008 · +0.6%
- By 2040
- 19,032 · +0.7%
- By 2050
- 18,584 · -1.7%
- By 2075
- 17,303 · -8.4%
- By 2100
- 14,894 · -21.2%
Race, ethnicity, and origin ACS 2023
- Neighborhood character
- Predominantly White (92%)
- Race & ethnicity
- White 92% Hispanic / Latino 3% Black 3% Two or more races 2%
- Common ancestry
- Polish 2% Slovak 1% Iranian 1%
- Foreign-born
- 1% · China
- Languages at home
- 85% English-only · German/W. Germanic 13% Spanish 1% Chinese 1%
Political lean MEDSL · Hart
- 2024 margin
- Solid R (+60.0) · D 19.5% · R 79.6%
- 2008→2024 swing
- -29.1pp toward R · 2008: -30.9pp · 2024: -60.0pp
- All cycles
- 2024: R+60.0 2020: R+53.0 2016: R+49.4 2012: R+29.8 2008: R+30.9
Not yet ingested
- Civics
- —
Market trends
- HPI YoY
- ▲ 77.29%
- Current HPI
- 365.6917
- Rent YoY
- —
- Metro
- —
- State GDP YoY
- ▲ 1.81%
- F500 in state
- 4
Industry mix (Fortune 500 HQ in KY)
| Industry | F500 HQs | Revenue |
|---|---|---|
| Healthcare | 1 | $118B |
|
||
| Food / Beverage | 1 | $7B |
|
||
Price history
+153.9% since first listed9 events — show timeline
- 2026-04-10 Price Changed $139,500 HKARMLS
- 2025-11-04 Price Changed $148,990 HKARMLS
- 2025-09-29 Listed $168,990 HKARMLS
- 2025-05-01 Price Changed $169,000 HKARMLS
- 2025-03-07 Price Changed $189,000 HKARMLS
- 2015-05-05 Sold (MLS) $45,000 HKARMLS
- 2015-05-05 Sold (MLS) $125,000 Metro Search MLS
- 2014-10-19 Listed $54,950 HKARMLS
- 2014-10-19 Listed $54,950 Metro Search MLS
Property tax history
+6.7%/yrLatest (2025): $456 · +2.1% YoY. Source: county tax records.
Cash-flow waterfall
monthlySold comps — $/sqft
last 12 mo · ≤1 miLoading sold comps…