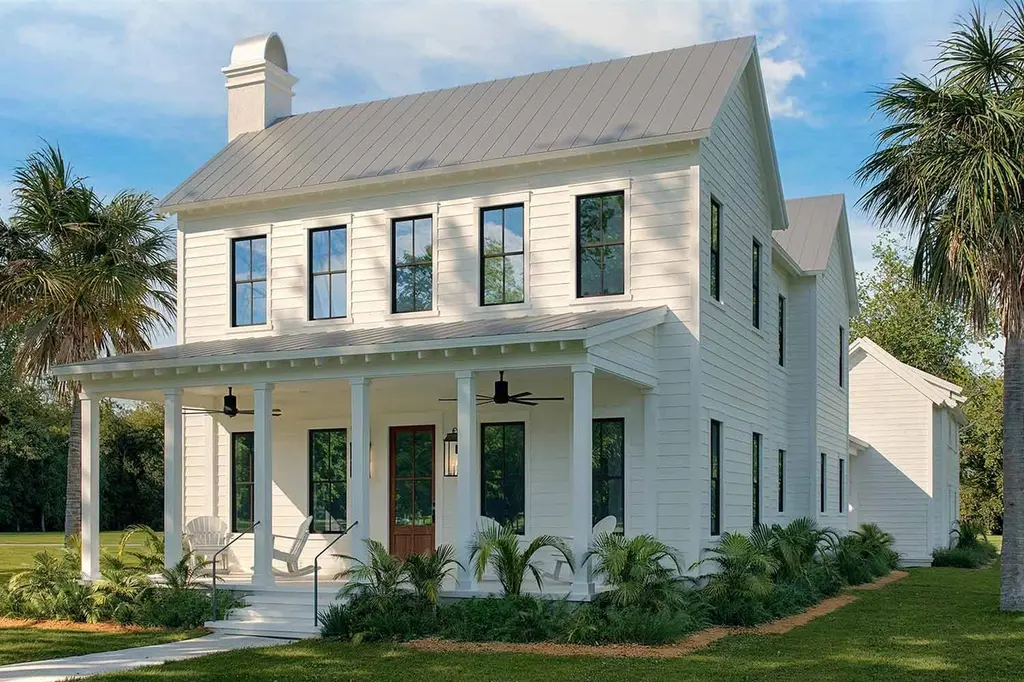
Capers Blade Plan
Kiawah Island, SC 29455
$1F
5 bd · 4.5 ba ·
3,780 sqft ·
Built —
· SingleFamily
· Active
· 38 DOM
Cashflow @ list (25.0% down · 7.5%)
Estimated rent
$3,308/mo
Mortgage (P&I)
−$14,451
Tax + insurance
−$4,593
HOA
−$0
Vac / Maint / Mgmt
−$695
Net cashflow
$-16,430/mo
Annual
$-197,166/yr
Cap rate
-0.86%
Cash-on-cash
-25.55%
DSCR
-0.14
1% rule
0.12%
Cash to close
$771,574
Investor read
- This is a 5-bed/4.5-bath single-family listed at $1.
- At list price, monthly cash flow is $-16k ($-197k/yr) — negative.
- The deal already cash-flows at list — no discount required.
- Meets the 1% rule at list price ($3k rent vs $1).
- It's been on market 38 days — a 3% lower offer ($0) is reasonable based on typical stale-listing flexibility.
- Local home prices are declining (-3.0%/yr); year-one equity from $19k of loan paydown is wiped out by about $83k of value loss. Plan a longer hold.
- Location reads 64/100 on livability (#154 in SC) — a middle-class / working-renter tenant base. Strengths: crime A+, employment A+; Watch: housing C-, amenities F, commute F.
- Charleston 01 (urban): math 48% / reading 53% proficiency, ranked #7 of 80 in SC (top 9%) — acceptable for families but not a draw, mixed tenant base, ~2y average lease.
- Zoned schools: Montessori Community School (math 67% / reading 77%, grade A-, #26 of 597 statewide, top 5%, 273 students, 24% FRL); Haut Gap Middle (math 39% / reading 44%, grade F, #68 of 229 statewide, top 31%, 444 students, 100% FRL); St. Johns High (math 42% / reading 72%, grade C, #120 of 196 statewide, top 64%, 387 students, 100% FRL) — zoned schools average 75% FRL vs 44% district-wide (30 pts higher); higher-poverty schools than district average — tighter screening recommended.
- Watch-outs: property tax is 4133430.0% of price.
- Market conditions: Rents rising (+3.0%/yr); 586 active listings in the ZIP; high-income renter base; 4,156 units permitted in Charleston County in 2024 (857 in 5+ unit buildings).
- Charleston County population projected at +44% by 2050 — long-run rental-demand tailwind backs the buy-and-hold thesis.
- Cap rate -0.9% vs local median 0.0% in Kiawah Island — below-typical yield; the buyer is paying a premium for something (appreciation thesis, condition, location) that the cap rate doesn't capture.
- This rent runs 33% of the median local income ($121k/yr) — at the standard rent-burdened threshold; future hikes will face affordability resistance.
Questions for listing agent
- What do current leases actually rent for vs. the listed asking? Can we see a recent rent roll and the last 12 months of T-12 income?
- It's been on market 38 days. Have you received any prior offers? Is the seller open to a 5% concession, seller financing, or rate buy-down credit?
- Property tax is high relative to price — has the assessment been appealed recently, and will the sale trigger a re-assessment?
- Is there a deadline driving the sale (1031 exchange, divorce, estate, relocation)? That informs how much negotiation room exists.
- The area grade is low — what's the realistic commute time and amenity access for the typical tenant pool here? Any planned neighborhood developments (good or bad) we should know about?
- What's the average days-on-market for RENTAL listings here right now (not sales)? A rising rental-DOM trend means longer vacancies and softer asking-rent achievability than the comps imply.
- What's the recent tenant-quality profile in this submarket — average credit score on applications, eviction rate, late-payment / NSF rate, and stable-employment percentage? A property-management company in the area should have these aggregated.
- How much new for-sale + rental construction is in the pipeline within 1–3 miles? Heavy new supply typically softens prices + rents 12–24 months out; constrained supply supports both.
CashFlowRE · CFR-ZQVKD1B7RCH6BN
· Data 9 h ago
cashflowre.app · 2026-05-29