 🏗️ New Construction
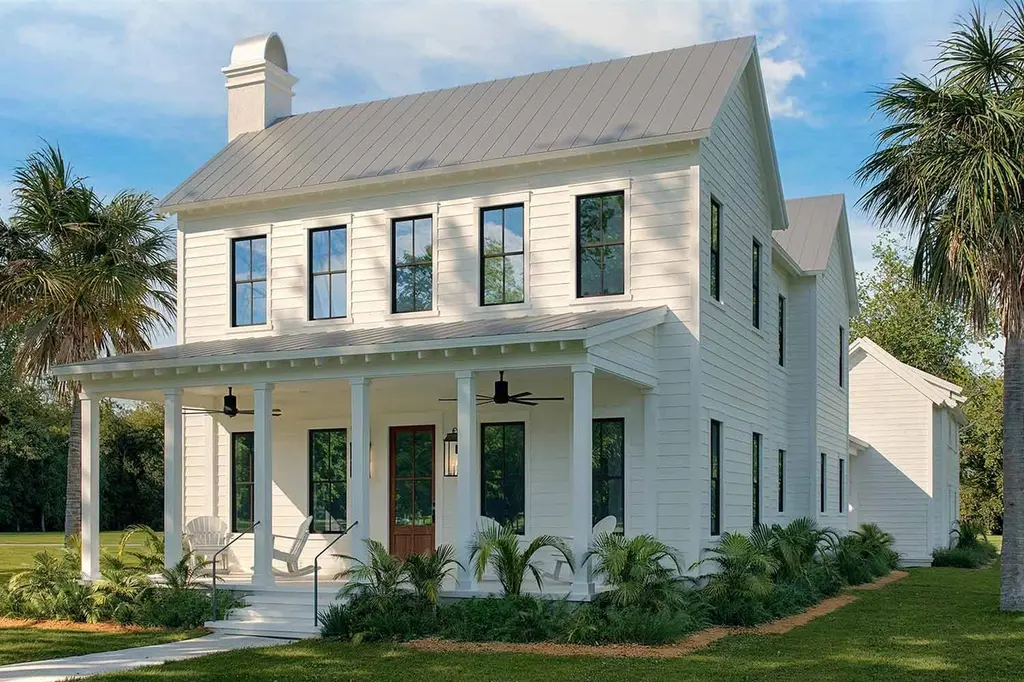
Capers Blade Plan · Kiawah Island, SC
Flood risk No data
- FEMA flood zone
- —
- Chance of flooding over 30 yrs
- —
- Est. flood insurance / yr
- —
Fire risk No data
- Est. fire insurance / yr
- —
Heat risk No data
- Hot days now (above threshold)
- —
- Hot days in 30 yrs
- —
Wind risk No data
- Chance of severe wind over 30 yrs
- —
Air-quality risk No data
- Unhealthy air days now
- —
- Unhealthy air days in 30 yrs
- —
Risk factors via First Street. Map © Google.
Why this score? — see what drove the F grade
The composite is a weighted blend of 9 inputs, each scored 0–100. Each bar is that input's sub-score; the figure is the points it added to the 100-point composite (weight × sub-score).
- ARV discount +7.5/15.0
- Schools +4.3/10.0
- Rent growth +3.2/5.0
- Livability +3.2/5.0
- Condition / age +2.5/5.0
- Cash flow +0.0/30.0
- 1% rule +0.0/10.0
- DSCR +0.0/10.0
- Appreciation +0.0/10.0
$1
🖨 Deal sheet (PDF) 📄 Offer letter ✓ Due diligence
Listing remarks
A deep porch and generous foyer invite you in, leading to light-filled breezeways and grand windows that bathe the living spaces in natural light, effortlessly blending indoor and outdoor areas. The first floor boasts a gourmet kitchen with an adjoining scullery, Calacatta marble countertops, and a large island are a stunning blend of artistry and function. At the heart of the home, a custom plaster fireplace with a stone hearth offers a luxurious setting for relaxation and entertaining. The main-level primary suite is a private sanctuary with a spa-like bathroom featuring hardwood and Calacatta marble floors, dual walk-in closets, and a private coffee bar. Upstairs, two additional bedrooms
Key facts
- Observation tower
- Gourmet kitchen
- Spa-like bathroom
Tags
Property features AI
Finance
- Other: Listing status: Active; Plan inventory type
Exterior
- Parking: 2 parking spaces
- Home design: Capers Blade plan (new construction plan); Located at 2501 Mullet Hall Dr, Johns Island, SC
Interior
- Bedrooms: 5 bedrooms
- Bathrooms: 4 full bathrooms and 1 half bathroom
- Interior features: Open living area (3,780 finished area)
Neighborhood map
What this means for you Summary
Snapshot
- This is a 5-bed/4.5-bath single-family listed at $1.
Deal economics
- At list price, monthly cash flow is $-16k ($-197k/yr) — negative.
- The deal already cash-flows at list — no discount required.
- Meets the 1% rule at list price ($3k rent vs $1).
- Cap rate -0.9% vs local median 0.0% in Kiawah Island — below-typical yield; the buyer is paying a premium for something (appreciation thesis, condition, location) that the cap rate doesn't capture.
Location & tenants
- Location reads 64/100 on livability (#154 in SC) — a middle-class / working-renter tenant base. Strengths: crime A+, employment A+; Watch: housing C-, amenities F, commute F.
- Charleston 01 (urban): math 48% / reading 53% proficiency, ranked #7 of 80 in SC (top 9%) — acceptable for families but not a draw, mixed tenant base, ~2y average lease.
- Zoned schools: Montessori Community School (math 67% / reading 77%, grade A-, #26 of 597 statewide, top 5%, 273 students, 24% FRL); Haut Gap Middle (math 39% / reading 44%, grade F, #68 of 229 statewide, top 31%, 444 students, 100% FRL); St. Johns High (math 42% / reading 72%, grade C, #120 of 196 statewide, top 64%, 387 students, 100% FRL) — zoned schools average 75% FRL vs 44% district-wide (30 pts higher); higher-poverty schools than district average — tighter screening recommended.
- Market conditions: Rents rising (+3.0%/yr); 586 active listings in the ZIP; high-income renter base; 4,156 units permitted in Charleston County in 2024 (857 in 5+ unit buildings).
- This rent runs 33% of the median local income ($121k/yr) — at the standard rent-burdened threshold; future hikes will face affordability resistance.
Forward outlook
- Local home prices are declining (-3.0%/yr); year-one equity from $19k of loan paydown is wiped out by about $83k of value loss. Plan a longer hold.
- Charleston County population projected at +44% by 2050 — long-run rental-demand tailwind backs the buy-and-hold thesis.
Negotiation context
- It's been on market 38 days — a 3% lower offer ($0) is reasonable based on typical stale-listing flexibility.
Risks & watch-outs
- Watch-outs: property tax is 4133430.0% of price.
Questions for the listing agent
- What do current leases actually rent for vs. the listed asking? Can we see a recent rent roll and the last 12 months of T-12 income?
- It's been on market 38 days. Have you received any prior offers? Is the seller open to a 5% concession, seller financing, or rate buy-down credit?
- Property tax is high relative to price — has the assessment been appealed recently, and will the sale trigger a re-assessment?
- Is there a deadline driving the sale (1031 exchange, divorce, estate, relocation)? That informs how much negotiation room exists.
- The area grade is low — what's the realistic commute time and amenity access for the typical tenant pool here? Any planned neighborhood developments (good or bad) we should know about?
- What's the average days-on-market for RENTAL listings here right now (not sales)? A rising rental-DOM trend means longer vacancies and softer asking-rent achievability than the comps imply.
- What's the recent tenant-quality profile in this submarket — average credit score on applications, eviction rate, late-payment / NSF rate, and stable-employment percentage? A property-management company in the area should have these aggregated.
- How much new for-sale + rental construction is in the pipeline within 1–3 miles? Heavy new supply typically softens prices + rents 12–24 months out; constrained supply supports both.
Investment metrics
- 1% rule
- 0.12% ✗
- Cap rate
- -0.86%
- Cash-on-cash
- -25.55%
- DSCR
- -0.14
- GRM
- 69.4
CMA / ARV
- ARV (on-the-fly)
- $2,755,620
- Comps found
- 6
Show comp detail 6 sales within ~0.75 mi
| Address | Dist | Beds/Ba | Sqft | Sold | Price | $/sf | Match |
|---|---|---|---|---|---|---|---|
| 3008 Eventide Dr | 0.31mi | 5/4.5 | 3,900 (+3%) | 18mo | $5,399,000 | $1,384 | 66 |
| 5761 Kiawah River Dr | 0.42mi | 5/5.5 | 3,669 (-3%) | 19mo | $1,950,000 | $531 | 56 |
| 4054 Drift Ln | 0.44mi | 4/4.5 (-1) | 3,633 (-4%) | 15mo | $2,650,000 | $729 | 56 |
| 1006 Basin Ln | 0.42mi | 4/4.5 (-1) | 3,342 (-12%) | 12mo | $2,530,000 | $757 | 46 |
| 4039 Chantey Crst | 0.60mi | 4/3.5 (-1) | 3,253 (-14%) | 3mo | $1,749,500 | $538 | 37 |
| 6037 Honey Hole Hvn | 0.52mi | 4/3.5 (-1) | 3,253 (-14%) | 17mo | $1,600,000 | $492 | 30 |
Match score weights: distance 35% · size 25% · config 20% · recency 20%. Top-matched comps best support the ARV.
Projected returns pro-forma
-3.0% appreciation · 2.95% rent growth · sell at horizon
- IRR
- -74.1%
- Equity multiple
- -0.94×
- Total profit
- $-1,493,112
- Equity at exit
- $410,872
- IRR
- —
- Equity multiple
- -2.43×
- Total profit
- $-2,648,148
- Equity at exit
- $238,256
Cash invested: $771,574 (down + closing). Projections, not guarantees.
Landlord ↔ Tenant lean methodology
- Overall (STATE)
- 90 Strongly Landlord-Friendly
- State South Carolina
- 90 Strongly Landlord-Friendly · R+6
- County
- — inherits STATE
- City
- — inherits STATE
ZIP-level market 29455
- Rents YoY
- 3.0%
- Active inventory
- 586
Monthly cashflow live
- Estimated rent
- $3,308 medium interval (Pro) →
- Mortgage (P&I)
- −$14,451
- Tax est. 1.5%
- −$3,445 /mo · $41,334/yr
- Insurance
- −$1,148
- HOA
- −$0
- Vacancy / Maint / Mgmt
- −$695
- Net cashflow
- $-16,430
Break-even live
Sensitivity live
| Price | -10% $-14,526 | -5% $-15,478 | +0% $-16,430 | +5% $-17,383 | +10% $-18,335 |
|---|---|---|---|---|---|
| Rent | -10% $-16,692 | -5% $-16,561 | +0% $-16,430 | +5% $-16,300 | +10% $-16,169 |
| Rate | -1.0pp $-15,043 | -0.5pp $-15,730 | base $-16,430 | +0.5pp $-17,145 | +1.0pp $-17,871 |
UW: 25.0% down · 7.5% · 30yr · 1.5% tax · 5.0% vac · 8.0% maint · 8.0% mgmt
Financing live
Cash to close
- Down payment
- $688,905
- Closing costs
- $82,669
- Reserves months
- —
- Total cash needed
- —
Loan-product check · same deal, 3 products live
Conventional
25% down · 7.5% · 30yr
- Down + closing
- —
- Monthly P&I
- —
- Monthly cashflow
- —
- DSCR
- —
- Eligible?
- —
Personal DTI + credit; lowest rate.
DSCR
20% down · 8.5% · 30yr
- Down + closing
- —
- Monthly P&I
- —
- Monthly cashflow
- —
- DSCR
- —
- Eligible?
- —
No personal income docs; deal must DSCR.
Hard money
10% down · 12.0% · 12mo
- Down + closing
- —
- Monthly P&I
- —
- Monthly cashflow
- —
- DSCR
- —
- Eligible?
- —
Short-term bridge; refi at stabilization.
Listing history 13 events
-
2026-06-22days on market $1 Active 38 DOM
-
2026-06-18days on market $1 Active 35 DOM
-
2026-06-17days on market $1 Active 34 DOM
-
2026-06-16days on market $1 Active 33 DOM
-
2026-06-15days on market $1 Active 32 DOM
-
2026-06-10days on market $1 Active 27 DOM
-
2026-06-09days on market $1 Active 26 DOM
-
2026-06-08days on market $1 Active 25 DOM
-
2026-06-07days on market $1 Active 24 DOM
-
2026-06-05days on market $1 Active 21 DOM
-
2026-06-03days on market $1 Active 20 DOM
-
2026-06-01days on market $1 Active 18 DOM
-
2026-05-31days on market $1 Active 17 DOM
ⓘ Source: listings_history table (triggers on properties + properties_extension) + one-shot
backfill from property_details.listing_events for pre-trigger history.
Nearby sold comps map
Loading sold comps map…
Walkable amenities ~0.75 mi
Loading nearby amenities…
Taxation est. · year 1
- Rental income
- $39,691
- − Mortgage interest
- −$154,358
- − Property taxes
- −$41,334
- − Insurance
- −$13,778
- − Repairs & maintenance
- −$3,175
- − Management
- −$3,175
- − Depreciation
- −$80,163
- Taxable loss
- −$256,293
- Est. tax savings @ 24.0%
- +$61,510
- After-tax cash flow
- $-135,656/yr
For passive investors: Depreciation is non-cash, so a rental often shows a tax loss while cash-flowing — sheltering income. Rental losses are passive: they offset passive income freely, and up to $25,000/yr can offset ordinary (W-2) income if you actively participate and your MAGI is under $100k (phasing out to $0 by $150k); unused losses carry forward. On sale, claimed depreciation is recaptured at up to 25%, and gains may owe capital-gains tax (a 1031 exchange can defer both). Figures are a year-1 estimate at your 24.0% rate — not tax advice; consult a CPA.
Schools (NCES district)
- District
- Charleston 01
- NCES district ID
- 4501440
- Math proficiency
- 48% ▼ -2.00%
- Reading proficiency
- 53% ▬ 0.00%
- Median HH income
- $52,376
- Composite
- 43.41/100
- National rank
- #3018
- State rank
- #7 of 80 in SC
Livability — Kiawah Island
- Score
- 64/100
- State rank
- #154
- US rank
- #14517
Category grades
Schools grade is shown separately in the Schools card above.
Census & demographics
- County
- Charleston County · 366,793 people
- Metro
- Charleston-North Charleston, SC
- Population (ZIP)
- 27,576
- Household income
- $121,372
- Rent vs Own
- Severe rent burden
- 304.0
Population outlook (Charleston County) Hauer SSP2
- Today (2025)
- 480,562 people
- By 2030
- 525,921 · +9.4%
- By 2040
- 612,189 · +27.4%
- By 2050
- 691,627 · +43.9%
- By 2075
- 847,979 · +76.5%
- By 2100
- 926,482 · +92.8%
Race, ethnicity, and origin ACS 2023
- Neighborhood character
- Predominantly White (75%)
- Race & ethnicity
- White 75% Black 11% Hispanic / Latino 8% Two or more races 6% Native American 3%
- Hispanic origin (detail)
- Mexican 4%
- Common ancestry
- Lithuanian 5% Romanian 4% Slovak 3%
- Foreign-born
- 5% · Canada, Dominican Republic
- Languages at home
- 92% English-only · Spanish 6%
Political lean MEDSL · Charleston
- 2024 margin
- Lean D (+5.7) · D 51.9% · R 46.3% · Other 1.8%
- 2008→2024 swing
- -2.7pp toward R · 2008: 8.3pp · 2024: 5.7pp
- All cycles
- 2024: D+5.7 2020: D+12.9 2016: D+7.9 2012: D+2.4 2008: D+8.3
Not yet ingested
- Civics
- —
Market trends
- HPI YoY
- ▼ -223.02%
- Current HPI
- 297.7408
- Rent YoY
- ▲ 2.95%
- Metro
- Charleston-North Charleston, SC
- State GDP YoY
- ▲ 4.51%
- F500 in state
- 2
Industry mix (Fortune 500 HQ in SC)
| Industry | F500 HQs | Revenue |
|---|---|---|
| Packaging | 1 | $7B |
|
||
Cash-flow waterfall
monthlySold comps — $/sqft
last 12 mo · ≤1 miLoading sold comps…