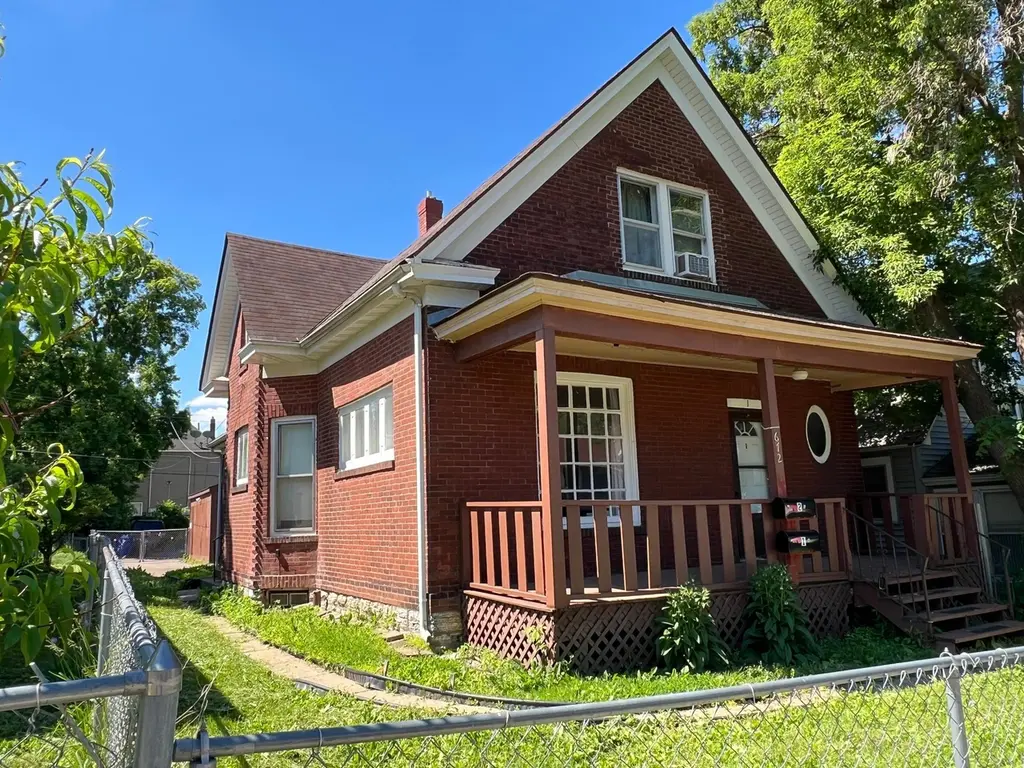
672 Case Ave
St. Paul, MN 55106
$250,000C+
4 bd · 2.0 ba ·
1,452 sqft ·
Built 1898
· MultiFamily
· Active
· 13 DOM
Cashflow @ list (25.0% down · 7.5%)
Estimated rent
$3,081/mo
Mortgage (P&I)
−$1,311
Tax + insurance
−$442
HOA
−$0
Vac / Maint / Mgmt
−$647
Net cashflow
$681/mo
Annual
$8,178/yr
Cap rate
9.56%
Cash-on-cash
11.68%
DSCR
1.52
1% rule
1.23%
Cash to close
$70,000
Investor read
- This is a 2 × 2-bed/1.0-bath units multifamily listed at $250k.
- At list price, monthly cash flow is $681 ($8k/yr) — positive. Per door: $341/mo.
- The deal already cash-flows at list — no discount required.
- Meets the 1% rule at list price ($3k rent vs $250k).
- Only 13 days on market — expect competitive offers; lowballing is unlikely to land.
- Local home prices are declining (-3.0%/yr); year-one equity from $2k of loan paydown is wiped out by about $8k of value loss. Plan a longer hold.
- Location reads: area grade C — affects rentability + tenant quality, not the cash-flow math above.
- St. Paul Public School District (urban): math 21% / reading 33% proficiency, ranked #270 of 301 in MN (top 90%) — low school quality limits family demand, transient renter base, plan for 1-2y turnover; 64% free/reduced lunch — lower-income household profile, screen leases tightly.
- Zoned schools: Farnsworth Aerospace Lower (math 5% / reading 15%, grade F, #813 of 857 statewide, top 97%, 425 students, 83% FRL) — zoned schools average 83% FRL vs 64% district-wide (19 pts higher); higher-poverty schools than district average — tighter screening recommended.
- Zoned-school proficiency averages 10% at this address vs 27% district-wide (-17 pts) — the specific schools serving this property underperform the St. Paul Public School District average; the district grade overstates school quality for this exact location.
- Watch-outs: built in 1898 — expect roof / HVAC / electrical / plumbing capex.
- Market conditions: Rents rising fast (+6.3%/yr); 254 active listings in the ZIP; 1,202 units permitted in Ramsey County in 2024 (880 in 5+ unit buildings).
- Ramsey County population projected at +27% by 2050 — long-run rental-demand tailwind backs the buy-and-hold thesis.
- 14 sale attempts since 22y ago with the ask held roughly flat each time — persistent listings suggest the price (not the market) is what's stuck; bring a comps-based counter.
- At projected returns (-3.0% appreciation + 6.3% rent growth), your $70k cash investment doubles in ~8 years — after that, you're playing with house money.
- At $3,081/mo this rent would consume 53% of the median local household income ($70k/yr) (locally 2046% of renters already pay >50% of income on rent) — very limited rent-growth headroom before tenants either downsize or default.
Questions for listing agent
- Can we see the unit-by-unit rent roll, current vacancy, and any below-market leases? What's the average tenancy length?
- What capital expenditures (roof, boiler, parking lot, exteriors) have been made in the last 5 years, and what's planned in the next 2?
- Built in 1898 — when were the roof, HVAC, electrical panel, plumbing, and water heater last replaced?
- Is there a deadline driving the sale (1031 exchange, divorce, estate, relocation)? That informs how much negotiation room exists.
- What's the average days-on-market for RENTAL listings here right now (not sales)? A rising rental-DOM trend means longer vacancies and softer asking-rent achievability than the comps imply.
- What's the recent tenant-quality profile in this submarket — average credit score on applications, eviction rate, late-payment / NSF rate, and stable-employment percentage? A property-management company in the area should have these aggregated.
- How much new apartment / multifamily construction is in the pipeline within 1–3 miles? Heavy new supply (>2% of stock underway) typically softens rents 12–24 months out; light construction supports rent growth.
CashFlowRE · CFR-ZQZ3AA24CRT19H
· Data 20 h ago
cashflowre.app · 2026-05-29