 Duplex
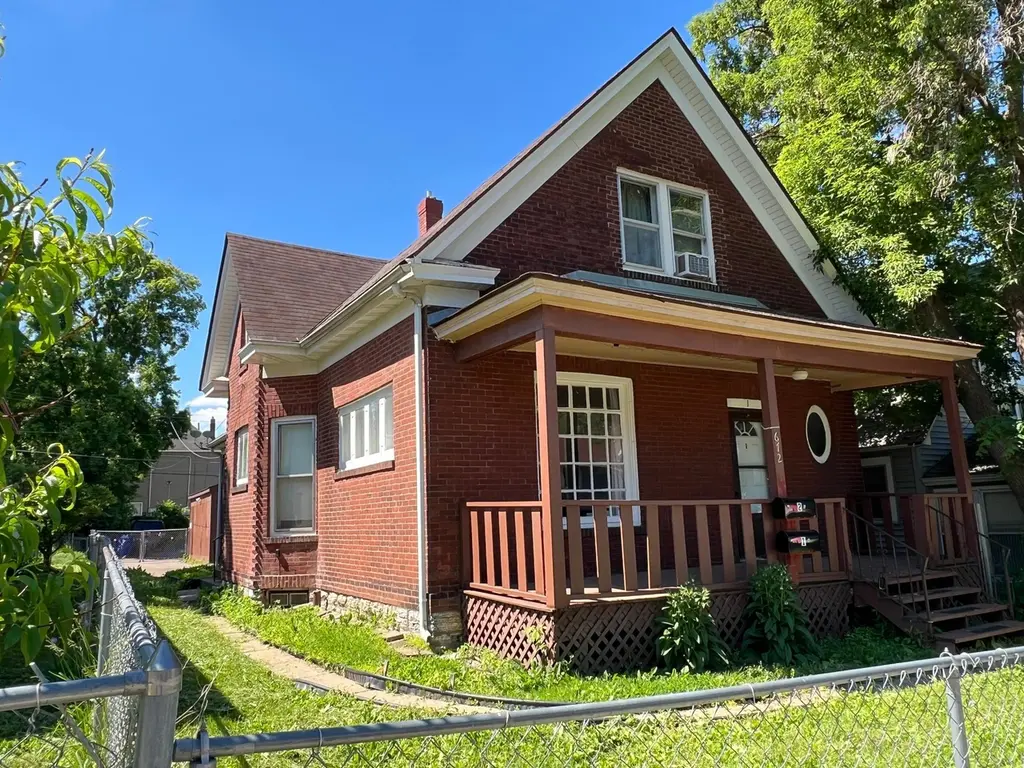
672 Case Ave · St. Paul, MN
Flood risk 1/10 · Minimal
- FEMA flood zone
- X (unshaded)
- Chance of flooding over 30 yrs
- 0.0%
- Est. flood insurance / yr
- $473 – $860
Fire risk 1/10 · Minimal
- Est. fire insurance / yr
- $888 – $1,650
Heat risk 2/10 · Minimal
- Hot days now (above 99°F)
- 7 days/yr
- Hot days in 30 yrs
- 14 days/yr
Wind risk 2/10 · Minimal
- Chance of severe wind over 30 yrs
- —
Air-quality risk 2/10 · Minimal
- Unhealthy air days now
- 1 days/yr
- Unhealthy air days in 30 yrs
- 1 days/yr
Risk factors via First Street. Map © Google.
Why this score? — see what drove the C+ grade
The composite is a weighted blend of 9 inputs, each scored 0–100. Each bar is that input's sub-score; the figure is the points it added to the 100-point composite (weight × sub-score).
- Cash flow +26.8/30.0
- DSCR +9.2/10.0
- ARV discount +7.5/15.0
- 1% rule +7.3/10.0
- Rent growth +4.1/5.0
- Livability +2.5/5.0
- Condition / age +2.5/5.0
- Schools +2.4/10.0
- Appreciation +0.0/10.0
$250,000
🖨 Deal sheet (PDF) 📄 Offer letter ✓ Due diligence
Multi-family units
County records classify this as Multi-Family (2-4 Unit). Listing-text estimate: 2 units. confirmed
Listing remarks MLS
BACK ON THE MARKET! Great Opportunity for Investors or First-Time Home Buyers! This all-brick exterior, well-maintained duplex is move-in ready. Perfect for those looking to occupy one unit while renting out the other! The property features a two-car garage, extra parking, and a gated fence. Each unit has 2 bedrooms and 1 bath. Enjoy the charming open front porch, fresh paint, and new carpet. This up-down duplex not only offers immediate livability but also investment potential for generating steady rental income or a combination of both!
Key facts
- Extra parking
- Remodeled kitchen
- Open front porch
Tags
Property features AI
Finance
- Other: Above-grade finished area about 1,452; Below-grade area about 980; Total building area about 2,432
- Financial info: Property used as residential income with 2 total units
Exterior
- Parking: Asphalt parking; Detached/attached 2-car garage (2 garage spaces)
- Utilities: City water connected; City sewer connected; Natural gas
- Home design: Residential income property — Duplex (up and down); One and one-half levels; Owner occupied
- Construction: Stone foundation; Asphalt roof (over 8 years old); Foundation area approximately 980
- Exterior features: Front porch; Stone and vinyl exterior; Partial chain link fencing; City street frontage with curbs, paved streets and sidewalks; Lot dimensions approximately 40 x 125
Interior
- Kitchen: Range and refrigerator in each unit
- Bedrooms: 4 total bedrooms (property-level); Unit 1: 2 bedrooms; Unit 2: 2 bedrooms
- Bathrooms: Unit 1: 1 full bathroom; Unit 2: 1 three-quarter bathroom
- Heating & cooling: Boiler / hot water heating; Window air conditioning in each unit
- Interior features: Daylight/Lookout windows in basement; Full unfinished basement; Kitchen windows
- Laundry & utility: Boiler hot water heating
Neighborhood map
What this means for you Summary
Snapshot
- This is a 2 × 2-bed/1.0-bath units multifamily listed at $250k.
Deal economics
- At list price, monthly cash flow is $681 ($8k/yr) — positive. Per door: $341/mo.
- The deal already cash-flows at list — no discount required.
- Meets the 1% rule at list price ($3k rent vs $250k).
Location & tenants
- Location reads: area grade C — affects rentability + tenant quality, not the cash-flow math above.
- St. Paul Public School District (urban): math 21% / reading 33% proficiency, ranked #270 of 301 in MN (top 90%) — low school quality limits family demand, transient renter base, plan for 1-2y turnover; 64% free/reduced lunch — lower-income household profile, screen leases tightly.
- Zoned schools: Farnsworth Aerospace Lower (math 5% / reading 15%, grade F, #813 of 857 statewide, top 97%, 425 students, 83% FRL) — zoned schools average 83% FRL vs 64% district-wide (19 pts higher); higher-poverty schools than district average — tighter screening recommended.
- Zoned-school proficiency averages 10% at this address vs 27% district-wide (-17 pts) — the specific schools serving this property underperform the St. Paul Public School District average; the district grade overstates school quality for this exact location.
- Market conditions: Rents rising fast (+6.3%/yr); 254 active listings in the ZIP; 1,202 units permitted in Ramsey County in 2024 (880 in 5+ unit buildings).
- At $3,081/mo this rent would consume 53% of the median local household income ($70k/yr) (locally 2046% of renters already pay >50% of income on rent) — very limited rent-growth headroom before tenants either downsize or default.
Forward outlook
- Local home prices are declining (-3.0%/yr); year-one equity from $2k of loan paydown is wiped out by about $8k of value loss. Plan a longer hold.
- Ramsey County population projected at +27% by 2050 — long-run rental-demand tailwind backs the buy-and-hold thesis.
- At projected returns (-3.0% appreciation + 6.3% rent growth), your $70k cash investment doubles in ~8 years — after that, you're playing with house money.
Negotiation context
- Only 13 days on market — expect competitive offers; lowballing is unlikely to land.
- 14 sale attempts since 22y ago with the ask held roughly flat each time — persistent listings suggest the price (not the market) is what's stuck; bring a comps-based counter.
Risks & watch-outs
- Watch-outs: built in 1898 — expect roof / HVAC / electrical / plumbing capex.
Questions for the listing agent
- Can we see the unit-by-unit rent roll, current vacancy, and any below-market leases? What's the average tenancy length?
- What capital expenditures (roof, boiler, parking lot, exteriors) have been made in the last 5 years, and what's planned in the next 2?
- Built in 1898 — when were the roof, HVAC, electrical panel, plumbing, and water heater last replaced?
- Is there a deadline driving the sale (1031 exchange, divorce, estate, relocation)? That informs how much negotiation room exists.
- What's the average days-on-market for RENTAL listings here right now (not sales)? A rising rental-DOM trend means longer vacancies and softer asking-rent achievability than the comps imply.
- What's the recent tenant-quality profile in this submarket — average credit score on applications, eviction rate, late-payment / NSF rate, and stable-employment percentage? A property-management company in the area should have these aggregated.
- How much new apartment / multifamily construction is in the pipeline within 1–3 miles? Heavy new supply (>2% of stock underway) typically softens rents 12–24 months out; light construction supports rent growth.
Investment metrics
- 1% rule
- 1.23% ✓
- Cap rate
- 9.56%
- Cash-on-cash
- 11.68%
- DSCR
- 1.52
- GRM
- 6.8
CMA / ARV
No comps found within radius.
Projected returns pro-forma
-3.0% appreciation · 6.26% rent growth · sell at horizon
- IRR
- 4.8%
- Equity multiple
- 1.19×
- Total profit
- $13,390
- Equity at exit
- $37,276
- IRR
- 17.1%
- Equity multiple
- 2.62×
- Total profit
- $113,592
- Equity at exit
- $21,615
Cash invested: $70,000 (down + closing). Projections, not guarantees.
Landlord ↔ Tenant lean methodology
- Overall (STATE)
- 46 Balanced
- State Minnesota
- 46 Balanced · D+2
- County
- — inherits STATE
- City
- — inherits STATE
ZIP-level market 55106
- Rents YoY
- 6.3%
- Active inventory
- 254
- Price-to-rent
- 13.5×
Monthly cashflow live
- Estimated rent
- $3,081 medium interval (Pro) →
- Mortgage (P&I)
- −$1,311
- Tax from tax record
- −$337 /mo · $4,048/yr
- Insurance
- −$104
- HOA
- −$0
- Vacancy / Maint / Mgmt
- −$647
- Net cashflow
- $681
Break-even live
Sensitivity live
| Price | -10% $823 | -5% $752 | +0% $681 | +5% $611 | +10% $540 |
|---|---|---|---|---|---|
| Rent | -10% $438 | -5% $560 | +0% $681 | +5% $803 | +10% $925 |
| Rate | -1.0pp $807 | -0.5pp $745 | base $681 | +0.5pp $617 | +1.0pp $551 |
2-unit breakdown (identical units grouped — click to expand)
| Units | Beds | Baths | Est. rent |
|---|---|---|---|
| 2× units | 2 | 1 | $3,082 |
| #1 | 2 | 1 | $1,541 |
| #2 | 2 | 1 | $1,541 |
| Total (2 units) | $3,081 | ||
UW: 25.0% down · 7.5% · 30yr · 1.5% tax · 5.0% vac · 8.0% maint · 8.0% mgmt
Financing live
Cash to close
- Down payment
- $62,500
- Closing costs
- $7,500
- Reserves months
- —
- Total cash needed
- —
Loan-product check · same deal, 3 products live
Conventional
25% down · 7.5% · 30yr
- Down + closing
- —
- Monthly P&I
- —
- Monthly cashflow
- —
- DSCR
- —
- Eligible?
- —
Personal DTI + credit; lowest rate.
DSCR
20% down · 8.5% · 30yr
- Down + closing
- —
- Monthly P&I
- —
- Monthly cashflow
- —
- DSCR
- —
- Eligible?
- —
No personal income docs; deal must DSCR.
Hard money
10% down · 12.0% · 12mo
- Down + closing
- —
- Monthly P&I
- —
- Monthly cashflow
- —
- DSCR
- —
- Eligible?
- —
Short-term bridge; refi at stabilization.
Listing history 8 events
-
2026-06-21days on market $250,000 Active 13 DOM
-
2026-06-18days on market $250,000 Active 10 DOM
-
2026-06-17days on market $250,000 Active 9 DOM
-
2026-06-16days on market $250,000 Active 8 DOM
-
2026-06-15days on market $250,000 Active 7 DOM
-
2026-06-13days on market $250,000 Active 5 DOM
-
2026-06-08remarks 428-char remark
-
2026-06-08$250,000 Active 1 DOM
ⓘ Source: listings_history table (triggers on properties + properties_extension) + one-shot
backfill from property_details.listing_events for pre-trigger history.
Tax reassessment forecast MN · Partial reset (capped growth)
- Current annual tax
- $4,048 · $337/mo
- Projected year-2 tax
- $4,048 · $337/mo
- Expected delta
- $0/yr ($0/mo · 0.0%)
ⓘ Screening estimate from a state-policy table — verify with the county assessor before closing.
Climate risk First Street
- Flood 1/10 Low FEMA zone X (unshaded) · 0% chance over 30 yrs
- Wildfire 1/10 Low
- Heat 2/10 Low 7 d/yr ≥99°F today · 14 d/yr by 30 yrs out
- Wind 2/10 Low
- Air quality 2/10 Low 1 unhealthy d/yr today · 1 by 30 yrs out
Nearby sold comps map
Loading sold comps map…
Walkable amenities ~0.75 mi
Loading nearby amenities…
Taxation est. · year 1
- Rental income
- $36,972
- − Mortgage interest
- −$14,004
- − Property taxes
- −$4,048
- − Insurance
- −$1,250
- − Repairs & maintenance
- −$2,958
- − Management
- −$2,958
- − Depreciation
- −$7,273
- Taxable income
- $4,482
- Est. tax owed @ 24.0%
- −$1,076
- After-tax cash flow
- $7,102/yr
For passive investors: Depreciation is non-cash, so a rental often shows a tax loss while cash-flowing — sheltering income. Rental losses are passive: they offset passive income freely, and up to $25,000/yr can offset ordinary (W-2) income if you actively participate and your MAGI is under $100k (phasing out to $0 by $150k); unused losses carry forward. On sale, claimed depreciation is recaptured at up to 25%, and gains may owe capital-gains tax (a 1031 exchange can defer both). Figures are a year-1 estimate at your 24.0% rate — not tax advice; consult a CPA.
Schools (NCES district)
- District
- St. Paul Public School District
- NCES district ID
- 2733840
- Math proficiency
- 21% ▼ -11.00%
- Reading proficiency
- 33% ▼ -7.00%
- Median HH income
- $48,316
- Composite
- 23.51/100
- National rank
- #7868
- State rank
- #270 of 301 in MN
Livability — St. Paul
No livability data for this city. (Only ~50 U.S. cities are tracked.)
Census & demographics
- Census place
- St. Paul, MN
- County
- Ramsey County · 542,837 people
- City population
- 280,599
- Metro
- Minneapolis-St. Paul-Bloomington, MN-WI
- Population (ZIP)
- 56,708
- Household income
- $70,187
- Rent vs Own
- Severe rent burden
- 2046.0
Population outlook (Ramsey County) Hauer SSP2
- Today (2025)
- 603,431 people
- By 2030
- 636,459 · +5.5%
- By 2040
- 700,596 · +16.1%
- By 2050
- 765,819 · +26.9%
- By 2075
- 929,297 · +54.0%
- By 2100
- 1,053,924 · +74.7%
Race, ethnicity, and origin ACS 2023
- Neighborhood character
- Highly diverse neighborhood (Simpson 0.75)
- Race & ethnicity
- Asian 34% White 32% Black 15% Hispanic / Latino 11% Two or more races 10%
- Hispanic origin (detail)
- Mexican 8%
- Common ancestry
- Portuguese 4% Lithuanian 2% Romanian 2%
- Foreign-born
- 25% · Canada, Philippines, Vietnam
- Languages at home
- 59% English-only · Other Asian/Pacific 27% Spanish 9% French/Haitian/Cajun 1%
Political lean MEDSL · Ramsey
- 2024 margin
- Solid D (+43.3) · D 70.5% · R 27.2% · Other 2.3%
- 2008→2024 swing
- +9.4pp toward D · 2008: 33.9pp · 2024: 43.3pp
- All cycles
- 2024: D+43.3 2020: D+45.4 2016: D+39.4 2012: D+35.3 2008: D+33.9
Not yet ingested
- Civics
- —
Market trends
- HPI YoY
- ▼ -239.48%
- Current HPI
- 288.7205
- Rent YoY
- ▲ 6.26%
- Metro
- Minneapolis-St. Paul-Bloomington, MN-WI
- State GDP YoY
- ▲ 2.41%
- F500 in state
- 34
Industry mix (Fortune 500 HQ in MN)
| Industry | F500 HQs | Revenue |
|---|---|---|
| Healthcare | 2 | $407B |
|
||
| Retail | 2 | $150B |
|
||
| Consumer Goods | 2 | $32B |
|
||
| Industrial Machinery | 2 | $6B |
|
||
| Agriculture | 1 | $40B |
|
||
| Healthcare / Medical Devices | 1 | $32B |
|
||
Price history
+35.2% since first listed39 events — show timeline
- 2026-06-08 Listed $250,000 NORTHSTARMLS as Distributed by MLS Grid
- 2025-10-21 Sold (Public Records) $240,000 Public Records
- 2025-09-26 Pending — NORTHSTARMLS as Distributed by MLS Grid
- 2025-09-26 Sold (MLS) $240,000 NORTHSTARMLS as Distributed by MLS Grid
- 2025-08-29 Contingent — NORTHSTARMLS as Distributed by MLS Grid
- 2025-08-25 Relisted — NORTHSTARMLS as Distributed by MLS Grid
- 2025-08-22 Contingent — NORTHSTARMLS as Distributed by MLS Grid
- 2025-08-19 Listed $235,000 NORTHSTARMLS as Distributed by MLS Grid
- 2025-08-19 Relisted — NORTHSTARMLS as Distributed by MLS Grid
- 2025-08-18 Listing Removed — NORTHSTARMLS as Distributed by MLS Grid
- 2025-07-14 Pending — NORTHSTARMLS as Distributed by MLS Grid
- 2025-07-07 Contingent — NORTHSTARMLS as Distributed by MLS Grid
- 2025-07-07 Pending — NORTHSTARMLS as Distributed by MLS Grid
- 2025-05-27 Relisted — NORTHSTARMLS as Distributed by MLS Grid
- 2025-05-27 Price Changed $235,000 NORTHSTARMLS as Distributed by MLS Grid
- 2025-05-15 Relisted — NORTHSTARMLS as Distributed by MLS Grid
- 2025-05-03 Pending — NORTHSTARMLS as Distributed by MLS Grid
- 2025-04-22 Contingent — NORTHSTARMLS as Distributed by MLS Grid
- 2025-04-14 Relisted — NORTHSTARMLS as Distributed by MLS Grid
- 2025-04-08 Contingent — NORTHSTARMLS as Distributed by MLS Grid
- 2025-03-09 Price Changed $247,900 NORTHSTARMLS as Distributed by MLS Grid
- 2025-02-09 Listed $255,000 NORTHSTARMLS as Distributed by MLS Grid
- 2019-01-03 Sold (Public Records) $160,000 Public Records
- 2007-02-05 Sold (Public Records) $145,000 Public Records
- 2007-01-31 Sold (MLS) $145,000 NORTHSTARMLS as Distributed by MLS Grid
- 2007-01-10 Listing Removed — NORTHSTARMLS as Distributed by MLS Grid
- 2006-11-09 Listing Removed — NORTHSTARMLS as Distributed by MLS Grid
- 2006-11-09 Listed $149,900 NORTHSTARMLS as Distributed by MLS Grid
- 2006-03-02 Listed $159,900 NORTHSTARMLS as Distributed by MLS Grid
- 2005-09-26 Listing Removed — NORTHSTARMLS as Distributed by MLS Grid
- 2005-03-25 Listed $209,900 NORTHSTARMLS as Distributed by MLS Grid
- 2004-10-28 Sold (MLS) $174,900 NORTHSTARMLS as Distributed by MLS Grid
- 2004-10-26 Sold (Public Records) $174,900 Public Records
- 2004-09-20 Listing Removed — NORTHSTARMLS as Distributed by MLS Grid
- 2004-08-10 Listed $179,900 NORTHSTARMLS as Distributed by MLS Grid
- 2004-07-30 Listing Removed — NORTHSTARMLS as Distributed by MLS Grid
- 2004-04-30 Listing Removed — NORTHSTARMLS as Distributed by MLS Grid
- 2004-04-30 Listed $179,900 NORTHSTARMLS as Distributed by MLS Grid
- 2004-01-30 Listed $184,900 NORTHSTARMLS as Distributed by MLS Grid
Property tax history
+7.3%/yrLatest (2025): $4,048 · +18.6% YoY. Source: county tax records.
Cash-flow waterfall
monthlySold comps — $/sqft
last 12 mo · ≤1 miLoading sold comps…