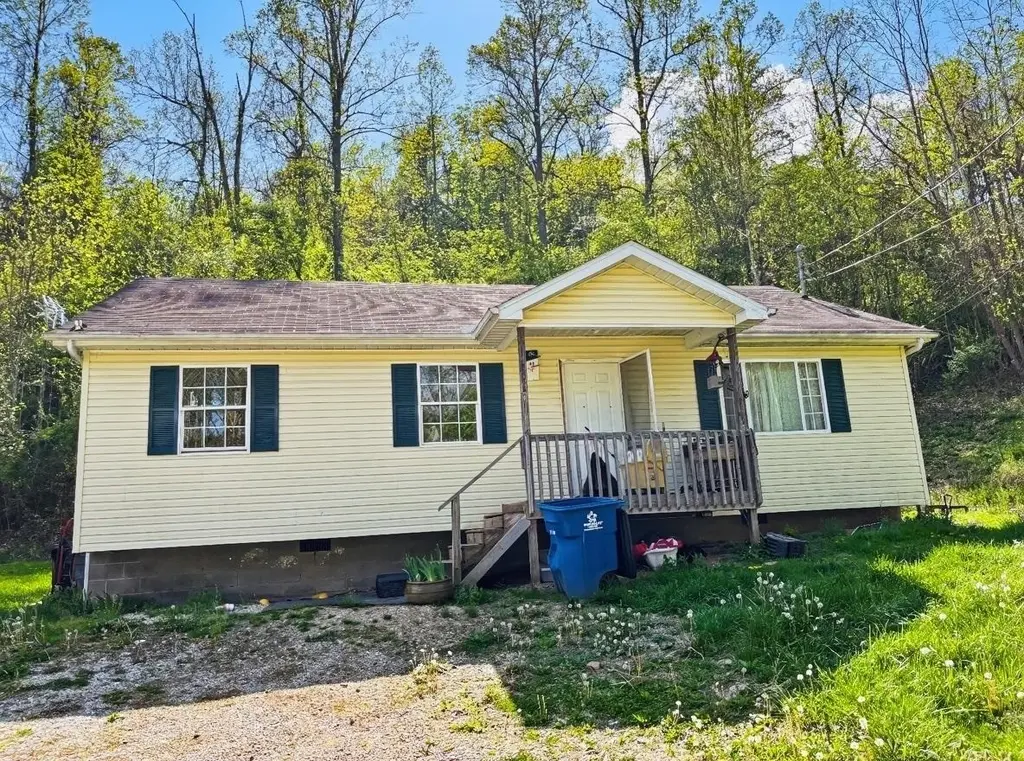
157 Township Rd 1207
Lesage, WV 45669
$120,000C
3 bd · 2.0 ba ·
1,040 sqft ·
Built 2002
· SingleFamily
· Active
· 63 DOM
Cashflow @ list (25.0% down · 7.5%)
Estimated rent
$1,032/mo
Mortgage (P&I)
−$629
Tax + insurance
−$207
HOA
−$0
Vac / Maint / Mgmt
−$217
Net cashflow
$-21/mo
Annual
$-247/yr
Cap rate
6.75%
Cash-on-cash
1.64%
DSCR
1.07
1% rule
0.86%
Cash to close
$33,600
Investor read
- This is a 3-bed/2.0-bath single-family listed at $120k.
- At list price, monthly cash flow is $-21 ($-247/yr) — negative.
- To cash-flow at today's rent, offer at most $116k (3.0% below list).
- To meet the 1% rule (rent ≥ 1% of price), the offer needs to be $103k (14.0% below list).
- It's been on market 63 days — a 6% lower offer ($113k) is reasonable based on typical stale-listing flexibility.
- Recommended offer: $103k (14.0% below list) — sets the bar for 1% rule.
- Local home prices are declining (-1.8%/yr); year-one equity from $830 of loan paydown is wiped out by about $2k of value loss. Plan a longer hold.
- Location reads 62/100 on livability (#184 in WV) — a middle-class / working-renter tenant base. Strengths: cost of living A+, housing A+, crime B+; Watch: employment D+, amenities F, commute F.
- Fairland Local (suburban): math 63% / reading 73% proficiency, ranked #177 of 656 in OH (top 27%) — acceptable for families but not a draw, mixed tenant base, ~2y average lease.
- Zoned schools: Fairland East Elementary School (346 students, 43% FRL); Fairland Middle School (math 61% / reading 74%, grade A-, #161 of 654 statewide, top 25%, 342 students, 37% FRL); Fairland High School (math 32% / reading 67%, grade D, #390 of 781 statewide, top 54%, 391 students, 49% FRL) — zoned schools at 43% FRL track the district average.
- Watch-outs: flood insurance adds $66/mo.
- Market conditions: 18 units permitted in Lawrence County in 2024 (0 in 5+ unit buildings).
- Lawrence County population projected at -22% by 2050 — secular population decline; favor cash flow + early exit over multi-decade hold.
- Climate carrying-cost: severe flood risk; major wildfire risk — expect insurance premiums to compound above CPI over the hold.
- Cap rate 6.8% vs local median 2.5% in Lesage — top-decile yield for the area; either an underpriced asset or a hidden risk that comps aren't pricing in. Stress-test before assuming the spread holds.
Questions for listing agent
- What do current leases actually rent for vs. the listed asking? Can we see a recent rent roll and the last 12 months of T-12 income?
- It's been on market 63 days. Have you received any prior offers? Is the seller open to a 14% concession, seller financing, or rate buy-down credit?
- What's the actual annual flood-insurance premium (NFIP or private), and is the property in a SFHA with mandatory coverage?
- Why hasn't it sold? Are there any deal-killer items the seller is aware of (foundation, flood, title, zoning, code violations)?
- Is there a deadline driving the sale (1031 exchange, divorce, estate, relocation)? That informs how much negotiation room exists.
- Schools are F-rated, which usually means shorter tenancies and higher turnover. Who's the typical renter profile here, and what's been the actual vacancy rate?
- What's the average days-on-market for RENTAL listings here right now (not sales)? A rising rental-DOM trend means longer vacancies and softer asking-rent achievability than the comps imply.
- What's the recent tenant-quality profile in this submarket — average credit score on applications, eviction rate, late-payment / NSF rate, and stable-employment percentage? A property-management company in the area should have these aggregated.
CashFlowRE · CFR-ZRK5A502JER4W8
· Data 4 days ago
cashflowre.app · 2026-05-29