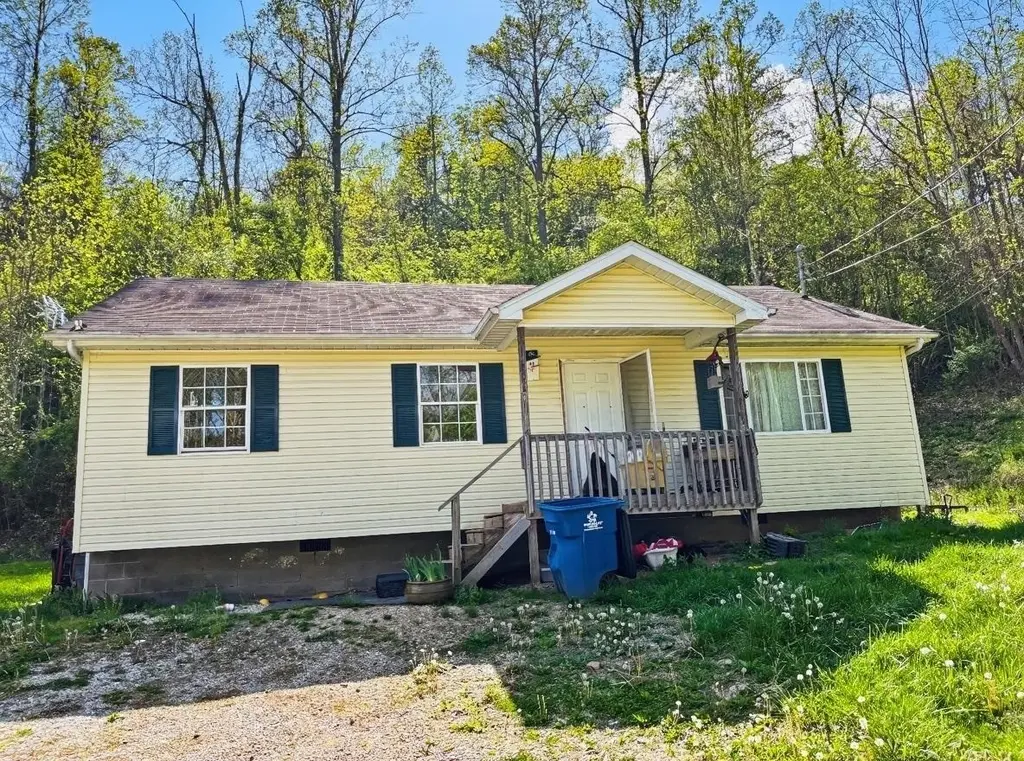
157 Township Rd 1207 · Lesage, WV
Flood risk 10/10 · Severe
- FEMA flood zone
- X (unshaded)
- Chance of flooding over 30 yrs
- 0.99%
- Est. flood insurance / yr
- $507 – $1,088
Fire risk 6/10 · Moderate
- Est. fire insurance / yr
- $713 – $1,323
Heat risk 4/10 · Minor
- Hot days now (above 103°F)
- 7 days/yr
- Hot days in 30 yrs
- 18 days/yr
Wind risk 2/10 · Minimal
- Chance of severe wind over 30 yrs
- 1.0%
Air-quality risk 1/10 · Minimal
- Unhealthy air days now
- 0 days/yr
- Unhealthy air days in 30 yrs
- 0 days/yr
Risk factors via First Street. Map © Google.
Why this score? — see what drove the C grade
The composite is a weighted blend of 9 inputs, each scored 0–100. Each bar is that input's sub-score; the figure is the points it added to the 100-point composite (weight × sub-score).
- Cash flow +15.4/30.0
- ARV discount +15.0/15.0
- Schools +5.7/10.0
- DSCR +4.7/10.0
- Appreciation +4.1/10.0
- 1% rule +3.6/10.0
- Livability +3.1/5.0
- Rent growth +2.5/5.0
- Condition / age +2.5/5.0
$120,000
🖨 Deal sheet (PDF) 📄 Offer letter ✓ Due diligence
Listing remarks MLS
Here is a one-story home offering 3 bedrooms and 2 full bathrooms, ready for your personal touch! The inviting living room flows seamlessly into a spacious kitchen, creating a functional layout perfect for everyday living and entertaining. The primary bedroom features its own private bathroom for added comfort and convenience. Exit outside to a flat backyard with great potential—ideal for adding a deck or patio to create your perfect outdoor space. With a little vision, this home could truly shine.
Key facts
- Flat backyard
- Spacious kitchen
- Inviting living room
Tags
Neighborhood map
What this means for you Summary
Snapshot
- This is a 3-bed/2.0-bath single-family listed at $120k.
Deal economics
- At list price, monthly cash flow is $-21 ($-247/yr) — negative.
- To cash-flow at today's rent, offer at most $116k (3.0% below list).
- To meet the 1% rule (rent ≥ 1% of price), the offer needs to be $103k (14.0% below list).
- Recommended offer: $103k (14.0% below list) — sets the bar for 1% rule.
- Cap rate 6.8% vs local median 2.5% in Lesage — top-decile yield for the area; either an underpriced asset or a hidden risk that comps aren't pricing in. Stress-test before assuming the spread holds.
Location & tenants
- Location reads 62/100 on livability (#184 in WV) — a middle-class / working-renter tenant base. Strengths: cost of living A+, housing A+, crime B+; Watch: employment D+, amenities F, commute F.
- Fairland Local (suburban): math 63% / reading 73% proficiency, ranked #177 of 656 in OH (top 27%) — acceptable for families but not a draw, mixed tenant base, ~2y average lease.
- Zoned schools: Fairland East Elementary School (346 students, 43% FRL); Fairland Middle School (math 61% / reading 74%, grade A-, #161 of 654 statewide, top 25%, 342 students, 37% FRL); Fairland High School (math 32% / reading 67%, grade D, #390 of 781 statewide, top 54%, 391 students, 49% FRL) — zoned schools at 43% FRL track the district average.
- Market conditions: 18 units permitted in Lawrence County in 2024 (0 in 5+ unit buildings).
Forward outlook
- Local home prices are declining (-1.8%/yr); year-one equity from $830 of loan paydown is wiped out by about $2k of value loss. Plan a longer hold.
- Lawrence County population projected at -22% by 2050 — secular population decline; favor cash flow + early exit over multi-decade hold.
Negotiation context
- It's been on market 63 days — a 6% lower offer ($113k) is reasonable based on typical stale-listing flexibility.
Risks & watch-outs
- Watch-outs: flood insurance adds $66/mo.
- Climate carrying-cost: severe flood risk; major wildfire risk — expect insurance premiums to compound above CPI over the hold.
Questions for the listing agent
- What do current leases actually rent for vs. the listed asking? Can we see a recent rent roll and the last 12 months of T-12 income?
- It's been on market 63 days. Have you received any prior offers? Is the seller open to a 14% concession, seller financing, or rate buy-down credit?
- What's the actual annual flood-insurance premium (NFIP or private), and is the property in a SFHA with mandatory coverage?
- Why hasn't it sold? Are there any deal-killer items the seller is aware of (foundation, flood, title, zoning, code violations)?
- Is there a deadline driving the sale (1031 exchange, divorce, estate, relocation)? That informs how much negotiation room exists.
- Schools are F-rated, which usually means shorter tenancies and higher turnover. Who's the typical renter profile here, and what's been the actual vacancy rate?
- What's the average days-on-market for RENTAL listings here right now (not sales)? A rising rental-DOM trend means longer vacancies and softer asking-rent achievability than the comps imply.
- What's the recent tenant-quality profile in this submarket — average credit score on applications, eviction rate, late-payment / NSF rate, and stable-employment percentage? A property-management company in the area should have these aggregated.
- How much new for-sale + rental construction is in the pipeline within 1–3 miles? Heavy new supply typically softens prices + rents 12–24 months out; constrained supply supports both.
Investment metrics
- 1% rule
- 0.86% ✗
- Cap rate
- 6.75%
- Cash-on-cash
- 1.64%
- DSCR
- 1.07
- GRM
- 9.7
CMA / ARV
- ARV (median comp)
- $165,543
- List price
- $120,000
- Delta
- -27.51%
- Verdict
- UNDERPRICED
- Comps
- 4 within 1.0 mi
Show comp detail 1 sale within ~0.75 mi
| Address | Dist | Beds/Ba | Sqft | Sold | Price | $/sf | Match |
|---|---|---|---|---|---|---|---|
| 1480 County Road 70 | 0.23mi | 2/1.0 (-1) | 912 (-12%) | 9mo | $75,000 | $82 | 53 |
Match score weights: distance 35% · size 25% · config 20% · recency 20%. Top-matched comps best support the ARV.
Projected returns pro-forma
-1.76% appreciation · 3.0% rent growth · sell at horizon
- IRR
- -10.6%
- Equity multiple
- 0.57×
- Total profit
- $-14,385
- Equity at exit
- $24,650
- IRR
- -3.0%
- Equity multiple
- 0.75×
- Total profit
- $-8,399
- Equity at exit
- $22,361
Cash invested: $33,600 (down + closing). Projections, not guarantees.
Landlord ↔ Tenant lean methodology
- Overall (STATE)
- 83 Strongly Landlord-Friendly
- State West Virginia
- 83 Strongly Landlord-Friendly · R+22
- County
- — inherits STATE
- City
- — inherits STATE
ZIP-level market 45669
- Home prices YoY
- -0.8%
- Price-to-rent
- 9.7×
Monthly cashflow live
- Estimated rent
- $1,032 medium interval (Pro) →
- Mortgage (P&I)
- −$629
- Tax from tax record
- −$90 /mo · $1,086/yr
- Insurance
- −$50
- Flood insurance flood zone
- −$66 /mo · $798/yr
- HOA
- −$0
- Vacancy / Maint / Mgmt
- −$217
- Net cashflow
- $-21
Break-even live
Sensitivity live
| Price | -10% $47 | -5% $13 | +0% $-21 | +5% $-55 | +10% $-89 |
|---|---|---|---|---|---|
| Rent | -10% $-102 | -5% $-61 | +0% $-21 | +5% $20 | +10% $61 |
| Rate | -1.0pp $40 | -0.5pp $10 | base $-21 | +0.5pp $-52 | +1.0pp $-83 |
UW: 25.0% down · 7.5% · 30yr · 1.5% tax · 5.0% vac · 8.0% maint · 8.0% mgmt
Financing live
Cash to close
- Down payment
- $30,000
- Closing costs
- $3,600
- Reserves months
- —
- Total cash needed
- —
Loan-product check · same deal, 3 products live
Conventional
25% down · 7.5% · 30yr
- Down + closing
- —
- Monthly P&I
- —
- Monthly cashflow
- —
- DSCR
- —
- Eligible?
- —
Personal DTI + credit; lowest rate.
DSCR
20% down · 8.5% · 30yr
- Down + closing
- —
- Monthly P&I
- —
- Monthly cashflow
- —
- DSCR
- —
- Eligible?
- —
No personal income docs; deal must DSCR.
Hard money
10% down · 12.0% · 12mo
- Down + closing
- —
- Monthly P&I
- —
- Monthly cashflow
- —
- DSCR
- —
- Eligible?
- —
Short-term bridge; refi at stabilization.
Listing history 17 events
-
2026-06-18days on market $120,000 Active 63 DOM
-
2026-06-17days on market $120,000 Active 62 DOM
-
2026-06-16days on market $120,000 Active 61 DOM
-
2026-06-15days on market $120,000 Active 60 DOM
-
2026-06-13days on market $120,000 Active 58 DOM
-
2026-06-12days on market $120,000 Active 57 DOM
-
2026-06-09days on market $120,000 Active 54 DOM
-
2026-06-08days on market $120,000 Active 53 DOM
-
2026-06-08days on market $120,000 Active 52 DOM
-
2026-06-07days on market $120,000 Active 51 DOM
-
2026-06-04days on market $120,000 Active 48 DOM
-
2026-06-02days on market $120,000 Active 47 DOM
-
2026-06-01days on market $120,000 Active 46 DOM
-
2026-05-31days on market $120,000 Active 45 DOM
-
2026-04-16$120,000 Active 509-char remark
Show marketing remark (509 chars)
Here is a one-story home offering 3 bedrooms and 2 full bathrooms, ready for your personal touch! The inviting living room flows seamlessly into a spacious kitchen, creating a functional layout perfect for everyday living and entertaining. The primary bedroom features its own private bathroom for added comfort and convenience. Exit outside to a flat backyard with great potential—ideal for adding a deck or patio to create your perfect outdoor space. With a little vision, this home could truly shine.
-
2023-09-22soldstatus $130,000
-
1999-12-17soldstatus $12,500
ⓘ Source: listings_history table (triggers on properties + properties_extension) + one-shot
backfill from property_details.listing_events for pre-trigger history.
Tax reassessment forecast WV · Resets to sale price
- Current annual tax
- $1,086 · $90/mo
- Projected year-2 tax
- $1,086 · $90/mo
- Expected delta
- $0/yr ($0/mo · 0.0%)
ⓘ Screening estimate from a state-policy table — verify with the county assessor before closing.
Climate risk First Street
- Flood 10/10 Extreme FEMA zone X (unshaded) · 99% chance over 30 yrs
- Wildfire 6/10 Major
- Heat 4/10 Moderate 7 d/yr ≥103°F today · 18 d/yr by 30 yrs out
- Wind 2/10 Low 100% chance of damaging wind over 30 yrs
- Air quality 1/10 Low 0 unhealthy d/yr today · 0 by 30 yrs out
Nearby sold comps map
Loading sold comps map…
Walkable amenities ~0.75 mi
Loading nearby amenities…
Taxation est. · year 1
- Rental income
- $12,390
- − Mortgage interest
- −$6,722
- − Property taxes
- −$1,086
- − Insurance
- −$1,398
- − Repairs & maintenance
- −$991
- − Management
- −$991
- − Depreciation
- −$3,491
- Taxable loss
- −$2,289
- Est. tax savings @ 24.0%
- +$549
- After-tax cash flow
- $302/yr
For passive investors: Depreciation is non-cash, so a rental often shows a tax loss while cash-flowing — sheltering income. Rental losses are passive: they offset passive income freely, and up to $25,000/yr can offset ordinary (W-2) income if you actively participate and your MAGI is under $100k (phasing out to $0 by $150k); unused losses carry forward. On sale, claimed depreciation is recaptured at up to 25%, and gains may owe capital-gains tax (a 1031 exchange can defer both). Figures are a year-1 estimate at your 24.0% rate — not tax advice; consult a CPA.
Schools (NCES district)
- District
- Fairland Local
- NCES district ID
- 3904793
- Math proficiency
- 63% ▼ -8.00%
- Reading proficiency
- 73% ▼ -5.00%
- Median HH income
- $47,234
- Composite
- 57.41/100
- National rank
- #1077
- State rank
- #177 of 656 in OH
Livability — Lesage
- Score
- 62/100
- State rank
- #184
- US rank
- #16949
Category grades
Schools grade is shown separately in the Schools card above.
Census & demographics
- County
- Lawrence
- Metro
- Huntington-Ashland, WV-KY-OH
- Population (ZIP)
- 10,085
- Household income
- $65,824
- Rent vs Own
- Severe rent burden
- 9.1
Population outlook (Lawrence County) Hauer SSP2
- Today (2025)
- 57,915 people
- By 2030
- 55,650 · -3.9%
- By 2040
- 50,523 · -12.8%
- By 2050
- 45,103 · -22.1%
- By 2075
- 32,441 · -44.0%
- By 2100
- 21,754 · -62.4%
Race, ethnicity, and origin ACS 2023
- Neighborhood character
- Predominantly White (92%)
- Race & ethnicity
- White 92% Asian 3% Two or more races 2% Black 1%
- Common ancestry
- Italian 2% Russian 2% Lithuanian 2%
- Foreign-born
- 1% · South Korea, China
- Languages at home
- 98% English-only · Korean 1% Spanish 1%
Political lean MEDSL · Lawrence
- 2024 margin
- Solid R (+50.5) · D 24.4% · R 74.9%
- 2008→2024 swing
- -35.2pp toward R · 2008: -15.3pp · 2024: -50.5pp
- All cycles
- 2024: R+50.5 2020: R+45.6 2016: R+43.9 2012: R+15.5 2008: R+15.3
Not yet ingested
- Civics
- —
Market trends
- HPI YoY
- ▼ -1.76%
- Current HPI
- 212.88
- Rent YoY
- —
- Metro
- —
- State GDP YoY
- —
- F500 in state
- 0
Price history
+860.0% since first listed3 events — show timeline
- 2026-04-16 Listed $120,000 HBRMLS
- 2023-09-22 Sold (Public Records) $130,000 Public Records
- 1999-12-17 Sold (Public Records) $12,500 Public Records
Property tax history
+3.4%/yrLatest (2024): $1,086 · +0.0% YoY. Source: county tax records.
Cash-flow waterfall
monthlySold comps — $/sqft
last 12 mo · ≤1 miLoading sold comps…