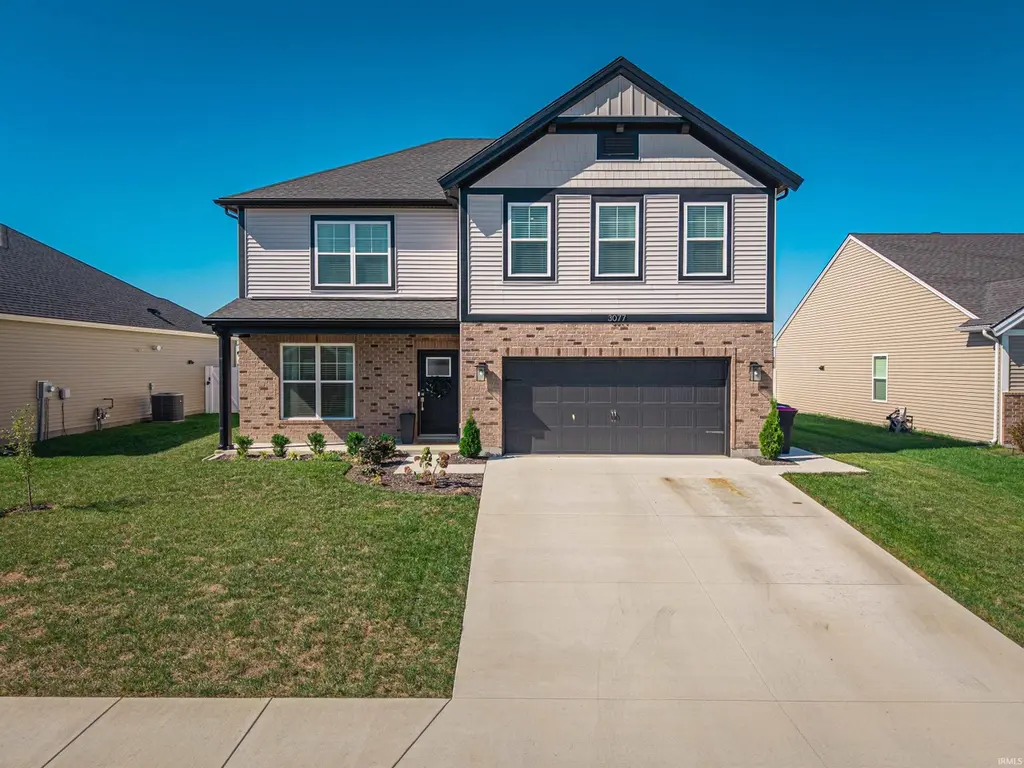
3077 Dowgate Dr
Newburgh, IN 47630
$399,900D-
4 bd · 2.5 ba ·
2,544 sqft ·
Built 2023
· SingleFamily
· Active
· 183 DOM
Cashflow @ list (25.0% down · 7.5%)
Estimated rent
$2,616/mo
Mortgage (P&I)
−$2,097
Tax + insurance
−$392
HOA
−$0
Vac / Maint / Mgmt
−$549
Net cashflow
$-422/mo
Annual
$-5,068/yr
Cap rate
5.03%
Cash-on-cash
-4.53%
DSCR
0.80
1% rule
0.65%
Cash to close
$111,972
Investor read
- This is a 4-bed/2.5-bath single-family listed at $400k.
- At list price, monthly cash flow is $-422 ($-5k/yr) — negative.
- To cash-flow at today's rent, offer at most $325k (18.7% below list).
- To meet the 1% rule (rent ≥ 1% of price), the offer needs to be $262k (34.6% below list).
- It's been on market 183 days — a 12% lower offer ($352k) is reasonable based on typical stale-listing flexibility.
- Recommended offer: $262k (34.6% below list) — sets the bar for 1% rule.
- Local home prices are declining (-3.0%/yr); year-one equity from $3k of loan paydown is wiped out by about $12k of value loss. Plan a longer hold.
- Location reads 80/100 on livability (#21 in IN, #1,922 nationally) — a professional / high-income tenant draw. Strengths: crime A+, cost of living A+, housing A+; Watch: amenities F, commute F.
- Warrick County School Corporation (suburban): math 54% / reading 59% proficiency, ranked #24 of 301 in IN (top 8%) — acceptable for families but not a draw, mixed tenant base, ~2y average lease.
- Market conditions: Rents rising fast (+8.7%/yr); 383 active listings in the ZIP; 3 comparable units currently listed for rent nearby; rentals lingering (median 44d on market — plan ~5-8 weeks vacancy on turnover, expect pricing pressure); 67% of comp listings sitting > 30 days — soft ceiling on asking rent; solid renter incomes; 249 units permitted in Warrick County in 2024 (0 in 5+ unit buildings).
- Warrick County population projected at +9% by 2050 — modest demand growth; plan on rents tracking national, not racing it.
- 2 sale attempts since 3y ago with the ask held roughly flat each time — persistent listings suggest the price (not the market) is what's stuck; bring a comps-based counter.
- Cap rate 5.0% vs local median 3.9% in Newburgh — meaningfully above typical; check what's discounted (condition, days-on-market, listing class) to confirm the premium yield is real.
- This rent runs 33% of the median local income ($94k/yr) — at the standard rent-burdened threshold; future hikes will face affordability resistance.
Questions for listing agent
- What do current leases actually rent for vs. the listed asking? Can we see a recent rent roll and the last 12 months of T-12 income?
- It's been on market 183 days. Have you received any prior offers? Is the seller open to a 35% concession, seller financing, or rate buy-down credit?
- Why hasn't it sold? Are there any deal-killer items the seller is aware of (foundation, flood, title, zoning, code violations)?
- Is there a deadline driving the sale (1031 exchange, divorce, estate, relocation)? That informs how much negotiation room exists.
- Schools are A-rated — typically a magnet for longer-tenancy family renters. What's the average tenant stay here, and is there a school-zone premium baked into asking?
- The area grade is low — what's the realistic commute time and amenity access for the typical tenant pool here? Any planned neighborhood developments (good or bad) we should know about?
- What's the average days-on-market for RENTAL listings here right now (not sales)? A rising rental-DOM trend means longer vacancies and softer asking-rent achievability than the comps imply.
- What's the recent tenant-quality profile in this submarket — average credit score on applications, eviction rate, late-payment / NSF rate, and stable-employment percentage? A property-management company in the area should have these aggregated.
CashFlowRE · CFR-ZRT2ZR1EBMTSP0
· Data 2 days ago
cashflowre.app · 2026-05-29