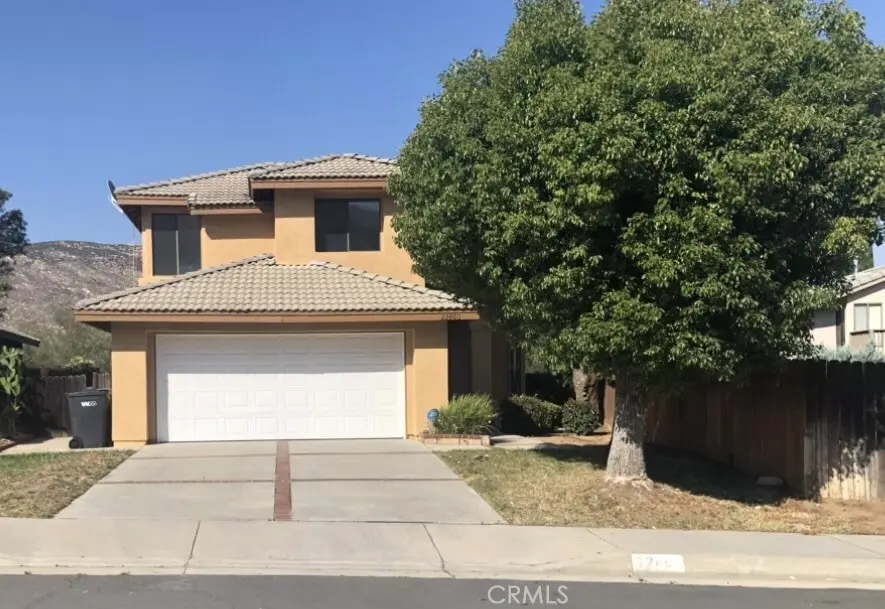
22860 Mountain Vw
Moreno Valley, CA 92557
$524,900D
4 bd · 2.5 ba ·
1,809 sqft ·
Built 1988
· SingleFamily
· Active
· 14 DOM
Cashflow @ list (25.0% down · 7.5%)
Estimated rent
$4,251/mo
Mortgage (P&I)
−$2,753
Tax + insurance
−$506
HOA
−$0
Vac / Maint / Mgmt
−$893
Net cashflow
$100/mo
Annual
$1,198/yr
Cap rate
6.52%
Cash-on-cash
0.82%
DSCR
1.04
1% rule
0.81%
Cash to close
$146,972
Investor read
- This is a 4-bed/2.5-bath single-family listed at $525k.
- At list price, monthly cash flow is $100 ($1k/yr) — positive.
- The deal already cash-flows at list — no discount required.
- To meet the 1% rule (rent ≥ 1% of price), the offer needs to be $425k (19.0% below list).
- Only 14 days on market — expect competitive offers; lowballing is unlikely to land.
- Recommended offer: $425k (19.0% below list) — sets the bar for 1% rule.
- Local home prices are declining (-3.0%/yr); year-one equity from $4k of loan paydown is wiped out by about $16k of value loss. Plan a longer hold.
- Location reads 55/100 on livability (#838 in CA) — a working-class tenant base; expect higher turnover. Strengths: housing A+, employment B; Watch: schools D-, amenities F, commute F.
- Moreno Valley Unified (suburban): math 23% / reading 34% proficiency, ranked #1,050 of 1,400 in CA (top 75%) — low school quality limits family demand, transient renter base, plan for 1-2y turnover; 69% free/reduced lunch — lower-income household profile, screen leases tightly.
- Market conditions: Rents rising (+2.0%/yr); 89 active listings in the ZIP; 8 comparable units currently listed for rent nearby; rentals leasing fast (median 5d on market — plan ~1-2 weeks tenant-placement turnaround); solid renter incomes; 9,195 units permitted in Riverside County in 2024 (1,512 in 5+ unit buildings).
- Riverside County population projected at +22% by 2050 — long-run rental-demand tailwind backs the buy-and-hold thesis.
- Current owner paid $126k; list at $525k implies a 315% gain — meaningful room to come down on a strong offer.
- Climate carrying-cost: severe wildfire risk; extreme-heat days projected 7→23/yr by 2055 (HVAC capex compounding) — expect insurance premiums to compound above CPI over the hold.
- Cap rate 6.5% vs local median 3.9% in Moreno Valley — top-decile yield for the area; either an underpriced asset or a hidden risk that comps aren't pricing in. Stress-test before assuming the spread holds.
- At $4,251/mo this rent would consume 54% of the median local household income ($95k/yr) (locally 1627% of renters already pay >50% of income on rent) — very limited rent-growth headroom before tenants either downsize or default.
Questions for listing agent
- Is there a deadline driving the sale (1031 exchange, divorce, estate, relocation)? That informs how much negotiation room exists.
- Schools are D-rated, which usually means shorter tenancies and higher turnover. Who's the typical renter profile here, and what's been the actual vacancy rate?
- The area grade is low — what's the realistic commute time and amenity access for the typical tenant pool here? Any planned neighborhood developments (good or bad) we should know about?
- What's the average days-on-market for RENTAL listings here right now (not sales)? A rising rental-DOM trend means longer vacancies and softer asking-rent achievability than the comps imply.
- What's the recent tenant-quality profile in this submarket — average credit score on applications, eviction rate, late-payment / NSF rate, and stable-employment percentage? A property-management company in the area should have these aggregated.
- How much new for-sale + rental construction is in the pipeline within 1–3 miles? Heavy new supply typically softens prices + rents 12–24 months out; constrained supply supports both.
CashFlowRE · CFR-ZSA4DH8DECHQDN
· Data 2 days ago
cashflowre.app · 2026-05-29