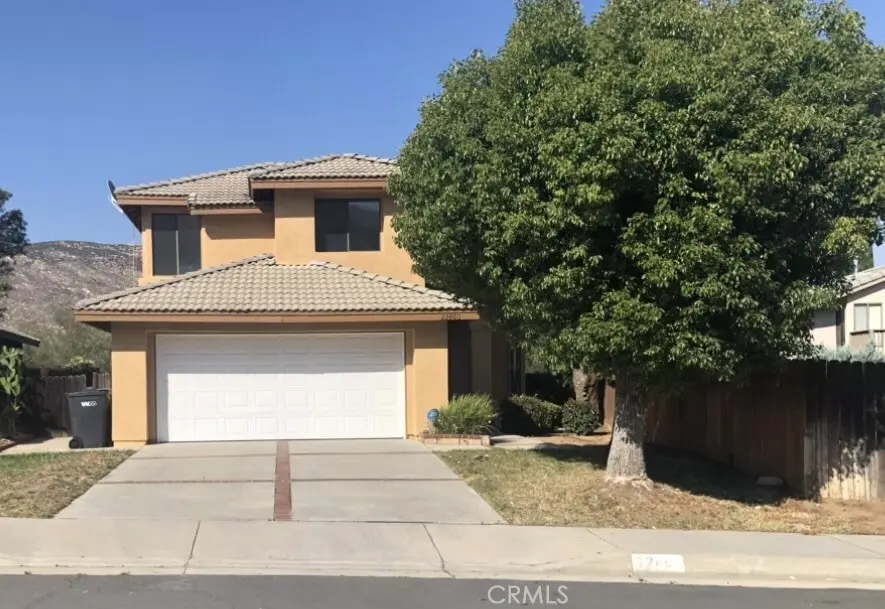
22860 Mountain Vw · Moreno Valley, CA
Flood risk 1/10 · Minimal
- FEMA flood zone
- X (unshaded)
- Chance of flooding over 30 yrs
- 0.0%
- Est. flood insurance / yr
- $507 – $1,088
Fire risk 9/10 · Severe
- Est. fire insurance / yr
- $659 – $1,223
Heat risk 7/10 · Major
- Hot days now (above 100°F)
- 7 days/yr
- Hot days in 30 yrs
- 23 days/yr
Wind risk 1/10 · Minimal
- Chance of severe wind over 30 yrs
- —
Air-quality risk 9/10 · Severe
- Unhealthy air days now
- 22 days/yr
- Unhealthy air days in 30 yrs
- 27 days/yr
Risk factors via First Street. Map © Google.
Why this score? — see what drove the D grade
The composite is a weighted blend of 9 inputs, each scored 0–100. Each bar is that input's sub-score; the figure is the points it added to the 100-point composite (weight × sub-score).
- Cash flow +14.3/30.0
- ARV discount +10.5/15.0
- DSCR +4.4/10.0
- 1% rule +3.1/10.0
- Rent growth +3.0/5.0
- Schools +2.8/10.0
- Livability +2.8/5.0
- Condition / age +2.5/5.0
- Appreciation +0.0/10.0
$524,900
🖨 Deal sheet 📄 Offer letter ✓ Due diligence
Listing remarks
This Hidden Springs community brings you back to nature with it Equestrian trails and a preserve are in these foothills, so even seeing a burro or 2 would not be unusual! Well planned community with lots of trails and greenery. Spacious 4 bed 3 bath home just now renovated! Lots of light and a view from every window. 2-car attached garage. Turnkey as everything has been painted, tile floors and new carpet. No HOA either!
Key facts
- 5,227 sq ft lot
- 2 garage spots
- Built 1988
Property features AI
Finance
- Other: Located north of the 60 freeway and west of Pigeon Pass Road
- HOA & community: Community features: curbs, mountainous setting, adjacent to preserve/public land
Exterior
- Parking: Attached 2-car garage with direct garage access; Total 2 parking spaces
- Utilities: Sewer: Other
- Home design: Two-story house; Entry on main level
- Construction: No accessory dwelling unit; One total unit
- Exterior features: House structure; No pool; 0–1 unit per acre lot; Has a view; Low-pile carpeting for accessibility
Interior
- Kitchen: Kitchen island; Range / stove hood; Gas range; Dishwasher; Formal dining area
- Bedrooms: All bedrooms located upstairs
- Flooring: Tile flooring; Carpet flooring
- Bathrooms: Two full bathrooms; One half bathroom; Upgraded bathrooms; Master bath with double sinks; Bathtub and separate shower (shower in tub also listed)
- Heating & cooling: Central cooling; Central furnace heating
- Interior features: Wet bar / bar; Balcony; Unfurnished; High (9'+) ceilings; Ceiling fan; Two-story ceilings; Storage space; Tile countertops; Cathedral/vaulted ceilings; Living room fireplace
- Laundry & utility: Laundry area in the garage
Neighborhood map
What this means for you Summary
Snapshot
- This is a 4-bed/2.5-bath single-family listed at $525k.
Deal economics
- At list price, monthly cash flow is $100 ($1k/yr) — positive.
- The deal already cash-flows at list — no discount required.
- To meet the 1% rule (rent ≥ 1% of price), the offer needs to be $425k (19.0% below list).
- Recommended offer: $425k (19.0% below list) — sets the bar for 1% rule.
- Cap rate 6.5% vs local median 3.9% in Moreno Valley — top-decile yield for the area; either an underpriced asset or a hidden risk that comps aren't pricing in. Stress-test before assuming the spread holds.
Location & tenants
- Location reads 55/100 on livability (#838 in CA) — a working-class tenant base; expect higher turnover. Strengths: housing A+, employment B; Watch: schools D-, amenities F, commute F.
- Moreno Valley Unified (suburban): math 23% / reading 34% proficiency, ranked #1,050 of 1,400 in CA (top 75%) — low school quality limits family demand, transient renter base, plan for 1-2y turnover; 69% free/reduced lunch — lower-income household profile, screen leases tightly.
- Market conditions: Rents rising (+2.0%/yr); 89 active listings in the ZIP; 8 comparable units currently listed for rent nearby; rentals leasing fast (median 5d on market — plan ~1-2 weeks tenant-placement turnaround); solid renter incomes; 9,195 units permitted in Riverside County in 2024 (1,512 in 5+ unit buildings).
- At $4,251/mo this rent would consume 54% of the median local household income ($95k/yr) (locally 1627% of renters already pay >50% of income on rent) — very limited rent-growth headroom before tenants either downsize or default.
Forward outlook
- Local home prices are declining (-3.0%/yr); year-one equity from $4k of loan paydown is wiped out by about $16k of value loss. Plan a longer hold.
- Riverside County population projected at +22% by 2050 — long-run rental-demand tailwind backs the buy-and-hold thesis.
Negotiation context
- Only 14 days on market — expect competitive offers; lowballing is unlikely to land.
- Current owner paid $126k; list at $525k implies a 315% gain — meaningful room to come down on a strong offer.
Risks & watch-outs
- Climate carrying-cost: severe wildfire risk; extreme-heat days projected 7→23/yr by 2055 (HVAC capex compounding) — expect insurance premiums to compound above CPI over the hold.
Questions for the listing agent
- Is there a deadline driving the sale (1031 exchange, divorce, estate, relocation)? That informs how much negotiation room exists.
- Schools are D-rated, which usually means shorter tenancies and higher turnover. Who's the typical renter profile here, and what's been the actual vacancy rate?
- The area grade is low — what's the realistic commute time and amenity access for the typical tenant pool here? Any planned neighborhood developments (good or bad) we should know about?
- What's the average days-on-market for RENTAL listings here right now (not sales)? A rising rental-DOM trend means longer vacancies and softer asking-rent achievability than the comps imply.
- What's the recent tenant-quality profile in this submarket — average credit score on applications, eviction rate, late-payment / NSF rate, and stable-employment percentage? A property-management company in the area should have these aggregated.
- How much new for-sale + rental construction is in the pipeline within 1–3 miles? Heavy new supply typically softens prices + rents 12–24 months out; constrained supply supports both.
Investment metrics
- 1% rule
- 0.81% ✗
- Cap rate
- 6.52%
- Cash-on-cash
- 0.82%
- DSCR
- 1.04
- GRM
- 10.3
CMA / ARV
- ARV (on-the-fly)
- $562,599
- Comps found
- 12
Show comp detail 12 sales within ~0.75 mi
| Address | Dist | Beds/Ba | Sqft | Sold | Price | $/sf | Match |
|---|---|---|---|---|---|---|---|
| 22562 Springdale | 0.20mi | 4/2.5 | 1,809 (0%) | 4mo | $589,900 | $326 | 87 |
| 23074 Sienna | 0.41mi | 4/2.5 | 1,895 (+5%) | 0mo | $590,000 | $311 | 73 |
| 10189 Via Apolina | 0.50mi | 4/2.5 | 1,783 (-1%) | 6mo | $542,500 | $304 | 69 |
| 10228 Via Pavon | 0.55mi | 4/2.5 | 1,783 (-1%) | 8mo | $559,999 | $314 | 65 |
| 22936 Brookhollow | 0.72mi | 4/2.5 | 1,798 (-1%) | 3mo | $600,000 | $334 | 64 |
| 22780 Mountain View Rd | 0.08mi | 3/2.5 (-1) | 1,538 (-15%) | 5mo | $570,000 | $371 | 63 |
| 23039 Montalvo | 0.43mi | 4/3.0 | 1,983 (+10%) | 0mo | $600,000 | $303 | 62 |
| 9820 Sycamore Cyn | 0.49mi | 3/2.5 (-1) | 1,690 (-7%) | 2mo | $560,000 | $331 | 59 |
| 9694 Sycamore Canyon Rd | 0.64mi | 4/3.0 | 1,867 (+3%) | 8mo | $569,000 | $305 | 56 |
| 22508 Mountain View Rd | 0.36mi | 3/3.0 (-1) | 2,073 (+15%) | 5mo | $547,000 | $264 | 48 |
| 10805 Breezy Mdw | 0.70mi | 4/3.0 | 2,002 (+11%) | 3mo | $620,000 | $310 | 45 |
| 10201 Coral Ln | 0.59mi | 3/3.0 (-1) | 2,071 (+14%) | 8mo | $580,000 | $280 | 35 |
Match score weights: distance 35% · size 25% · config 20% · recency 20%. Top-matched comps best support the ARV.
Projected returns pro-forma
-3.0% appreciation · 2.0% rent growth · sell at horizon
- IRR
- -16.1%
- Equity multiple
- 0.43×
- Total profit
- $-83,095
- Equity at exit
- $78,264
- IRR
- -9.4%
- Equity multiple
- 0.44×
- Total profit
- $-81,861
- Equity at exit
- $45,384
Cash invested: $146,972 (down + closing). Projections, not guarantees.
Landlord ↔ Tenant lean methodology
- Overall (STATE)
- 18 Strongly Tenant-Friendly
- State California
- 18 Strongly Tenant-Friendly · D+13
- County
- — inherits STATE
- City
- — inherits STATE
ZIP-level market 92557
- Home prices YoY
- -16.7%
- Rents YoY
- 2.0%
- Active inventory
- 89
- Price-to-rent
- 10.3×
Monthly cashflow live
- Estimated rent
- $4,251 high interval (Pro) →
- Mortgage (P&I)
- −$2,753
- Tax from tax record
- −$287 /mo · $3,448/yr
- Insurance
- −$219
- HOA
- −$0
- Vacancy / Maint / Mgmt
- −$893
- Net cashflow
- $100
Break-even live
UW: 25.0% down · 7.5% · 30yr · 1.5% tax · 5.0% vac · 8.0% maint · 8.0% mgmt
Financing live
Cash to close
- Down payment
- $131,225
- Closing costs
- $15,747
- Reserves months
- —
- Total cash needed
- —
Loan-product check · same deal, 3 products live
Conventional
25% down · 7.5% · 30yr
- Down + closing
- —
- Monthly P&I
- —
- Monthly cashflow
- —
- DSCR
- —
- Eligible?
- —
Personal DTI + credit; lowest rate.
DSCR
20% down · 8.5% · 30yr
- Down + closing
- —
- Monthly P&I
- —
- Monthly cashflow
- —
- DSCR
- —
- Eligible?
- —
No personal income docs; deal must DSCR.
Hard money
10% down · 12.0% · 12mo
- Down + closing
- —
- Monthly P&I
- —
- Monthly cashflow
- —
- DSCR
- —
- Eligible?
- —
Short-term bridge; refi at stabilization.
Rent comps 8 comps
| Address | Beds | Baths | Sqft | Rent | $/sqft | DOM | Units | Dist |
|---|---|---|---|---|---|---|---|---|
| 10311 Penguin Ct Moreno Valley, CA | 4.0 | 3.0 | 2590 | $7,500 | $2.90 | 43d | 1 | 0.33mi |
| 10045 Miracanto Way Moreno Valley, CA | 4.0 | 2.0 | 2143 | $3,500 | $1.63 | 12d | 1 | 0.36mi |
| 23400 Evening Snow Moreno Valley, CA | 4.0 | 2.5 | 2128 | $3,500 | $1.64 | 2d | 1 | 0.64mi |
| 11139 Saddle Ridge Rd Moreno Valley, CA | 4.0 | 2.0 | 2068 | $3,700 | $1.79 | 4d | 1 | 0.82mi |
| 23606 Parkland Ave Moreno Valley, CA | 3.0 | 2.5 | 1474 | $2,995 | $2.03 | 4d | 1 | 1.08mi |
| 23214 Sonnet Dr Moreno Valley, CA | 3.0 | 2.0 | 1375 | $2,800 | $2.04 | 4d | 1 | 1.15mi |
| 23890 Hazelwood Dr Moreno Valley, CA | 3.0 | 2.0 | 1534 | $3,100 | $2.02 | 4d | 1 | 1.19mi |
| 23913 Parkland Ave Moreno Valley, CA | 4.0 | 3.0 | 1600 | $2,750 | $1.72 | 4d | 1 | 1.43mi |
Listing history 15 events
-
2026-06-18days on market $524,900 Active 14 DOM
-
2026-06-17days on market $524,900 Active 13 DOM
-
2026-06-16days on market $524,900 Active 12 DOM
-
2026-06-15days on market $524,900 Active 11 DOM
-
2026-06-13days on market $524,900 Active 9 DOM
-
2026-06-13days on market $524,900 Active 8 DOM
-
2026-06-09days on market $524,900 Active 5 DOM
-
2026-06-08days on market $524,900 Active 4 DOM
-
2026-06-07remarks 428-char remark
-
2026-06-07statusdays on market $524,900 Active 3 DOM
-
2026-06-04days on market $524,900 Coming Soon 5 DOM
-
2026-06-03days on market $524,900 Coming Soon 4 DOM
-
2026-06-02days on market $524,900 Coming Soon 3 DOM
-
2026-06-01days on market $524,900 Coming Soon 2 DOM
-
2026-05-31$524,900 Coming Soon 1 DOM
ⓘ Source: listings_history table (triggers on properties + properties_extension) + one-shot
backfill from property_details.listing_events for pre-trigger history.
Tax reassessment forecast CA · Resets to sale price
- Current annual tax
- $3,448 · $287/mo
- Projected year-2 tax
- $3,989 · $332/mo
- Expected delta
- +$542/yr (+$45/mo · 15.7%)
ⓘ Screening estimate from a state-policy table — verify with the county assessor before closing.
Climate risk First Street
- Flood 1/10 Low FEMA zone X (unshaded) · 0% chance over 30 yrs
- Wildfire 9/10 Extreme
- Heat 7/10 Severe 7 d/yr ≥100°F today · 23 d/yr by 30 yrs out
- Wind 1/10 Low
- Air quality 9/10 Extreme 22 unhealthy d/yr today · 27 by 30 yrs out
Nearby sold comps map
Loading sold comps map…
Walkable amenities ~0.75 mi
Loading nearby amenities…
Taxation est. · year 1
- Rental income
- $51,015
- − Mortgage interest
- −$29,403
- − Property taxes
- −$3,448
- − Insurance
- −$2,624
- − Repairs & maintenance
- −$4,081
- − Management
- −$4,081
- − Depreciation
- −$15,270
- Taxable loss
- −$7,892
- Est. tax savings @ 24.0%
- +$1,894
- After-tax cash flow
- $3,092/yr
For passive investors: Depreciation is non-cash, so a rental often shows a tax loss while cash-flowing — sheltering income. Rental losses are passive: they offset passive income freely, and up to $25,000/yr can offset ordinary (W-2) income if you actively participate and your MAGI is under $100k (phasing out to $0 by $150k); unused losses carry forward. On sale, claimed depreciation is recaptured at up to 25%, and gains may owe capital-gains tax (a 1031 exchange can defer both). Figures are a year-1 estimate at your 24.0% rate — not tax advice; consult a CPA.
Schools (NCES district)
- District
- Moreno Valley Unified
- NCES district ID
- 0625800
- Math proficiency
- 23% ▲ 1.00%
- Reading proficiency
- 34% ▲ 3.00%
- Median HH income
- $55,495
- Composite
- 28.36/100
- National rank
- #12131
- State rank
- #1050 of 1400 in CA
Livability — Moreno Valley
- Score
- 55/100
- State rank
- #838
- US rank
- #23203
Category grades
Schools grade is shown separately in the Schools card above.
Census & demographics
- Census place
- Moreno Valley, CA
- County
- Riverside County · 2,287,001 people
- City population
- 212,104
- Metro
- Riverside-San Bernardino-Ontario, CA
- Population (ZIP)
- 54,061
- Household income
- $94,804
- Rent vs Own
- Severe rent burden
- 1627.0
Population outlook (Riverside County) Hauer SSP2
- Today (2025)
- 2,664,475 people
- By 2030
- 2,802,692 · +5.2%
- By 2040
- 3,050,904 · +14.5%
- By 2050
- 3,256,783 · +22.2%
- By 2075
- 3,655,058 · +37.2%
- By 2100
- 3,766,594 · +41.4%
Race, ethnicity, and origin ACS 2023
- Neighborhood character
- Diverse neighborhood (Simpson 0.65)
- Race & ethnicity
- Hispanic / Latino 54% White 19% Black 17% Two or more races 15% Asian 5% Native American 1%
- Hispanic origin (detail)
- Mexican 46%
- Common ancestry
- Slovak 1% Italian 1% Iranian 1%
- Foreign-born
- 22% · Canada, China
- Languages at home
- 57% English-only · Spanish 38% Other Indo-European 1% Other Asian/Pacific 1%
Political lean MEDSL · Riverside
- 2024 margin
- Toss-up / Even · D 48.0% · R 49.3% · Other 2.6%
- 2008→2024 swing
- -3.6pp toward R · 2008: 2.3pp · 2024: -1.3pp
- All cycles
- 2024: R+1.3 2020: D+8.0 2016: D+4.3 2012: R+0.4 2008: D+2.3
Not yet ingested
- Civics
- —
Market trends
- HPI YoY
- ▼ -77.93%
- Current HPI
- 388.882
- Rent YoY
- ▲ 2.00%
- Metro
- Riverside-San Bernardino-Ontario, CA
- State GDP YoY
- ▲ 3.21%
- F500 in state
- 116
Industry mix (Fortune 500 HQ in CA)
| Industry | F500 HQs | Revenue |
|---|---|---|
| Technology | 27 | $1,492B |
|
||
| Financial Services | 3 | $174B |
|
||
| Retail | 3 | $44B |
|
||
| Insurance | 3 | $26B |
|
||
| Media / Entertainment | 2 | $115B |
|
||
| Pharmaceuticals / Biotech | 2 | $62B |
|
||
Price history
+314.9% since first listed2 events — show timeline
- 2026-05-30 Coming Soon $524,900 CRMLS
- 1988-11-01 Sold (Public Records) $126,500 Public Records
Property tax history
+2.0%/yrLatest (2025): $3,448 · +3.2% YoY. Source: county tax records.
Cash-flow waterfall
monthlySold comps — $/sqft
last 12 mo · ≤1 miLoading sold comps…