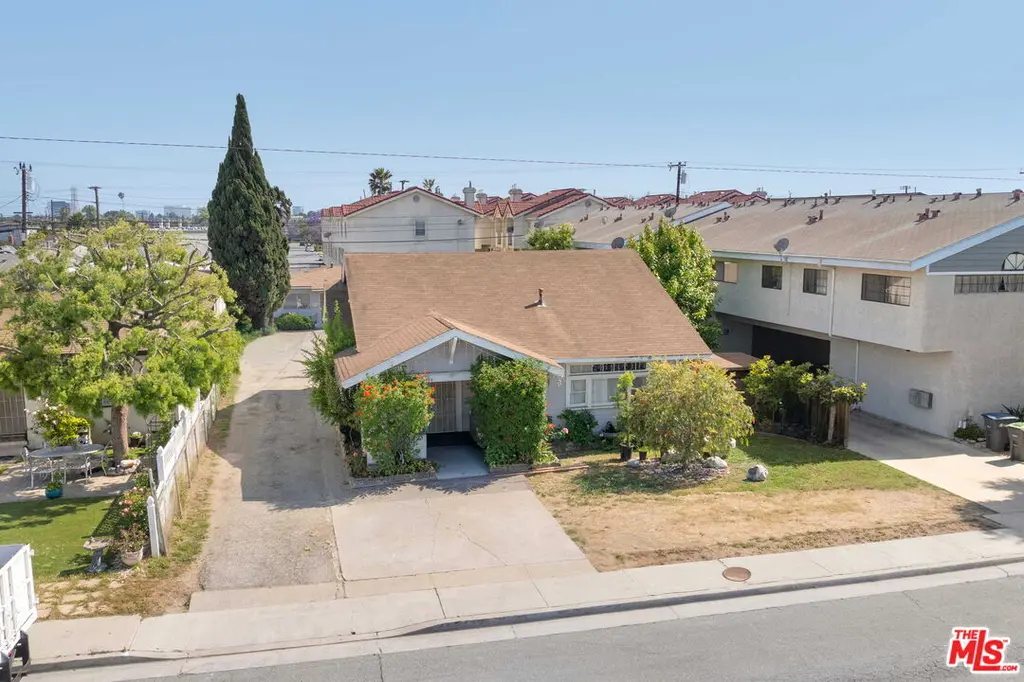
1148 W 166th St
Gardena, CA 90247
$900,000C
2 bd · 2.0 ba ·
1,152 sqft ·
Built 1956
· MultiFamily
· Active
· 41 DOM
Cashflow @ list (25.0% down · 7.5%)
Estimated rent
$10,063/mo
Mortgage (P&I)
−$4,720
Tax + insurance
−$582
HOA
−$0
Vac / Maint / Mgmt
−$2,113
Net cashflow
$2,648/mo
Annual
$31,773/yr
Cap rate
9.82%
Cash-on-cash
12.61%
DSCR
1.56
1% rule
1.12%
Cash to close
$252,000
Investor read
- This is a 4 × 6-bed/3.0-bath units multifamily listed at $900k.
- At list price, monthly cash flow is $3k ($32k/yr) — positive. Per door: $662/mo.
- The deal already cash-flows at list — no discount required.
- Meets the 1% rule at list price ($10k rent vs $900k).
- It's been on market 41 days — a 3% lower offer ($873k) is reasonable based on typical stale-listing flexibility.
- Recommended offer: $873k (3.0% below list) — sets the bar for market timing.
- Local home prices are declining (-3.0%/yr); year-one equity from $6k of loan paydown is wiped out by about $27k of value loss. Plan a longer hold.
- Location reads 60/100 on livability (#604 in CA) — a middle-class / working-renter tenant base. Strengths: employment A-; Watch: amenities C-, crime F, cost of living F.
- Los Angeles Unified (urban): math 29% / reading 54% proficiency, ranked #223 of 517 in CA (top 43%) — families likely to look elsewhere, expect single-tenant / working-renter base with shorter leases; 67% free/reduced lunch — lower-income household profile, screen leases tightly.
- Zoned schools: Denker Avenue Elementary (672 students, 77% FRL); Robert E. Peary Middle (1,164 students, 90% FRL); Gardena Senior High (math 17% / reading 45%, grade F, #702 of 1,170 statewide, top 61%, 1,560 students, 92% FRL) — zoned schools average 86% FRL vs 67% district-wide (19 pts higher); higher-poverty schools than district average — tighter screening recommended.
- Watch-outs: built in 1956 — expect roof / HVAC / electrical / plumbing capex.
- Market conditions: Rents rising (+1.8%/yr); 74 active listings in the ZIP; 40 comparable units currently listed for rent nearby; rentals at typical pace (median 26d on market — plan ~3-4 weeks tenant-placement turnaround); 40% of comp listings sitting > 30 days — soft ceiling on asking rent; solid renter incomes; 19,697 units permitted in Los Angeles County in 2024 (9,426 in 5+ unit buildings).
- Los Angeles County population projected at +9% by 2050 — modest demand growth; plan on rents tracking national, not racing it.
- Cap rate 9.8% vs local median 2.9% in Gardena — top-decile yield for the area; either an underpriced asset or a hidden risk that comps aren't pricing in. Stress-test before assuming the spread holds.
- At $10,063/mo this rent would consume 156% of the median local household income ($77k/yr) (locally 2604% of renters already pay >50% of income on rent) — very limited rent-growth headroom before tenants either downsize or default.
Questions for listing agent
- It's been on market 41 days. Have you received any prior offers? Is the seller open to a 3% concession, seller financing, or rate buy-down credit?
- Can we see the unit-by-unit rent roll, current vacancy, and any below-market leases? What's the average tenancy length?
- What capital expenditures (roof, boiler, parking lot, exteriors) have been made in the last 5 years, and what's planned in the next 2?
- Built in 1956 — when were the roof, HVAC, electrical panel, plumbing, and water heater last replaced?
- Is there a deadline driving the sale (1031 exchange, divorce, estate, relocation)? That informs how much negotiation room exists.
- Schools are D-rated, which usually means shorter tenancies and higher turnover. Who's the typical renter profile here, and what's been the actual vacancy rate?
- Crime grade is F in this area — have there been break-ins, vandalism, or insurance claims at this property in the last 3 years? What carrier currently insures it and at what premium?
- What's the average days-on-market for RENTAL listings here right now (not sales)? A rising rental-DOM trend means longer vacancies and softer asking-rent achievability than the comps imply.
CashFlowRE · CFR-ZSEYR0DN0Y25M8
· Data 19 h ago
cashflowre.app · 2026-05-29