 Fourplex
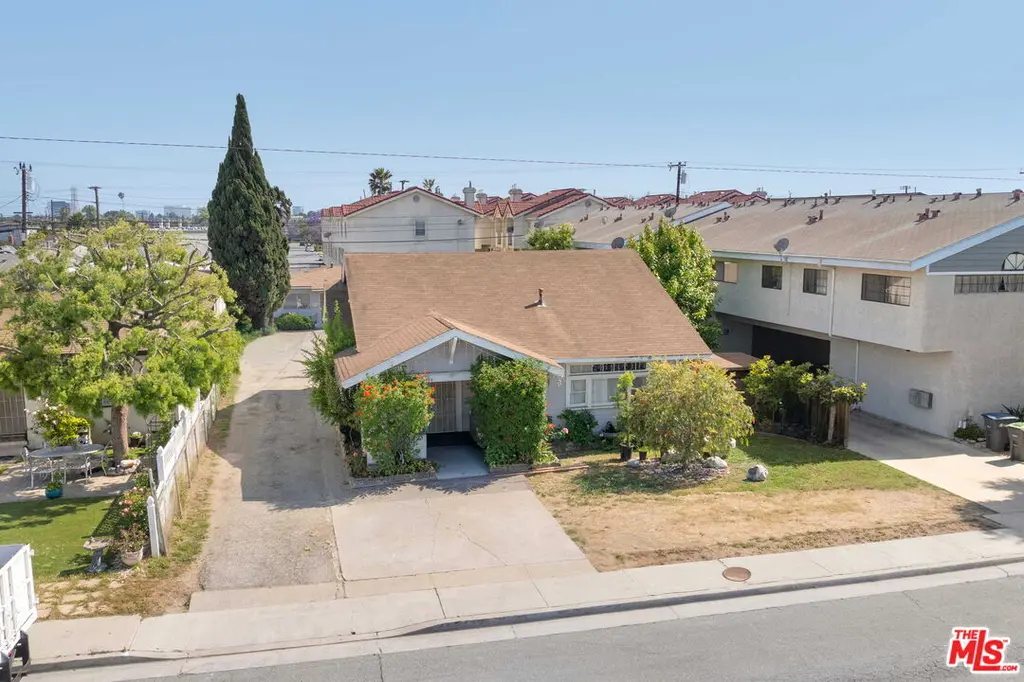
1148 W 166th St · Gardena, CA
Flood risk 1/10 · Minimal
- FEMA flood zone
- X (unshaded)
- Chance of flooding over 30 yrs
- 0.0%
- Est. flood insurance / yr
- $507 – $1,088
Fire risk 1/10 · Minimal
- Est. fire insurance / yr
- $659 – $1,223
Heat risk 4/10 · Minor
- Hot days now (above 87°F)
- 7 days/yr
- Hot days in 30 yrs
- 21 days/yr
Wind risk 1/10 · Minimal
- Chance of severe wind over 30 yrs
- —
Air-quality risk 5/10 · Moderate
- Unhealthy air days now
- 7 days/yr
- Unhealthy air days in 30 yrs
- 7 days/yr
Risk factors via First Street. Map © Google.
Why this score? — see what drove the C grade
The composite is a weighted blend of 9 inputs, each scored 0–100. Each bar is that input's sub-score; the figure is the points it added to the 100-point composite (weight × sub-score).
- Cash flow +27.5/30.0
- DSCR +9.6/10.0
- 1% rule +6.2/10.0
- Schools +3.6/10.0
- Livability +3.0/5.0
- Rent growth +2.9/5.0
- Condition / age +2.5/5.0
- ARV discount +0.0/15.0
- Appreciation +0.0/10.0
$900,000
🖨 Deal sheet (PDF) 📄 Offer letter ✓ Due diligence
Multi-family units
County records classify this as Multi-Family (2-4 Unit). Listing-text estimate: 4 units. confirmed
Listing remarks
FULLY OCCUPIED PROPERTY. DELIVERED FULLY OCCUPIED. DRIVE-BY ONLY! Submit offer subject to interior inspection! We are pleased to present 1148 W 166th St in Gardena, a compelling 4-unit investment opportunity offering significant upside and long-term growth potential. The property features a standalone 3-bedroom, 1-bathroom front house, providing strong owner-user appeal or the ability to capture premium rental income, a key differentiator from typical multifamily assets. The investment is highlighted by a 48% rental upside, presenting a clear mark-to-market opportunity for investors to substantially increase income and overall returns. Coupled with its strong value-add potential, the proper
Key facts
- 48% rental upside
- Value-add potential
- Increased density
Tags
Property features AI
Finance
- Financial info: Actual gross income: $66,108 per year; Net operating income: $34,819 per year; Total annual expenses: $29,306; Gross rent multiplier: 13.61; Unit rents (actual): one 3-bed $1,476; two 1-bed $1,417 each; one studio $1,200; Projected rents: 3-bed $2,795; 1-bed $1,895; studio $1,550
- HOA & community: Four units in the complex
Exterior
- Parking: Covered parking; Four total parking spaces
- Home design: Residential income property; Single-story (one level); Two separate buildings on the property
- Exterior features: No additional structures on the lot; Zoned GAR3
Interior
- Kitchen: Range/oven; Refrigerator; Garbage disposal
- Bedrooms: One 3-bedroom unit; Two 1-bedroom units; One studio/efficiency unit
- Bathrooms: Four 1-bath units (each unit has one bathroom)
- Heating & cooling: Wall heating; No central cooling
- Interior features: Garbage disposal; Range/oven; Refrigerator
Neighborhood map
What this means for you Summary
Snapshot
- This is a 4 × 6-bed/3.0-bath units multifamily listed at $900k.
Deal economics
- At list price, monthly cash flow is $3k ($32k/yr) — positive. Per door: $662/mo.
- The deal already cash-flows at list — no discount required.
- Meets the 1% rule at list price ($10k rent vs $900k).
- Recommended offer: $873k (3.0% below list) — sets the bar for market timing.
- Cap rate 9.8% vs local median 2.9% in Gardena — top-decile yield for the area; either an underpriced asset or a hidden risk that comps aren't pricing in. Stress-test before assuming the spread holds.
Location & tenants
- Location reads 60/100 on livability (#604 in CA) — a middle-class / working-renter tenant base. Strengths: employment A-; Watch: amenities C-, schools D+, crime F.
- Los Angeles Unified (urban): math 29% / reading 54% proficiency, ranked #223 of 517 in CA (top 43%) — families likely to look elsewhere, expect single-tenant / working-renter base with shorter leases; 67% free/reduced lunch — lower-income household profile, screen leases tightly.
- Market conditions: Rents rising (+1.8%/yr); 73 active listings in the ZIP; 40 comparable units currently listed for rent nearby; rentals at typical pace (median 26d on market — plan ~3-4 weeks tenant-placement turnaround); 40% of comp listings sitting > 30 days — soft ceiling on asking rent; solid renter incomes; 19,697 units permitted in Los Angeles County in 2024 (9,426 in 5+ unit buildings).
- At $10,063/mo this rent would consume 156% of the median local household income ($77k/yr) (locally 2604% of renters already pay >50% of income on rent) — very limited rent-growth headroom before tenants either downsize or default.
Forward outlook
- Local home prices are declining (-3.0%/yr); year-one equity from $6k of loan paydown is wiped out by about $27k of value loss. Plan a longer hold.
- Los Angeles County population projected at +9% by 2050 — modest demand growth; plan on rents tracking national, not racing it.
Negotiation context
- It's been on market 41 days — a 3% lower offer ($873k) is reasonable based on typical stale-listing flexibility.
Risks & watch-outs
- Watch-outs: built in 1956 — expect roof / HVAC / electrical / plumbing capex.
Questions for the listing agent
- It's been on market 41 days. Have you received any prior offers? Is the seller open to a 3% concession, seller financing, or rate buy-down credit?
- Can we see the unit-by-unit rent roll, current vacancy, and any below-market leases? What's the average tenancy length?
- What capital expenditures (roof, boiler, parking lot, exteriors) have been made in the last 5 years, and what's planned in the next 2?
- Built in 1956 — when were the roof, HVAC, electrical panel, plumbing, and water heater last replaced?
- Is there a deadline driving the sale (1031 exchange, divorce, estate, relocation)? That informs how much negotiation room exists.
- Schools are D-rated, which usually means shorter tenancies and higher turnover. Who's the typical renter profile here, and what's been the actual vacancy rate?
- Crime grade is F in this area — have there been break-ins, vandalism, or insurance claims at this property in the last 3 years? What carrier currently insures it and at what premium?
- What's the average days-on-market for RENTAL listings here right now (not sales)? A rising rental-DOM trend means longer vacancies and softer asking-rent achievability than the comps imply.
- What's the recent tenant-quality profile in this submarket — average credit score on applications, eviction rate, late-payment / NSF rate, and stable-employment percentage? A property-management company in the area should have these aggregated.
- How much new apartment / multifamily construction is in the pipeline within 1–3 miles? Heavy new supply (>2% of stock underway) typically softens rents 12–24 months out; light construction supports rent growth.
Investment metrics
- 1% rule
- 1.12% ✓
- Cap rate
- 9.82%
- Cash-on-cash
- 12.61%
- DSCR
- 1.56
- GRM
- 7.5
CMA / ARV
- ARV (on-the-fly)
- $698,112
- Comps found
- 1
Show comp detail 1 sale within ~0.75 mi
| Address | Dist | Beds/Ba | Sqft | Sold | Price | $/sf | Match |
|---|---|---|---|---|---|---|---|
| 1308 W 164th St | 0.23mi | 2/2.0 | 1,196 (+4%) | 21mo | $725,000 | $606 | 66 |
Match score weights: distance 35% · size 25% · config 20% · recency 20%. Top-matched comps best support the ARV.
Projected returns pro-forma
-3.0% appreciation · 1.79% rent growth · sell at horizon
- IRR
- 1.1%
- Equity multiple
- 1.04×
- Total profit
- $10,279
- Equity at exit
- $134,193
- IRR
- 9.5%
- Equity multiple
- 1.70×
- Total profit
- $175,941
- Equity at exit
- $77,816
Cash invested: $252,000 (down + closing). Projections, not guarantees.
Landlord ↔ Tenant lean methodology
- Overall (STATE)
- 18 Strongly Tenant-Friendly
- State California
- 18 Strongly Tenant-Friendly · D+13
- County
- — inherits STATE
- City
- — inherits STATE
ZIP-level market 90247
- Rents YoY
- 1.8%
- Active inventory
- 73
- Price-to-rent
- 29.8×
Monthly cashflow live
- Estimated rent
- $10,063 medium interval (Pro) →
- Mortgage (P&I)
- −$4,720
- Tax from tax record
- −$207 /mo · $2,488/yr
- Insurance
- −$375
- HOA
- −$0
- Vacancy / Maint / Mgmt
- −$2,113
- Net cashflow
- $2,648
Break-even live
Sensitivity live
| Price | -10% $3,157 | -5% $2,902 | +0% $2,648 | +5% $2,393 | +10% $2,138 |
|---|---|---|---|---|---|
| Rent | -10% $1,853 | -5% $2,250 | +0% $2,648 | +5% $3,045 | +10% $3,443 |
| Rate | -1.0pp $3,101 | -0.5pp $2,877 | base $2,648 | +0.5pp $2,415 | +1.0pp $2,177 |
4-unit breakdown (identical units grouped — click to expand)
| Units | Beds | Baths | Est. rent |
|---|---|---|---|
| 4× units | 6 | 3 | $10,064 |
| #1 | 6 | 3 | $2,516 |
| #2 | 6 | 3 | $2,516 |
| #3 | 6 | 3 | $2,516 |
| #4 | 6 | 3 | $2,516 |
| Total (4 units) | $10,063 | ||
UW: 25.0% down · 7.5% · 30yr · 1.5% tax · 5.0% vac · 8.0% maint · 8.0% mgmt
Financing live
Cash to close
- Down payment
- $225,000
- Closing costs
- $27,000
- Reserves months
- —
- Total cash needed
- —
Loan-product check · same deal, 3 products live
Conventional
25% down · 7.5% · 30yr
- Down + closing
- —
- Monthly P&I
- —
- Monthly cashflow
- —
- DSCR
- —
- Eligible?
- —
Personal DTI + credit; lowest rate.
DSCR
20% down · 8.5% · 30yr
- Down + closing
- —
- Monthly P&I
- —
- Monthly cashflow
- —
- DSCR
- —
- Eligible?
- —
No personal income docs; deal must DSCR.
Hard money
10% down · 12.0% · 12mo
- Down + closing
- —
- Monthly P&I
- —
- Monthly cashflow
- —
- DSCR
- —
- Eligible?
- —
Short-term bridge; refi at stabilization.
Rent comps 40 comps
| Address | Beds | Baths | Sqft | Rent | $/sqft | DOM | Units | Dist |
|---|---|---|---|---|---|---|---|---|
| 1040 W 165th Pl Unit 1 Gardena, CA | 3.0 | 3.0 | 1500 | $4,501 | $3.00 | 0d | 1 | 0.14mi |
| 1040 W 165th Pl Unit A Gardena, CA | 3.0 | 3.0 | 1500 | $4,500 | $3.00 | 0d | 1 | 0.14mi |
| 1261 W 166th St Gardena, CA | 3.0 | 2.0 | 1280 | $3,000 | $2.34 | 45d | 1 | 0.14mi |
| 1328 W Gardena Blvd Apt 3 Gardena, CA | 2.0 | 2.0 | 1080 | $2,700 | $2.50 | 45d | 1 | 0.22mi |
| 860 W 165th Pl Apt 201 Gardena, CA | 2.0 | 2.0 | 925 | $2,395 | $2.59 | 45d | 1 | 0.23mi |
| 1343 W 164th St Gardena, CA | 2.0 | 2.0 | 800 | $2,700 | $3.38 | 26d | 1 | 0.29mi |
| 16935 S Vermont Ave Gardena, CA | 2.0 | 1.0 | 850 | $2,295 | $2.70 | 26d | 1 | 0.29mi |
| 16920 S Vermont Ave Unit D Gardena, CA | 2.0 | 1.5 | 1100 | $2,795 | $2.54 | 20d | 1 | 0.30mi |
| 16920 S Vermont Ave Gardena, CA | 2.0 | 1.5 | 1100 | $2,795 | $2.54 | 26d | 1 | 0.30mi |
| 1029 W 160th St Gardena, CA | 3.0 | 2.0 | 1248 | $4,150 | $3.33 | 45d | 1 | 0.45mi |
| 16326 Denker Ave Gardena, CA | 2.0 | 1.0 | 908 | $3,000 | $3.30 | 45d | 1 | 0.55mi |
| 1616 W Gardena Blvd Gardena, CA | 2.0 | 1.0 | 882 | $2,800 | $3.17 | 4d | 1 | 0.59mi |
| 1030 Magnolia Ave Gardena, CA | 1.0–2.0 | 1.0 | 710 | $2,700 | $3.80 | 45d | 2 | 0.59mi |
| 16523 S Denver Ave Gardena, CA | 2.0 | 1.5 | 1200 | $2,450 | $2.04 | 45d | 1 | 0.64mi |
| 17310 S Dalton Ave #3 Gardena, CA | 2.0 | 2.5 | 1400 | $3,500 | $2.50 | 26d | 1 | 0.66mi |
| 15605 S Berendo Ave Gardena, CA | 3.0 | 2.0 | 1208 | $5,350 | $4.43 | 16d | 1 | 0.66mi |
| 515 W Gardena Blvd #18 Gardena, CA | 3.0 | 2.0 | 1235 | $4,500 | $3.64 | 45d | 1 | 0.69mi |
| 15702 Brighton Ave Unit 4 Gardena, CA | 2.0 | 1.0 | 750 | $2,500 | $3.33 | 20d | 1 | 0.70mi |
| 15515 S Vermont Ave Gardena, CA | 2.0 | 1.0 | 800 | $2,195 | $2.74 | 26d | 1 | 0.70mi |
| 17313 Denker Ave Unit 4 Gardena, CA | 2.0 | 1.0 | 985 | $2,300 | $2.34 | 45d | 1 | 0.71mi |
| 15505 S Budlong Pl Unit 17 Gardena, CA | 2.0 | 1.0 | 900 | $2,295 | $2.55 | 45d | 1 | 0.71mi |
| 15825 Denker Ave Unit A Gardena, CA | 2.0 | 1.0 | 900 | $2,750 | $3.06 | 45d | 1 | 0.73mi |
| 1443 W 179th St Unit 107 Gardena, CA | 2.0 | 1.0 | 800 | $2,450 | $3.06 | 26d | 1 | 0.86mi |
| 1443 W 179th St Apt 104 Gardena, CA | 2.0 | 2.0 | 850 | $2,500 | $2.94 | 45d | 1 | 0.86mi |
| 1661 W 158th St Apt 103 Gardena, CA | 2.0 | 2.0 | 935 | $2,550 | $2.73 | 0d | 1 | 0.87mi |
| 15214 S Raymond Ave Gardena, CA | 2.0 | 2.0 | 1045 | $2,695 | $2.58 | 4d | 1 | 0.93mi |
| 15228 Normandie Ave Unit B Gardena, CA | 2.0 | 1.0 | 900 | $2,650 | $2.94 | 22d | 1 | 0.94mi |
| 16507 Saint Andrews Pl Unit C Gardena, CA | 2.0 | 1.0 | 850 | $2,650 | $3.12 | 45d | 1 | 0.97mi |
| 1243 Electric St Gardena, CA | 2.0 | 2.0 | 866 | $2,850 | $3.29 | 9d | 1 | 0.99mi |
| 15000 Halldale Ave #213 Gardena, CA | 2.0 | 2.0 | 1049 | $2,750 | $2.62 | 45d | 1 | 1.13mi |
| 14903 S Normandie Ave #115 Gardena, CA | 2.0 | 2.0 | 963 | $2,990 | $3.10 | 45d | 1 | 1.17mi |
| 14724 S Budlong Ave Apt A Gardena, CA | 2.0 | 2.0 | 1000 | $2,900 | $2.90 | 9d | 1 | 1.21mi |
| 18012 Manhattan Pl Torrance, CA | 3.0 | 2.0 | 1446 | $3,595 | $2.49 | 3d | 1 | 1.24mi |
| 14709 S Budlong Ave Gardena, CA | 2.0 | 2.0 | 875 | $2,814 | $3.22 | 9d | 2 | 1.25mi |
| 14700 S Berendo Ave #2 Gardena, CA | 2.0 | 3.0 | 1139 | $3,100 | $2.72 | 19d | 1 | 1.25mi |
| 14700 S Berendo Ave #2 Gardena, CA | 2.0 | 2.5 | 1139 | $3,100 | $2.72 | 45d | 1 | 1.25mi |
| 14640 Halldale Ave Apt 2 Gardena, CA | 2.0 | 1.5 | 1100 | $2,695 | $2.45 | 4d | 1 | 1.30mi |
| 2125 W 157th St Unit 10 Gardena, CA | 1.0 | 1.0 | 700 | $2,050 | $2.93 | 5d | 1 | 1.38mi |
| 2314 W 165th St Torrance, CA | 3.0 | 2.0 | 1304 | $4,000 | $3.07 | 19d | 1 | 1.39mi |
| 17405 Van Ness Ave Torrance, CA | 2.0 | 2.0 | 850 | $2,775 | $3.26 | 16d | 1 | 1.40mi |
Listing history 15 events
-
2026-06-21days on market $900,000 Active 41 DOM
-
2026-06-18days on market $900,000 Active 38 DOM
-
2026-06-17days on market $900,000 Active 37 DOM
-
2026-06-16days on market $900,000 Active 36 DOM
-
2026-06-15days on market $900,000 Active 35 DOM
-
2026-06-13days on market $900,000 Active 33 DOM
-
2026-06-09days on market $900,000 Active 29 DOM
-
2026-06-08days on market $900,000 Active 28 DOM
-
2026-06-07days on market $900,000 Active 27 DOM
-
2026-06-04days on market $900,000 Active 24 DOM
-
2026-06-03days on market $900,000 Active 23 DOM
-
2026-06-02days on market $900,000 Active 22 DOM
-
2026-06-01days on market $900,000 Active 21 DOM
-
2026-05-31days on market $900,000 Active 20 DOM
-
2026-05-08$900,000 Active
ⓘ Source: listings_history table (triggers on properties + properties_extension) + one-shot
backfill from property_details.listing_events for pre-trigger history.
Tax reassessment forecast CA · Resets to sale price
- Current annual tax
- $2,488 · $207/mo
- Projected year-2 tax
- $6,840 · $570/mo
- Expected delta
- +$4,352/yr (+$363/mo · 174.9%)
ⓘ Screening estimate from a state-policy table — verify with the county assessor before closing.
Climate risk First Street
- Flood 1/10 Low FEMA zone X (unshaded) · 0% chance over 30 yrs
- Wildfire 1/10 Low
- Heat 4/10 Moderate 7 d/yr ≥87°F today · 21 d/yr by 30 yrs out
- Wind 1/10 Low
- Air quality 5/10 Major 7 unhealthy d/yr today · 7 by 30 yrs out
Nearby sold comps map
Loading sold comps map…
Walkable amenities ~0.75 mi
Loading nearby amenities…
Taxation est. · year 1
- Rental income
- $120,756
- − Mortgage interest
- −$50,414
- − Property taxes
- −$2,488
- − Insurance
- −$4,500
- − Repairs & maintenance
- −$9,660
- − Management
- −$9,660
- − Depreciation
- −$26,182
- Taxable income
- $17,851
- Est. tax owed @ 24.0%
- −$4,284
- After-tax cash flow
- $27,489/yr
For passive investors: Depreciation is non-cash, so a rental often shows a tax loss while cash-flowing — sheltering income. Rental losses are passive: they offset passive income freely, and up to $25,000/yr can offset ordinary (W-2) income if you actively participate and your MAGI is under $100k (phasing out to $0 by $150k); unused losses carry forward. On sale, claimed depreciation is recaptured at up to 25%, and gains may owe capital-gains tax (a 1031 exchange can defer both). Figures are a year-1 estimate at your 24.0% rate — not tax advice; consult a CPA.
Schools (NCES district)
- District
- Los Angeles Unified
- NCES district ID
- 0622710
- Math proficiency
- 29% ▼ -4.00%
- Reading proficiency
- 54% ▲ 10.00%
- Median HH income
- $50,403
- Composite
- 35.67/100
- National rank
- #4875
- State rank
- #223 of 517 in CA
Livability — Gardena
- Score
- 60/100
- State rank
- #604
- US rank
- #19337
Category grades
Schools grade is shown separately in the Schools card above.
Census & demographics
- Census place
- Gardena, CA
- County
- Los Angeles County · 9,444,647 people
- City population
- 73,343
- Metro
- Los Angeles-Long Beach-Anaheim, CA
- Population (ZIP)
- 47,053
- Household income
- $77,333
- Rent vs Own
- Severe rent burden
- 2604.0
Population outlook (Los Angeles County) Hauer SSP2
- Today (2025)
- 10,940,515 people
- By 2030
- 11,256,481 · +2.9%
- By 2040
- 11,729,929 · +7.2%
- By 2050
- 11,948,407 · +9.2%
- By 2075
- 11,818,114 · +8.0%
- By 2100
- 10,842,928 · -0.9%
Race, ethnicity, and origin ACS 2023
- Neighborhood character
- Diverse neighborhood (Simpson 0.67)
- Race & ethnicity
- Hispanic / Latino 50% Asian 25% Two or more races 19% Black 15% White 6% Native American 2%
- Hispanic origin (detail)
- Mexican 37%
- Common ancestry
- British 1% Lithuanian 1%
- Foreign-born
- 38% · Canada, South Korea, Vietnam
- Languages at home
- 39% English-only · Spanish 40% Other Asian/Pacific 6% Korean 5%
Political lean MEDSL · Los Angeles
- 2024 margin
- Solid D (+32.9) · D 64.8% · R 31.9% · Other 3.3%
- 2008→2024 swing
- -7.4pp toward R · 2008: 40.4pp · 2024: 32.9pp
- All cycles
- 2024: D+32.9 2020: D+44.2 2016: D+48.0 2012: D+40.0 2008: D+40.4
Not yet ingested
- Civics
- —
Market trends
- HPI YoY
- ▼ -683.33%
- Current HPI
- 420.4015
- Rent YoY
- ▲ 1.79%
- Metro
- Los Angeles-Long Beach-Anaheim, CA
- State GDP YoY
- ▲ 3.21%
- F500 in state
- 116
Industry mix (Fortune 500 HQ in CA)
| Industry | F500 HQs | Revenue |
|---|---|---|
| Technology | 27 | $1,492B |
|
||
| Financial Services | 3 | $174B |
|
||
| Retail | 3 | $44B |
|
||
| Insurance | 3 | $26B |
|
||
| Media / Entertainment | 2 | $115B |
|
||
| Pharmaceuticals / Biotech | 2 | $62B |
|
||
Price history
1 event — show timeline
- 2026-05-08 Listed $900,000 TheMLS
Property tax history
+3.0%/yrLatest (2025): $2,488 · +11.2% YoY. Source: county tax records.
Cash-flow waterfall
monthlySold comps — $/sqft
last 12 mo · ≤1 miLoading sold comps…