170 W River RD Rd W
Lexington, NE 68850
$35,000D
3 bd · 1.0 ba ·
910 sqft ·
Built 1974
· Manufactured
· Active
· 6 DOM
Cashflow @ list (25.0% down · 7.5%)
Estimated rent
$1,476/mo
Mortgage (P&I)
−$184
Tax + insurance
−$485
HOA
−$0
Vac / Maint / Mgmt
−$310
Net cashflow
$498/mo
Annual
$5,973/yr
Cap rate
37.98%
Cash-on-cash
113.17%
DSCR
6.04
1% rule
4.22%
Cash to close
$9,800
Investor read
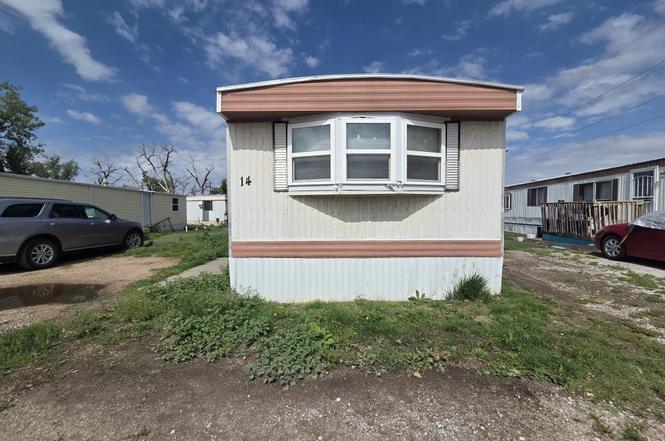
- This is a 3-bed/1.0-bath manufactured listed at $35k.
- At list price, monthly cash flow is $498 ($6k/yr) — positive.
- The deal already cash-flows at list — no discount required.
- Meets the 1% rule at list price ($1k rent vs $35k).
- Only 6 days on market — expect competitive offers; lowballing is unlikely to land.
- Local home prices are declining (-3.0%/yr); year-one equity from $242 of loan paydown is wiped out by about $1k of value loss. Plan a longer hold.
- Location reads 74/100 on livability (#112 in NE, #4,483 nationally) — a middle-class / working-renter tenant base. Strengths: cost of living A+, housing A+, health & safety A+; Watch: employment C-, amenities F, commute F.
- Lexington Public Schools (town): math 31% / reading 31% proficiency, ranked #106 of 111 in NE (top 96%) — families likely to look elsewhere, expect single-tenant / working-renter base with shorter leases; 65% free/reduced lunch — lower-income household profile, screen leases tightly.
- Zoned schools: Morton Elementary School (360 students, 82% FRL); Lexington Middle School (math 35% / reading 34%, grade F, #104 of 128 statewide, top 82%, 685 students, 73% FRL); Lexington High School (math 29% / reading 32%, grade F, #232 of 261 statewide, top 89%, 913 students, 71% FRL).
- Watch-outs: flood insurance adds $427/mo.
- Market conditions: 57 active listings in the ZIP; 1 comparable units currently listed for rent nearby; 61 units permitted in Dawson County in 2024 (36 in 5+ unit buildings).
- Dawson County population projected to shrink 8% by 2050 — rents likely to lag national; underwrite the cash flow, not the appreciation.
- At projected returns (-3.0% appreciation + 3.0% rent growth), your $10k cash investment doubles in ~2 years — after that, you're playing with house money.
- Climate carrying-cost: in FEMA flood zone AE (mandatory federal flood insurance) — expect insurance premiums to compound above CPI over the hold.
- Cap rate 38.0% vs local median 3.6% in Lexington — top-decile yield for the area; either an underpriced asset or a hidden risk that comps aren't pricing in. Stress-test before assuming the spread holds.
Questions for listing agent
- Built in 1974 — when were the roof, HVAC, electrical panel, plumbing, and water heater last replaced?
- What's the actual annual flood-insurance premium (NFIP or private), and is the property in a SFHA with mandatory coverage?
- Is there a deadline driving the sale (1031 exchange, divorce, estate, relocation)? That informs how much negotiation room exists.
- Schools are F-rated, which usually means shorter tenancies and higher turnover. Who's the typical renter profile here, and what's been the actual vacancy rate?
- The area grade is low — what's the realistic commute time and amenity access for the typical tenant pool here? Any planned neighborhood developments (good or bad) we should know about?
- What's the average days-on-market for RENTAL listings here right now (not sales)? A rising rental-DOM trend means longer vacancies and softer asking-rent achievability than the comps imply.
- What's the recent tenant-quality profile in this submarket — average credit score on applications, eviction rate, late-payment / NSF rate, and stable-employment percentage? A property-management company in the area should have these aggregated.
- How much new for-sale + rental construction is in the pipeline within 1–3 miles? Heavy new supply typically softens prices + rents 12–24 months out; constrained supply supports both.
CashFlowRE · CFR-ZTD4T46PFNTPPV
· Data 1 day ago
cashflowre.app · 2026-05-29