170 W River RD Rd W · Lexington, NE
Flood risk 1/10 · Minimal
- FEMA flood zone
- AE
- Chance of flooding over 30 yrs
- 0.0%
- Est. flood insurance / yr
- $1,737 – $8,500
Fire risk 2/10 · Minimal
- Est. fire insurance / yr
- $1,161 – $2,155
Heat risk 3/10 · Minor
- Hot days now (above 98°F)
- 7 days/yr
- Hot days in 30 yrs
- 17 days/yr
Wind risk 2/10 · Minimal
- Chance of severe wind over 30 yrs
- —
Air-quality risk 1/10 · Minimal
- Unhealthy air days now
- 0 days/yr
- Unhealthy air days in 30 yrs
- 0 days/yr
Risk factors via First Street. Map © Google.
Why this score? — see what drove the D grade
The composite is a weighted blend of 9 inputs, each scored 0–100. Each bar is that input's sub-score; the figure is the points it added to the 100-point composite (weight × sub-score).
- Cash flow +15.0/30.0
- ARV discount +7.5/15.0
- 1% rule +5.0/10.0
- DSCR +5.0/10.0
- Livability +3.7/5.0
- Schools +2.7/10.0
- Rent growth +2.5/5.0
- Condition / age +2.5/5.0
- Appreciation +0.0/10.0
$35,000
🖨 Deal sheet 📄 Offer letter ✓ Due diligence
Listing remarks
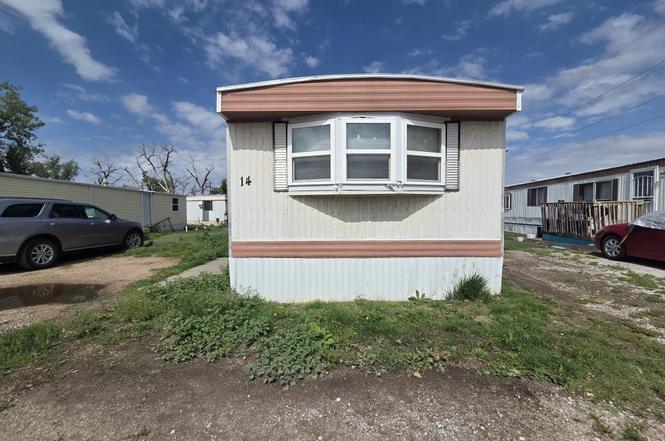
Whether you're looking for an affordable place to live or an investment opportunity, this Mobile home is worth a look. Located on a leased lot, this property offers a functional layout and spacious living areas.
Key facts
- Built 1974
- Listed 5 days
Property features AI
Exterior
- Parking: No garage
- Utilities: Sewer: other
- Home design: Mobile home (residential); Built in 1974; Other number of levels
- Construction: Other foundation
- Exterior features: Porch
Interior
- Bedrooms: Master bedroom on the main floor; Second bedroom on the main floor; Third bedroom on the main floor
- Bathrooms: 1 full bathroom on the main floor
- Heating & cooling: Electric forced-air heating; Central air conditioning
- Interior features: No basement; No fireplaces
Neighborhood map
What this means for you Summary
Snapshot
- This is a 3-bed/1.0-bath manufactured listed at $35k.
Deal economics
- At list price, monthly cash flow is $498 ($6k/yr) — positive.
- The deal already cash-flows at list — no discount required.
- Meets the 1% rule at list price ($1k rent vs $35k).
- Cap rate 38.0% vs local median 3.6% in Lexington — top-decile yield for the area; either an underpriced asset or a hidden risk that comps aren't pricing in. Stress-test before assuming the spread holds.
Location & tenants
- Location reads 74/100 on livability (#112 in NE, #4,483 nationally) — a middle-class / working-renter tenant base. Strengths: cost of living A+, housing A+, health & safety A+; Watch: employment C-, amenities F, commute F.
- Lexington Public Schools (town): math 31% / reading 31% proficiency, ranked #106 of 111 in NE (top 96%) — families likely to look elsewhere, expect single-tenant / working-renter base with shorter leases; 65% free/reduced lunch — lower-income household profile, screen leases tightly.
- Zoned schools: Morton Elementary School (360 students, 82% FRL); Lexington Middle School (math 35% / reading 34%, grade F, #104 of 128 statewide, top 82%, 685 students, 73% FRL); Lexington High School (math 29% / reading 32%, grade F, #232 of 261 statewide, top 89%, 913 students, 71% FRL).
- Market conditions: 57 active listings in the ZIP; 1 comparable units currently listed for rent nearby; 61 units permitted in Dawson County in 2024 (36 in 5+ unit buildings).
Forward outlook
- Local home prices are declining (-3.0%/yr); year-one equity from $242 of loan paydown is wiped out by about $1k of value loss. Plan a longer hold.
- Dawson County population projected to shrink 8% by 2050 — rents likely to lag national; underwrite the cash flow, not the appreciation.
- At projected returns (-3.0% appreciation + 3.0% rent growth), your $10k cash investment doubles in ~2 years — after that, you're playing with house money.
Negotiation context
- Only 6 days on market — expect competitive offers; lowballing is unlikely to land.
Risks & watch-outs
- Watch-outs: flood insurance adds $427/mo.
- Climate carrying-cost: in FEMA flood zone AE (mandatory federal flood insurance) — expect insurance premiums to compound above CPI over the hold.
Questions for the listing agent
- Built in 1974 — when were the roof, HVAC, electrical panel, plumbing, and water heater last replaced?
- What's the actual annual flood-insurance premium (NFIP or private), and is the property in a SFHA with mandatory coverage?
- Is there a deadline driving the sale (1031 exchange, divorce, estate, relocation)? That informs how much negotiation room exists.
- Schools are F-rated, which usually means shorter tenancies and higher turnover. Who's the typical renter profile here, and what's been the actual vacancy rate?
- The area grade is low — what's the realistic commute time and amenity access for the typical tenant pool here? Any planned neighborhood developments (good or bad) we should know about?
- What's the average days-on-market for RENTAL listings here right now (not sales)? A rising rental-DOM trend means longer vacancies and softer asking-rent achievability than the comps imply.
- What's the recent tenant-quality profile in this submarket — average credit score on applications, eviction rate, late-payment / NSF rate, and stable-employment percentage? A property-management company in the area should have these aggregated.
- How much new for-sale + rental construction is in the pipeline within 1–3 miles? Heavy new supply typically softens prices + rents 12–24 months out; constrained supply supports both.
Investment metrics
- 1% rule
- 4.22% ✓
- Cap rate
- 37.98%
- Cash-on-cash
- 113.17%
- DSCR
- 6.04
- GRM
- 2.0
CMA / ARV
No comps found within radius.
Projected returns pro-forma
-3.0% appreciation · 3.0% rent growth · sell at horizon
- IRR
- 60.1%
- Equity multiple
- 3.68×
- Total profit
- $26,313
- Equity at exit
- $5,219
- IRR
- 64.9%
- Equity multiple
- 7.62×
- Total profit
- $64,887
- Equity at exit
- $3,026
Cash invested: $9,800 (down + closing). Projections, not guarantees.
Landlord ↔ Tenant lean methodology
- Overall (STATE)
- 83 Strongly Landlord-Friendly
- State Nebraska
- 83 Strongly Landlord-Friendly · R+13
- County
- — inherits STATE
- City
- — inherits STATE
ZIP-level market 68850
- Home prices YoY
- -29.8%
- Active inventory
- 57
- Price-to-rent
- 2.0×
Monthly cashflow live
- Estimated rent
- $1,476 medium interval (Pro) →
- Mortgage (P&I)
- −$184
- Tax est. 1.5%
- −$44 /mo · $525/yr
- Insurance
- −$15
- Flood insurance flood zone
- −$427 /mo · $5,118/yr
- HOA
- −$0
- Vacancy / Maint / Mgmt
- −$310
- Net cashflow
- $498
Break-even live
UW: 25.0% down · 7.5% · 30yr · 1.5% tax · 5.0% vac · 8.0% maint · 8.0% mgmt
Financing live
Cash to close
- Down payment
- $8,750
- Closing costs
- $1,050
- Reserves months
- —
- Total cash needed
- —
Loan-product check · same deal, 3 products live
Conventional
25% down · 7.5% · 30yr
- Down + closing
- —
- Monthly P&I
- —
- Monthly cashflow
- —
- DSCR
- —
- Eligible?
- —
Personal DTI + credit; lowest rate.
DSCR
20% down · 8.5% · 30yr
- Down + closing
- —
- Monthly P&I
- —
- Monthly cashflow
- —
- DSCR
- —
- Eligible?
- —
No personal income docs; deal must DSCR.
Hard money
10% down · 12.0% · 12mo
- Down + closing
- —
- Monthly P&I
- —
- Monthly cashflow
- —
- DSCR
- —
- Eligible?
- —
Short-term bridge; refi at stabilization.
Rent comps 1 comps
| Address | Beds | Baths | Sqft | Rent | $/sqft | DOM | Units | Dist |
|---|---|---|---|---|---|---|---|---|
| 300 Cutler Dr Lexington, NE | 1.0–3.0 | 1.0–2.0 | 1015 | $1,650 | $1.62 | 43d | 29 | 1.49mi |
Listing history 7 events
-
2026-06-19days on market $35,000 Active 6 DOM
-
2026-06-18statusdays on market $35,000 Active 5 DOM
-
2026-06-17days on market $35,000 New 4 DOM
-
2026-06-16days on market $35,000 New 3 DOM
-
2026-06-15days on market $35,000 New 2 DOM
-
2026-06-14remarks 211-char remark
-
2026-06-14$35,000 New 1 DOM
ⓘ Source: listings_history table (triggers on properties + properties_extension) + one-shot
backfill from property_details.listing_events for pre-trigger history.
Climate risk First Street
- Flood 1/10 Low FEMA zone AE · 0% chance over 30 yrs
- Wildfire 2/10 Low
- Heat 3/10 Moderate 7 d/yr ≥98°F today · 17 d/yr by 30 yrs out
- Wind 2/10 Low
- Air quality 1/10 Low 0 unhealthy d/yr today · 0 by 30 yrs out
Nearby sold comps map
Loading sold comps map…
Walkable amenities ~0.75 mi
Loading nearby amenities…
Taxation est. · year 1
- Rental income
- $17,713
- − Mortgage interest
- −$1,961
- − Property taxes
- −$525
- − Insurance
- −$5,294
- − Repairs & maintenance
- −$1,417
- − Management
- −$1,417
- − Depreciation
- −$1,018
- Taxable income
- $6,082
- Est. tax owed @ 24.0%
- −$1,460
- After-tax cash flow
- $4,513/yr
For passive investors: Depreciation is non-cash, so a rental often shows a tax loss while cash-flowing — sheltering income. Rental losses are passive: they offset passive income freely, and up to $25,000/yr can offset ordinary (W-2) income if you actively participate and your MAGI is under $100k (phasing out to $0 by $150k); unused losses carry forward. On sale, claimed depreciation is recaptured at up to 25%, and gains may owe capital-gains tax (a 1031 exchange can defer both). Figures are a year-1 estimate at your 24.0% rate — not tax advice; consult a CPA.
Schools (NCES district)
- District
- Lexington Public Schools
- NCES district ID
- 3172810
- Math proficiency
- 31% ▼ -8.00%
- Reading proficiency
- 31% ▼ -7.00%
- Median HH income
- $44,799
- Composite
- 26.54/100
- National rank
- #7195
- State rank
- #106 of 111 in NE
Livability — Lexington
- Score
- 74/100
- State rank
- #112
- US rank
- #4483
Category grades
Schools grade is shown separately in the Schools card above.
Census & demographics
- County
- Dawson County · 12,428 people
- City population
- 12,428
- Metro
- Lexington, NE
- Population (ZIP)
- 12,428
- Household income
- $69,238
- Rent vs Own
- Severe rent burden
- 199.0
Population outlook (Dawson County) Hauer SSP2
- Today (2025)
- 23,318 people
- By 2030
- 22,912 · -1.7%
- By 2040
- 22,097 · -5.2%
- By 2050
- 21,358 · -8.4%
- By 2075
- 19,801 · -15.1%
- By 2100
- 17,647 · -24.3%
Race, ethnicity, and origin ACS 2023
- Neighborhood character
- Majority Hispanic (62%)
- Race & ethnicity
- Hispanic / Latino 62% White 23% Two or more races 18% Black 11%
- Hispanic origin (detail)
- Mexican 29% Cuban 2%
- Common ancestry
- Iranian 1%
- Foreign-born
- 39% · Canada
- Languages at home
- 35% English-only · Spanish 56% Arabic 1%
Political lean MEDSL · Dawson
- 2024 margin
- Solid R (+49.6) · D 24.7% · R 74.3%
- 2008→2024 swing
- -11.3pp toward R · 2008: -38.3pp · 2024: -49.6pp
- All cycles
- 2024: R+49.6 2020: R+43.8 2016: R+45.0 2012: R+41.8 2008: R+38.3
Not yet ingested
- Civics
- —
Market trends
- HPI YoY
- ▼ -98.28%
- Current HPI
- 231.9947
- Rent YoY
- —
- Metro
- Lexington, NE
- State GDP YoY
- ▲ 0.68%
- F500 in state
- 2
Industry mix (Fortune 500 HQ in NE)
| Industry | F500 HQs | Revenue |
|---|---|---|
| Conglomerate | 1 | $371B |
|
||
Price history
1 event — show timeline
- 2026-06-08 Listed $35,000 GPRMLS
Property tax history
-1.2%/yrLatest (2025): $14 · -0.3% YoY. Source: county tax records.
Cash-flow waterfall
monthlySold comps — $/sqft
last 12 mo · ≤1 miLoading sold comps…