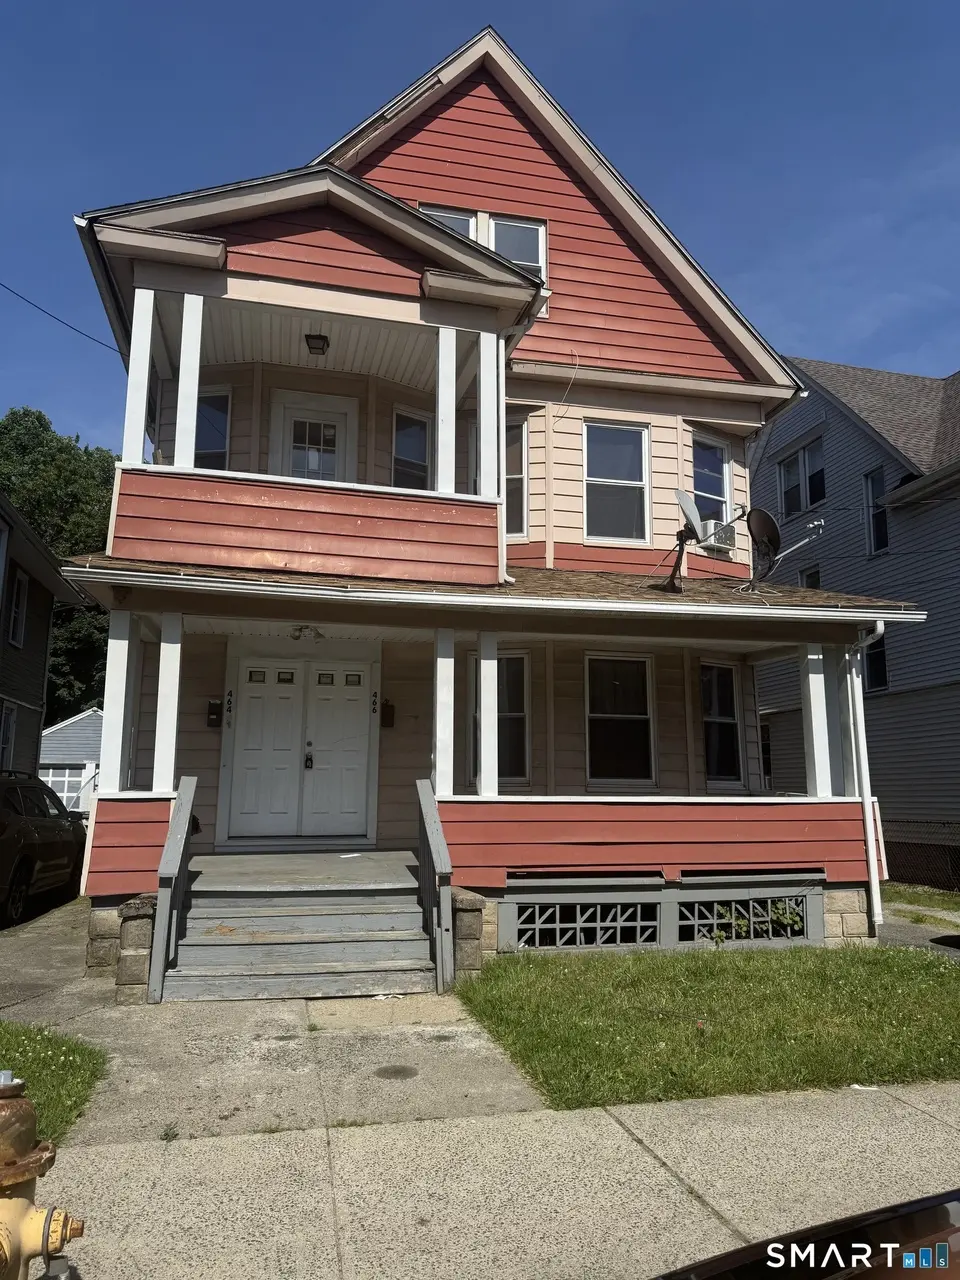
464-466 Wilmot Ave
Bridgeport, CT 06607
$600,000D+
8 bd · 3.0 ba ·
3,328 sqft ·
Built 1917
· MultiFamily
· Active
· 17 DOM
Cashflow @ list (25.0% down · 7.5%)
Estimated rent
$4,913/mo
Mortgage (P&I)
−$3,146
Tax + insurance
−$1,000
HOA
−$0
Vac / Maint / Mgmt
−$1,032
Net cashflow
$-265/mo
Annual
$-3,182/yr
Cap rate
5.76%
Cash-on-cash
-1.89%
DSCR
0.92
1% rule
0.82%
Cash to close
$168,000
Investor read
- This is a 2 × 4-bed/1.5-bath units multifamily listed at $600k. Condition is rated good.
- At list price, monthly cash flow is $-265 ($-3k/yr) — negative. Per door: $-133/mo.
- To cash-flow at today's rent, offer at most $562k (6.4% below list).
- To meet the 1% rule (rent ≥ 1% of price), the offer needs to be $491k (18.1% below list).
- It's been on market 17 days — a 2% lower offer ($591k) is reasonable based on typical stale-listing flexibility.
- Recommended offer: $491k (18.1% below list) — sets the bar for 1% rule.
- In year one you build about $64k of equity ($4k loan paydown + $60k appreciation (10.0% local appreciation)).
- Location reads 81/100 on livability (#15 in CT, #1,374 nationally) — a professional / high-income tenant draw. Strengths: amenities A+, commute A+, health & safety A+; Watch: crime C-, employment D+, schools D-.
- Bridgeport School District (urban): math 9% / reading 19% proficiency, ranked #151 of 153 in CT (top 99%) — low school quality limits family demand, transient renter base, plan for 1-2y turnover; 97% free/reduced lunch — lower-income household profile, screen leases tightly.
- Watch-outs: built in 1917 — expect roof / HVAC / electrical / plumbing capex.
- Market conditions: 33 active listings in the ZIP; 852 units permitted in Greater Bridgeport Planning Region in 2024 (698 in 5+ unit buildings).
- By year 2, paydown + projected appreciation supports a ~$103k cash-out refi (75% LTV) — recoverable capital for the next deal without selling this one.
- Climate carrying-cost: major wind risk, 54% chance of damaging wind over 30y; extreme-heat days projected 7→16/yr by 2055 (HVAC capex compounding) — expect insurance premiums to compound above CPI over the hold.
- At $4,913/mo this rent would consume 118% of the median local household income ($50k/yr) (locally 534% of renters already pay >50% of income on rent) — very limited rent-growth headroom before tenants either downsize or default.
Questions for listing agent
- What do current leases actually rent for vs. the listed asking? Can we see a recent rent roll and the last 12 months of T-12 income?
- Can we see the unit-by-unit rent roll, current vacancy, and any below-market leases? What's the average tenancy length?
- What capital expenditures (roof, boiler, parking lot, exteriors) have been made in the last 5 years, and what's planned in the next 2?
- Built in 1917 — when were the roof, HVAC, electrical panel, plumbing, and water heater last replaced?
- Is there a deadline driving the sale (1031 exchange, divorce, estate, relocation)? That informs how much negotiation room exists.
- Schools are D-rated, which usually means shorter tenancies and higher turnover. Who's the typical renter profile here, and what's been the actual vacancy rate?
- The area grade is low — what's the realistic commute time and amenity access for the typical tenant pool here? Any planned neighborhood developments (good or bad) we should know about?
- What's the average days-on-market for RENTAL listings here right now (not sales)? A rising rental-DOM trend means longer vacancies and softer asking-rent achievability than the comps imply.
CashFlowRE · CFR-ZTXC303MKDYV3V
· Data 12 h ago
cashflowre.app · 2026-05-29