 Duplex
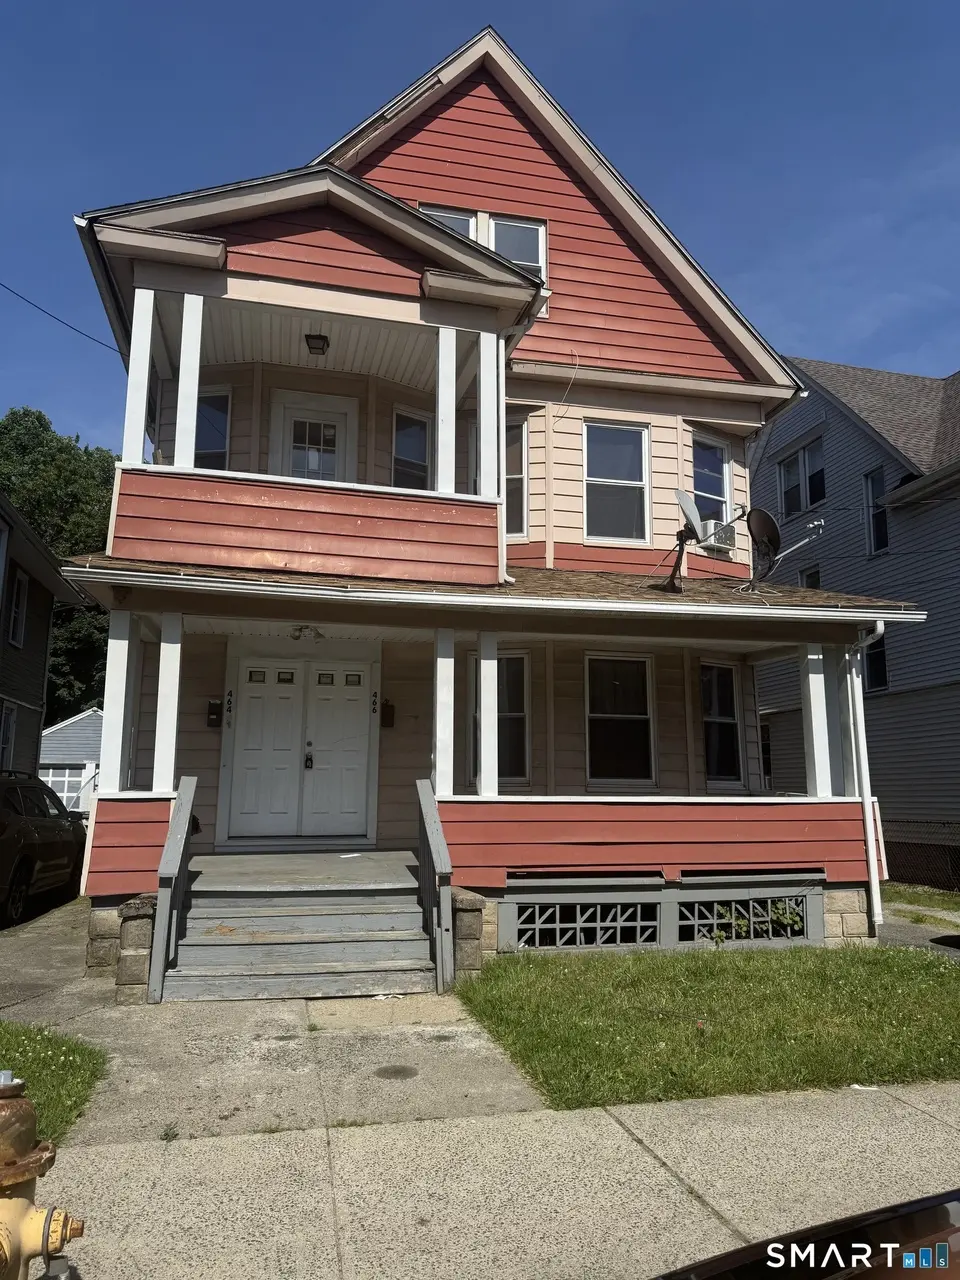
464-466 Wilmot Ave · Bridgeport, CT
Flood risk 1/10 · Minimal
- FEMA flood zone
- X (unshaded)
- Chance of flooding over 30 yrs
- 0.0%
- Est. flood insurance / yr
- $473 – $860
Fire risk 1/10 · Minimal
- Est. fire insurance / yr
- $829 – $1,539
Heat risk 6/10 · Moderate
- Hot days now (above 97°F)
- 7 days/yr
- Hot days in 30 yrs
- 16 days/yr
Wind risk 6/10 · Moderate
- Chance of severe wind over 30 yrs
- 54.0%
Air-quality risk 4/10 · Minor
- Unhealthy air days now
- 5 days/yr
- Unhealthy air days in 30 yrs
- 7 days/yr
Risk factors via First Street. Map © Google.
Why this score? — see what drove the D+ grade
The composite is a weighted blend of 9 inputs, each scored 0–100. Each bar is that input's sub-score; the figure is the points it added to the 100-point composite (weight × sub-score).
- Cash flow +10.9/30.0
- ARV discount +10.9/15.0
- Appreciation +10.0/10.0
- Livability +4.0/5.0
- Condition / age +3.8/5.0
- 1% rule +3.2/10.0
- DSCR +3.2/10.0
- Rent growth +2.5/5.0
- Schools +1.2/10.0
$600,000
🖨 Deal sheet (PDF) 📄 Offer letter ✓ Due diligence
Multi-family units
County records classify this as Multi-Family (2-4 Unit). Listing-text estimate: 2 units. confirmed
Listing remarks
Very nice over-sized remodeled two family with finish upper story for added potential. Off Street parking-turnkey, a must see!!!
Key facts
- Off street parking
- Over-sized remodeled
- Finish upper story
Tags
Property features AI
Finance
- Other: Living area reported as 3328
- Financial info: Offered as multi-family for sale
Exterior
- Parking: Off-street parking (driveway); 6 total parking spaces
- Utilities: Public water (in street); Public sewer (in street); Gas available in street
- Home design: Multi-family property (2-family); Red exterior color
- Construction: Frame construction; Block foundation; Asphalt shingle roof
- Exterior features: City views; Level lot; Aluminum siding; Asphalt driveway
Interior
- Bedrooms: 8 bedrooms
- Bathrooms: 3 full bathrooms
- Heating & cooling: Hot air heat; Gas heating supply in street
- Interior features: Full basement; Central air
- Laundry & utility: Laundry in basement; 30-gallon hot water tank
Neighborhood map
What this means for you Summary
Snapshot
- This is a 2 × 4-bed/1.5-bath units multifamily listed at $600k. Condition is rated good.
Deal economics
- At list price, monthly cash flow is $-265 ($-3k/yr) — negative. Per door: $-133/mo.
- To cash-flow at today's rent, offer at most $562k (6.4% below list).
- To meet the 1% rule (rent ≥ 1% of price), the offer needs to be $491k (18.1% below list).
- Recommended offer: $491k (18.1% below list) — sets the bar for 1% rule.
Location & tenants
- Location reads 81/100 on livability (#15 in CT, #1,374 nationally) — a professional / high-income tenant draw. Strengths: amenities A+, commute A+, health & safety A+; Watch: crime C-, employment D+, schools D-.
- Bridgeport School District (urban): math 9% / reading 19% proficiency, ranked #151 of 153 in CT (top 99%) — low school quality limits family demand, transient renter base, plan for 1-2y turnover; 97% free/reduced lunch — lower-income household profile, screen leases tightly.
- Market conditions: 33 active listings in the ZIP; 852 units permitted in Greater Bridgeport Planning Region in 2024 (698 in 5+ unit buildings).
- At $4,913/mo this rent would consume 118% of the median local household income ($50k/yr) (locally 534% of renters already pay >50% of income on rent) — very limited rent-growth headroom before tenants either downsize or default.
Forward outlook
- In year one you build about $64k of equity ($4k loan paydown + $60k appreciation (10.0% local appreciation)).
- By year 2, paydown + projected appreciation supports a ~$103k cash-out refi (75% LTV) — recoverable capital for the next deal without selling this one.
Negotiation context
- It's been on market 17 days — a 2% lower offer ($591k) is reasonable based on typical stale-listing flexibility.
Risks & watch-outs
- Watch-outs: built in 1917 — expect roof / HVAC / electrical / plumbing capex.
- Climate carrying-cost: major wind risk, 54% chance of damaging wind over 30y; extreme-heat days projected 7→16/yr by 2055 (HVAC capex compounding) — expect insurance premiums to compound above CPI over the hold.
Questions for the listing agent
- What do current leases actually rent for vs. the listed asking? Can we see a recent rent roll and the last 12 months of T-12 income?
- Can we see the unit-by-unit rent roll, current vacancy, and any below-market leases? What's the average tenancy length?
- What capital expenditures (roof, boiler, parking lot, exteriors) have been made in the last 5 years, and what's planned in the next 2?
- Built in 1917 — when were the roof, HVAC, electrical panel, plumbing, and water heater last replaced?
- Is there a deadline driving the sale (1031 exchange, divorce, estate, relocation)? That informs how much negotiation room exists.
- Schools are D-rated, which usually means shorter tenancies and higher turnover. Who's the typical renter profile here, and what's been the actual vacancy rate?
- The area grade is low — what's the realistic commute time and amenity access for the typical tenant pool here? Any planned neighborhood developments (good or bad) we should know about?
- What's the average days-on-market for RENTAL listings here right now (not sales)? A rising rental-DOM trend means longer vacancies and softer asking-rent achievability than the comps imply.
- What's the recent tenant-quality profile in this submarket — average credit score on applications, eviction rate, late-payment / NSF rate, and stable-employment percentage? A property-management company in the area should have these aggregated.
- How much new apartment / multifamily construction is in the pipeline within 1–3 miles? Heavy new supply (>2% of stock underway) typically softens rents 12–24 months out; light construction supports rent growth.
Investment metrics
- 1% rule
- 0.82% ✗
- Cap rate
- 5.76%
- Cash-on-cash
- -1.89%
- DSCR
- 0.92
- GRM
- 10.2
CMA / ARV
- ARV (on-the-fly)
- $648,960
- Comps found
- 9
Show comp detail 9 sales within ~0.75 mi
| Address | Dist | Beds/Ba | Sqft | Sold | Price | $/sf | Match |
|---|---|---|---|---|---|---|---|
| 54 6th St | 0.27mi | 9/3.0 (+1) | 3,390 (+2%) | 5mo | $750,000 | $221 | 75 |
| 565 Carroll Ave | 0.08mi | 8/3.0 | 3,078 (-8%) | 12mo | $600,000 | $195 | 74 |
| 351 Wilmot Ave | 0.11mi | 8/3.0 | 3,126 (-6%) | 16mo | $630,000 | $202 | 72 |
| 912 Connecticut Ave | 0.11mi | 8/3.0 | 3,588 (+8%) | 15mo | $450,000 | $125 | 70 |
| 287 Davenport St | 0.18mi | 7/3.0 (-1) | 3,201 (-4%) | 14mo | $651,000 | $203 | 68 |
| 334 Carroll Ave | 0.21mi | 7/3.0 (-1) | 3,295 (-1%) | 23mo | $599,000 | $182 | 65 |
| 408 Union Ave | 0.20mi | 9/3.0 (+1) | 3,798 (+14%) | 7mo | $639,900 | $168 | 56 |
| 43 Pixlee Pl | 0.62mi | 8/3.0 | 3,132 (-6%) | 8mo | $633,000 | $202 | 55 |
| 198 Adams St | 0.71mi | 8/3.0 | 3,383 (+2%) | 12mo | $500,000 | $148 | 55 |
Match score weights: distance 35% · size 25% · config 20% · recency 20%. Top-matched comps best support the ARV.
Projected returns pro-forma
10.0% appreciation · 3.0% rent growth · sell at horizon
- IRR
- 22.9%
- Equity multiple
- 2.84×
- Total profit
- $309,960
- Equity at exit
- $540,528
- IRR
- 20.5%
- Equity multiple
- 6.51×
- Total profit
- $926,210
- Equity at exit
- $1,165,668
Cash invested: $168,000 (down + closing). Projections, not guarantees.
Landlord ↔ Tenant lean methodology
- Overall (STATE)
- 27 Tenant-Leaning
- State Connecticut
- 27 Tenant-Leaning · D+7
- County
- — inherits STATE
- City
- — inherits STATE
ZIP-level market 06607
- Home prices YoY
- 4.7%
- Active inventory
- 33
- Price-to-rent
- 20.4×
Monthly cashflow live
- Estimated rent
- $4,913 high interval (Pro) →
- Mortgage (P&I)
- −$3,146
- Tax est. 1.5%
- −$750 /mo · $9,000/yr
- Insurance
- −$250
- HOA
- −$0
- Vacancy / Maint / Mgmt
- −$1,032
- Net cashflow
- $-265
Break-even live
Sensitivity live
| Price | -10% $149 | -5% $-58 | +0% $-265 | +5% $-473 | +10% $-680 |
|---|---|---|---|---|---|
| Rent | -10% $-653 | -5% $-459 | +0% $-265 | +5% $-71 | +10% $123 |
| Rate | -1.0pp $37 | -0.5pp $-113 | base $-265 | +0.5pp $-421 | +1.0pp $-579 |
2-unit breakdown (identical units grouped — click to expand)
| Units | Beds | Baths | Est. rent |
|---|---|---|---|
| 2× units | 4 | 1.5 | $4,914 |
| #1 | 4 | 1.5 | $2,457 |
| #2 | 4 | 1.5 | $2,457 |
| Total (2 units) | $4,913 | ||
UW: 25.0% down · 7.5% · 30yr · 1.5% tax · 5.0% vac · 8.0% maint · 8.0% mgmt
Financing live
Cash to close
- Down payment
- $150,000
- Closing costs
- $18,000
- Reserves months
- —
- Total cash needed
- —
Loan-product check · same deal, 3 products live
Conventional
25% down · 7.5% · 30yr
- Down + closing
- —
- Monthly P&I
- —
- Monthly cashflow
- —
- DSCR
- —
- Eligible?
- —
Personal DTI + credit; lowest rate.
DSCR
20% down · 8.5% · 30yr
- Down + closing
- —
- Monthly P&I
- —
- Monthly cashflow
- —
- DSCR
- —
- Eligible?
- —
No personal income docs; deal must DSCR.
Hard money
10% down · 12.0% · 12mo
- Down + closing
- —
- Monthly P&I
- —
- Monthly cashflow
- —
- DSCR
- —
- Eligible?
- —
Short-term bridge; refi at stabilization.
Listing history 12 events
-
2026-06-22days on market $600,000 Active 17 DOM
-
2026-06-18days on market $600,000 Active 14 DOM
-
2026-06-17days on market $600,000 Active 13 DOM
-
2026-06-16days on market $600,000 Active 12 DOM
-
2026-06-15days on market $600,000 Active 11 DOM
-
2026-06-13days on market $600,000 Active 9 DOM
-
2026-06-13days on market $600,000 Active 8 DOM
-
2026-06-10days on market $600,000 Active 6 DOM
-
2026-06-09days on market $600,000 Active 5 DOM
-
2026-06-08days on market $600,000 Active 4 DOM
-
2026-06-07remarks 128-char remark
-
2026-06-07$600,000 Active 3 DOM
ⓘ Source: listings_history table (triggers on properties + properties_extension) + one-shot
backfill from property_details.listing_events for pre-trigger history.
Climate risk First Street
- Flood 1/10 Low FEMA zone X (unshaded) · 0% chance over 30 yrs
- Wildfire 1/10 Low
- Heat 6/10 Major 7 d/yr ≥97°F today · 16 d/yr by 30 yrs out
- Wind 6/10 Major 54% chance of damaging wind over 30 yrs
- Air quality 4/10 Moderate 5 unhealthy d/yr today · 7 by 30 yrs out
Nearby sold comps map
Loading sold comps map…
Walkable amenities ~0.75 mi
Loading nearby amenities…
Taxation est. · year 1
- Rental income
- $58,956
- − Mortgage interest
- −$33,609
- − Property taxes
- −$9,000
- − Insurance
- −$3,000
- − Repairs & maintenance
- −$4,716
- − Management
- −$4,716
- − Depreciation
- −$17,455
- Taxable loss
- −$13,541
- Est. tax savings @ 24.0%
- +$3,250
- After-tax cash flow
- $67/yr
For passive investors: Depreciation is non-cash, so a rental often shows a tax loss while cash-flowing — sheltering income. Rental losses are passive: they offset passive income freely, and up to $25,000/yr can offset ordinary (W-2) income if you actively participate and your MAGI is under $100k (phasing out to $0 by $150k); unused losses carry forward. On sale, claimed depreciation is recaptured at up to 25%, and gains may owe capital-gains tax (a 1031 exchange can defer both). Figures are a year-1 estimate at your 24.0% rate — not tax advice; consult a CPA.
Condition & rehab AI · 11 photos
This remodeled two-family home is in good condition with cosmetic updates, offering a great opportunity for investment with potential for increased resale and rental value.
Value-add opportunities
- Resale Paint the exterior siding — A fresh coat of paint can significantly enhance the curb appeal and resale value of the property.
- Both Replace the HVAC system — A new HVAC system can improve comfort and energy efficiency, benefiting both resale and rental value.
Renovation cost estimate screening
Value-add ROI direction
- Resale Paint the exterior siding — A fresh coat of paint can significantly enhance the curb appeal and resale value of the property. ↑
- Both Replace the HVAC system — A new HVAC system can improve comfort and energy efficiency, benefiting both resale and rental value. ↑
ⓘ Cost ranges are severity-bucket heuristics (US national rule-of-thumb). Get contractor quotes + a written scope before underwriting a rehab budget.
Schools (NCES district)
- District
- Bridgeport School District
- NCES district ID
- 0900450
- Math proficiency
- 9% ▼ -7.00%
- Reading proficiency
- 19% ▼ -10.00%
- Median HH income
- $41,507
- Composite
- 12.09/100
- National rank
- #9656
- State rank
- #151 of 153 in CT
Livability — Bridgeport
- Score
- 81/100
- State rank
- #15
- US rank
- #1374
Category grades
Schools grade is shown separately in the Schools card above.
Census & demographics
- Census place
- Bridgeport, CT
- County
- Fairfield County · 765,532 people
- City population
- 149,153
- Metro
- Bridgeport-Stamford-Norwalk, CT
- Population (ZIP)
- 7,979
- Household income
- $50,000
- Rent vs Own
- Severe rent burden
- 534.0
Population outlook (Greater Bridgeport County) Hauer SSP2
- By 2040
- 365,581
Race, ethnicity, and origin ACS 2023
- Neighborhood character
- Diverse neighborhood (Simpson 0.58)
- Race & ethnicity
- Hispanic / Latino 57% Black 31% Two or more races 19% Asian 6% White 3%
- Hispanic origin (detail)
- Mexican 2% Puerto Rican 32% Cuban 4% Dominican 4%
- Common ancestry
- Estonian 1% Russian 1%
- Foreign-born
- 25% · Canada, Vietnam, Jamaica
- Languages at home
- 52% English-only · Spanish 42% Other Asian/Pacific 2% Other Indo-European 2%
Political lean MEDSL · Greater Bridgeport
- 2024 margin
- Strong D (+23.3) · D 60.9% · R 37.6% · Other 1.5%
- All cycles
- 2024: D+23.3
Not yet ingested
- Civics
- —
Market trends
- HPI YoY
- ▲ 26.05%
- Current HPI
- 584.8108
- Rent YoY
- —
- Metro
- Bridgeport-Stamford-Norwalk, CT
- State GDP YoY
- ▲ 1.06%
- F500 in state
- 38
Industry mix (Fortune 500 HQ in CT)
| Industry | F500 HQs | Revenue |
|---|---|---|
| Industrial Machinery | 4 | $38B |
|
||
| Insurance | 3 | $71B |
|
||
| Financial Services | 2 | $25B |
|
||
| Transportation / Logistics | 2 | $18B |
|
||
| Healthcare | 1 | $247B |
|
||
| Telecommunications | 1 | $55B |
|
||
Price history
1 event — show timeline
- 2026-06-04 Listed $600,000 Smart MLS
Cash-flow waterfall
monthlySold comps — $/sqft
last 12 mo · ≤1 miLoading sold comps…