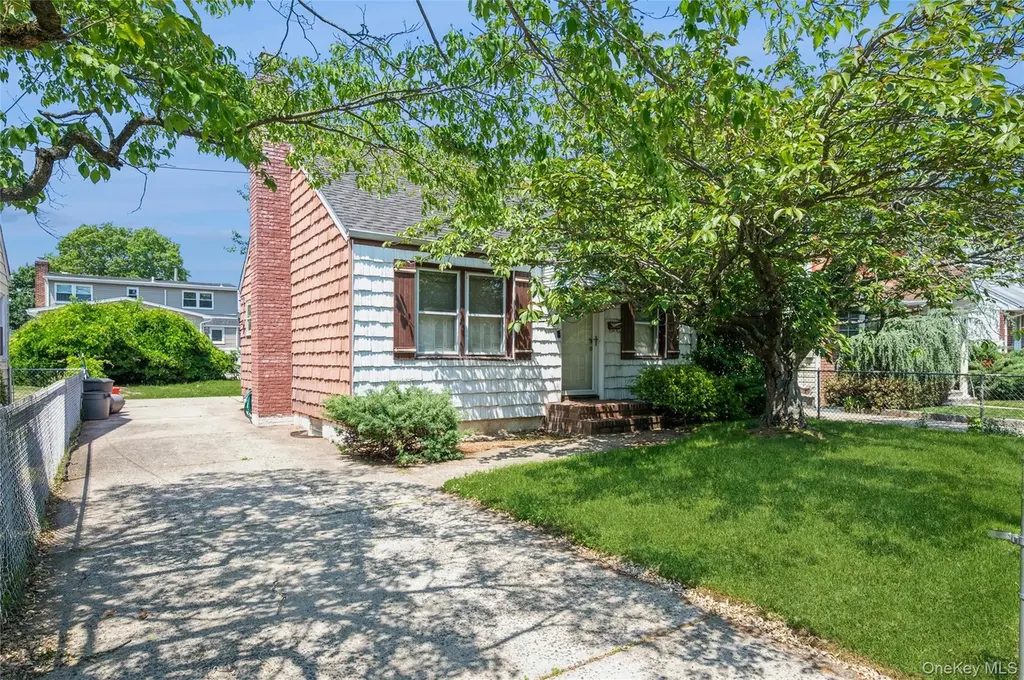
288 Semton Blvd
Franklin Square, NY 11010
$599,000B-
4 bd · 1.0 ba ·
974 sqft ·
Built 1948
· SingleFamily
· Pending
· 25 DOM
Cashflow @ list (25.0% down · 7.5%)
Estimated rent
$6,776/mo
Mortgage (P&I)
−$3,141
Tax + insurance
−$1,036
HOA
−$0
Vac / Maint / Mgmt
−$1,423
Net cashflow
$1,176/mo
Annual
$14,115/yr
Cap rate
8.65%
Cash-on-cash
8.42%
DSCR
1.37
1% rule
1.13%
Cash to close
$167,720
Investor read
- This is a 4-bed/1.0-bath single-family listed at $599k.
- At list price, monthly cash flow is $1k ($14k/yr) — positive.
- The deal already cash-flows at list — no discount required.
- Meets the 1% rule at list price ($7k rent vs $599k).
- It's been on market 25 days — a 2% lower offer ($590k) is reasonable based on typical stale-listing flexibility.
- Recommended offer: $590k (1.5% below list) — sets the bar for market timing.
- Local home prices are declining (-3.0%/yr); year-one equity from $4k of loan paydown is wiped out by about $18k of value loss. Plan a longer hold.
- Location reads 85/100 on livability (#32 in NY, #528 nationally) — a professional / high-income tenant draw. Strengths: amenities A+, commute A+, employment A+; Watch: cost of living F.
- Sewanhaka Central High School District (suburban): math 76% / reading 83% proficiency, ranked #43 of 590 in NY (top 7%) — strong family-tenant draw, lease renewals of 3-5y typical; only 19% free/reduced lunch — higher-income household profile.
- Zoned schools: H Frank Carey High School (math 75% / reading 84%, grade A-, #518 of 1,100 statewide, top 51%, 1,596 students, 21% FRL) — zoned schools at 21% FRL track the district average.
- Watch-outs: built in 1948 — expect roof / HVAC / electrical / plumbing capex.
- Market conditions: 79 active listings in the ZIP; 1 comparable units currently listed for rent nearby; 824 units permitted in Nassau County in 2024 (153 in 5+ unit buildings).
- Nassau County population projected at +7% by 2050 — modest demand growth; plan on rents tracking national, not racing it.
- Climate carrying-cost: major flood risk; major wind risk, 54% chance of damaging wind over 30y; extreme-heat days projected 7→16/yr by 2055 (HVAC capex compounding) — expect insurance premiums to compound above CPI over the hold.
- Cap rate 8.6% vs local median 3.3% in Franklin Square — top-decile yield for the area; either an underpriced asset or a hidden risk that comps aren't pricing in. Stress-test before assuming the spread holds.
Questions for listing agent
- Built in 1948 — when were the roof, HVAC, electrical panel, plumbing, and water heater last replaced?
- Is there a deadline driving the sale (1031 exchange, divorce, estate, relocation)? That informs how much negotiation room exists.
- Schools are B-rated — typically a magnet for longer-tenancy family renters. What's the average tenant stay here, and is there a school-zone premium baked into asking?
- What's the average days-on-market for RENTAL listings here right now (not sales)? A rising rental-DOM trend means longer vacancies and softer asking-rent achievability than the comps imply.
- What's the recent tenant-quality profile in this submarket — average credit score on applications, eviction rate, late-payment / NSF rate, and stable-employment percentage? A property-management company in the area should have these aggregated.
- How much new for-sale + rental construction is in the pipeline within 1–3 miles? Heavy new supply typically softens prices + rents 12–24 months out; constrained supply supports both.
CashFlowRE · CFR-ZV8DYGEQSJNABG
· Data 1 week ago
cashflowre.app · 2026-05-29