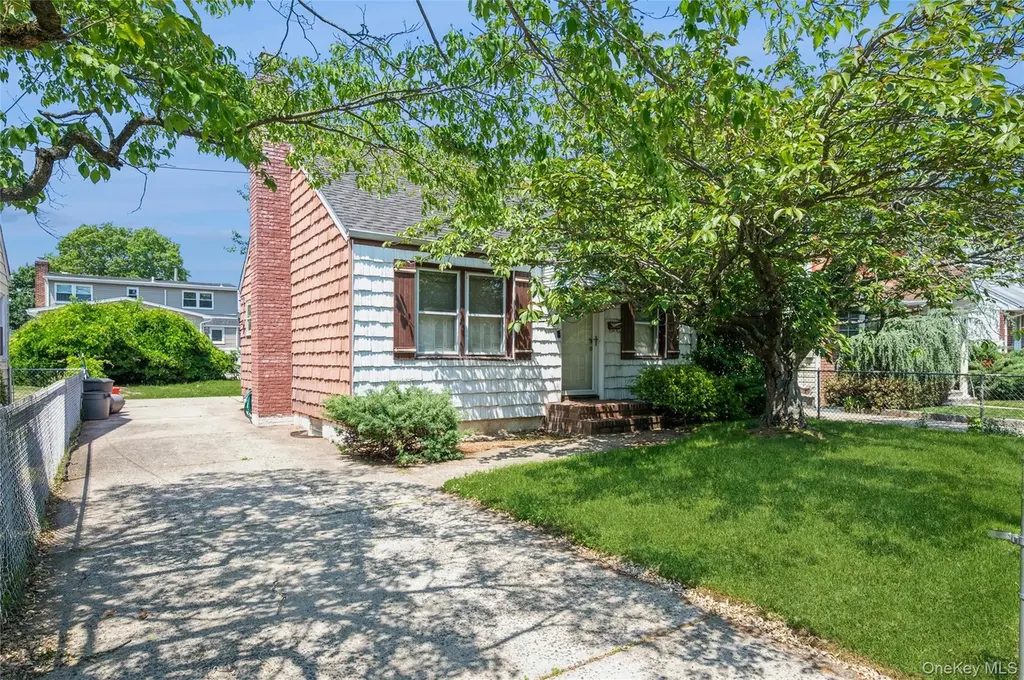
288 Semton Blvd · Franklin Square, NY
Flood risk 6/10 · Moderate
- FEMA flood zone
- X (unshaded)
- Chance of flooding over 30 yrs
- 0.7%
- Est. flood insurance / yr
- $473 – $860
Fire risk 1/10 · Minimal
- Est. fire insurance / yr
- $691 – $1,283
Heat risk 6/10 · Moderate
- Hot days now (above 97°F)
- 7 days/yr
- Hot days in 30 yrs
- 16 days/yr
Wind risk 6/10 · Moderate
- Chance of severe wind over 30 yrs
- 54.0%
Air-quality risk 3/10 · Minor
- Unhealthy air days now
- 4 days/yr
- Unhealthy air days in 30 yrs
- 4 days/yr
Risk factors via First Street. Map © Google.
Why this score? — see what drove the C grade
The composite is a weighted blend of 9 inputs, each scored 0–100. Each bar is that input's sub-score; the figure is the points it added to the 100-point composite (weight × sub-score).
- Cash flow +19.3/30.0
- ARV discount +11.7/15.0
- Schools +7.2/10.0
- DSCR +6.1/10.0
- 1% rule +5.2/10.0
- Livability +4.2/5.0
- Rent growth +2.5/5.0
- Condition / age +2.5/5.0
- Appreciation +0.0/10.0
$599,000
🖨 Deal sheet (PDF) 📄 Offer letter ✓ Due diligence
Listing remarks
LOCATION. .. LOCATION. .. .LOCATION!!! Looking for a house in the sought after Franklin Square area. Look no further; 4 bedroom, 1 bath cape featuring a long driveway and fenced yard. Property requires updates and is being sold as-is, offering a fantastic opportunity for buyers or investors looking to customize and add value. Bring your vision and unlock the potential! Conveniently located to shopping, transportation and local amenities.
Key facts
- 4,000 sq ft lot
- Built 1948
- Listed 25 days
Property features AI
Exterior
- Parking: Driveway parking; Off-street parking; On-street parking; No carport
- Utilities: Public sewer; Cable available; Electricity connected; Natural gas connected; Sewer connected
- Home design: Single-family residence; Living area listed from public records
- Construction: Shake siding construction
- Exterior features: Shake siding; Not waterfront; No additional parcels
Interior
- Kitchen: Other appliances
- Bedrooms: Bedroom on the first floor
- Bathrooms: 1 full bathroom
- Heating & cooling: Natural gas heating; No central cooling
- Interior features: First-floor bedroom; First-floor full bathroom; Full basement; Partial attic; 5 total rooms
- Laundry & utility: Utilities connected: electricity, natural gas, sewer
Neighborhood map
What this means for you Summary
Snapshot
- This is a 4-bed/1.0-bath single-family listed at $599k.
Deal economics
- At list price, monthly cash flow is $661 ($8k/yr) — positive.
- The deal already cash-flows at list — no discount required.
- Meets the 1% rule at list price ($6k rent vs $599k).
- Recommended offer: $590k (1.5% below list) — sets the bar for market timing.
- Cap rate 7.6% vs local median 3.3% in Franklin Square — top-decile yield for the area; either an underpriced asset or a hidden risk that comps aren't pricing in. Stress-test before assuming the spread holds.
Location & tenants
- Location reads 85/100 on livability (#32 in NY, #528 nationally) — a professional / high-income tenant draw. Strengths: amenities A+, commute A+, employment A+; Watch: cost of living F.
- Sewanhaka Central High School District (suburban): math 76% / reading 83% proficiency, ranked #43 of 590 in NY (top 7%) — strong family-tenant draw, lease renewals of 3-5y typical; only 19% free/reduced lunch — higher-income household profile.
- Zoned schools: H Frank Carey High School (math 75% / reading 84%, grade A-, #518 of 1,100 statewide, top 51%, 1,596 students, 21% FRL) — zoned schools at 21% FRL track the district average.
- Market conditions: 78 active listings in the ZIP; 2 comparable units currently listed for rent nearby; 824 units permitted in Nassau County in 2024 (153 in 5+ unit buildings).
Forward outlook
- Local home prices are declining (-3.0%/yr); year-one equity from $4k of loan paydown is wiped out by about $18k of value loss. Plan a longer hold.
- Nassau County population projected at +7% by 2050 — modest demand growth; plan on rents tracking national, not racing it.
Negotiation context
- It's been on market 25 days — a 2% lower offer ($590k) is reasonable based on typical stale-listing flexibility.
Risks & watch-outs
- Watch-outs: built in 1948 — expect roof / HVAC / electrical / plumbing capex.
- Climate carrying-cost: major flood risk; major wind risk, 54% chance of damaging wind over 30y; extreme-heat days projected 7→16/yr by 2055 (HVAC capex compounding) — expect insurance premiums to compound above CPI over the hold.
Questions for the listing agent
- Built in 1948 — when were the roof, HVAC, electrical panel, plumbing, and water heater last replaced?
- Is there a deadline driving the sale (1031 exchange, divorce, estate, relocation)? That informs how much negotiation room exists.
- Schools are B-rated — typically a magnet for longer-tenancy family renters. What's the average tenant stay here, and is there a school-zone premium baked into asking?
- What's the average days-on-market for RENTAL listings here right now (not sales)? A rising rental-DOM trend means longer vacancies and softer asking-rent achievability than the comps imply.
- What's the recent tenant-quality profile in this submarket — average credit score on applications, eviction rate, late-payment / NSF rate, and stable-employment percentage? A property-management company in the area should have these aggregated.
- How much new for-sale + rental construction is in the pipeline within 1–3 miles? Heavy new supply typically softens prices + rents 12–24 months out; constrained supply supports both.
Investment metrics
- 1% rule
- 1.02% ✓
- Cap rate
- 7.62%
- Cash-on-cash
- 4.73%
- DSCR
- 1.21
- GRM
- 8.2
CMA / ARV
- ARV (on-the-fly)
- $661,346
- Comps found
- 4
Show comp detail 4 sales within ~0.75 mi
| Address | Dist | Beds/Ba | Sqft | Sold | Price | $/sf | Match |
|---|---|---|---|---|---|---|---|
| 232 Ribbon St | 0.15mi | 3/1.0 (-1) | 1,109 (+14%) | 1mo | $746,000 | $673 | 64 |
| 51 Poppy Ave | 0.63mi | 3/1.0 (-1) | 1,020 (+5%) | 12mo | $693,000 | $679 | 48 |
| 707 Benris Ave | 0.32mi | 3/2.0 (-1) | 1,101 (+13%) | 8mo | $775,000 | $704 | 47 |
| 1022 Jackson Ave | 0.75mi | 4/2.0 | 1,079 (+11%) | 5mo | $690,000 | $639 | 39 |
Match score weights: distance 35% · size 25% · config 20% · recency 20%. Top-matched comps best support the ARV.
Projected returns pro-forma
-3.0% appreciation · 3.0% rent growth · sell at horizon
- IRR
- -8.9%
- Equity multiple
- 0.67×
- Total profit
- $-54,852
- Equity at exit
- $89,313
- IRR
- 0.6%
- Equity multiple
- 1.04×
- Total profit
- $6,910
- Equity at exit
- $51,791
Cash invested: $167,720 (down + closing). Projections, not guarantees.
Landlord ↔ Tenant lean methodology
- Overall (STATE)
- 15 Strongly Tenant-Friendly
- State New York
- 15 Strongly Tenant-Friendly · D+10
- County
- — inherits STATE
- City
- — inherits STATE
ZIP-level market 11010
- Active inventory
- 78
- Price-to-rent
- 8.2×
Monthly cashflow live
- Estimated rent
- $6,124 medium interval (Pro) →
- Mortgage (P&I)
- −$3,141
- Tax from tax record
- −$786 /mo · $9,432/yr
- Insurance
- −$250
- HOA
- −$0
- Vacancy / Maint / Mgmt
- −$1,286
- Net cashflow
- $661
Break-even live
Sensitivity live
| Price | -10% $1,000 | -5% $830 | +0% $661 | +5% $491 | +10% $322 |
|---|---|---|---|---|---|
| Rent | -10% $177 | -5% $419 | +0% $661 | +5% $903 | +10% $1,145 |
| Rate | -1.0pp $963 | -0.5pp $813 | base $661 | +0.5pp $506 | +1.0pp $348 |
UW: 25.0% down · 7.5% · 30yr · 1.5% tax · 5.0% vac · 8.0% maint · 8.0% mgmt
Financing live
Cash to close
- Down payment
- $149,750
- Closing costs
- $17,970
- Reserves months
- —
- Total cash needed
- —
Loan-product check · same deal, 3 products live
Conventional
25% down · 7.5% · 30yr
- Down + closing
- —
- Monthly P&I
- —
- Monthly cashflow
- —
- DSCR
- —
- Eligible?
- —
Personal DTI + credit; lowest rate.
DSCR
20% down · 8.5% · 30yr
- Down + closing
- —
- Monthly P&I
- —
- Monthly cashflow
- —
- DSCR
- —
- Eligible?
- —
No personal income docs; deal must DSCR.
Hard money
10% down · 12.0% · 12mo
- Down + closing
- —
- Monthly P&I
- —
- Monthly cashflow
- —
- DSCR
- —
- Eligible?
- —
Short-term bridge; refi at stabilization.
Rent comps 2 comps
| Address | Beds | Baths | Sqft | Rent | $/sqft | DOM | Units | Dist |
|---|---|---|---|---|---|---|---|---|
| 111 Hempstead Tpke West Hempstead, NY | 3.0 | 1.0–2.5 | 1226 | $6,776 | $5.52 | 0d | 88 | 1.19mi |
| 130 Hempstead Ave West Hempstead, NY | 1.0–3.0 | 1.0–2.0 | 1113 | $5,521 | $4.96 | 0d | 6 | 1.22mi |
Listing history 13 events
-
2026-06-15statusdays on market $599,000 Pending 25 DOM
-
2026-06-13days on market $599,000 Active 24 DOM
-
2026-06-13days on market $599,000 Active 23 DOM
-
2026-06-09days on market $599,000 Active 20 DOM
-
2026-06-08days on market $599,000 Active 19 DOM
-
2026-06-07days on market $599,000 Active 18 DOM
-
2026-06-04days on market $599,000 Active 15 DOM
-
2026-06-03days on market $599,000 Active 14 DOM
-
2026-06-02days on market $599,000 Active 13 DOM
-
2026-06-01days on market $599,000 Active 12 DOM
-
2026-05-31days on market $599,000 Active 11 DOM
-
2026-05-21$599,000 Active
-
2026-05-19historical $599,000
ⓘ Source: listings_history table (triggers on properties + properties_extension) + one-shot
backfill from property_details.listing_events for pre-trigger history.
Tax reassessment forecast NY · Partial reset (capped growth)
- Current annual tax
- $9,432 · $786/mo
- Projected year-2 tax
- $9,778 · $815/mo
- Expected delta
- +$346/yr (+$29/mo · 3.7%)
ⓘ Screening estimate from a state-policy table — verify with the county assessor before closing.
Climate risk First Street
- Flood 6/10 Major FEMA zone X (unshaded) · 70% chance over 30 yrs
- Wildfire 1/10 Low
- Heat 6/10 Major 7 d/yr ≥97°F today · 16 d/yr by 30 yrs out
- Wind 6/10 Major 54% chance of damaging wind over 30 yrs
- Air quality 3/10 Moderate 4 unhealthy d/yr today · 4 by 30 yrs out
Nearby sold comps map
Loading sold comps map…
Walkable amenities ~0.75 mi
Loading nearby amenities…
Taxation est. · year 1
- Rental income
- $73,485
- − Mortgage interest
- −$33,553
- − Property taxes
- −$9,432
- − Insurance
- −$2,995
- − Repairs & maintenance
- −$5,879
- − Management
- −$5,879
- − Depreciation
- −$17,425
- Taxable loss
- −$1,678
- Est. tax savings @ 24.0%
- +$403
- After-tax cash flow
- $8,334/yr
For passive investors: Depreciation is non-cash, so a rental often shows a tax loss while cash-flowing — sheltering income. Rental losses are passive: they offset passive income freely, and up to $25,000/yr can offset ordinary (W-2) income if you actively participate and your MAGI is under $100k (phasing out to $0 by $150k); unused losses carry forward. On sale, claimed depreciation is recaptured at up to 25%, and gains may owe capital-gains tax (a 1031 exchange can defer both). Figures are a year-1 estimate at your 24.0% rate — not tax advice; consult a CPA.
Schools (NCES district)
- District
- Sewanhaka Central High School District
- NCES district ID
- 3626520
- Math proficiency
- 76% ▬ 0.00%
- Reading proficiency
- 83% ▲ 9.00%
- Median HH income
- $95,771
- Composite
- 71.6/100
- National rank
- #220
- State rank
- #43 of 590 in NY
Livability — Franklin Square
- Score
- 85/100
- State rank
- #32
- US rank
- #528
Category grades
Schools grade is shown separately in the Schools card above.
Census & demographics
- Census place
- Franklin Square, NY
- City population
- 25,618
- Population (ZIP)
- 25,618
Population outlook (Nassau County) Hauer SSP2
- Today (2025)
- 1,409,302 people
- By 2030
- 1,431,482 · +1.6%
- By 2040
- 1,471,607 · +4.4%
- By 2050
- 1,502,845 · +6.6%
- By 2075
- 1,575,403 · +11.8%
- By 2100
- 1,554,356 · +10.3%
Race, ethnicity, and origin ACS 2023
- Neighborhood character
- Diverse neighborhood (Simpson 0.56)
- Race & ethnicity
- White 63% Hispanic / Latino 17% Asian 12% Two or more races 8% Black 5%
- Hispanic origin (detail)
- Puerto Rican 4% Cuban 1% Dominican 2%
- Common ancestry
- Romanian 3% Scotch-Irish 2% Russian 1%
- Foreign-born
- 23% · Canada, China, South Korea
- Languages at home
- 69% English-only · Other Indo-European 12% Spanish 10% Russian/Polish/Slavic 2%
Political lean MEDSL · Nassau
- 2024 margin
- Toss-up / Even · D 47.9% · R 52.1%
- 2008→2024 swing
- -12.6pp toward R · 2008: 8.4pp · 2024: -4.2pp
- All cycles
- 2024: R+4.2 2020: D+9.5 2016: D+5.3 2012: D+6.7 2008: D+8.4
Not yet ingested
- Civics
- —
Market trends
- HPI YoY
- ▼ -655.81%
- Current HPI
- 312.4135
- Rent YoY
- —
- Metro
- —
- State GDP YoY
- ▲ 2.60%
- F500 in state
- 92
Industry mix (Fortune 500 HQ in NY)
| Industry | F500 HQs | Revenue |
|---|---|---|
| Financial Services | 10 | $950B |
|
||
| Consumer Goods | 9 | $162B |
|
||
| Insurance | 4 | $225B |
|
||
| Telecommunications | 2 | $144B |
|
||
| Pharmaceuticals | 2 | $112B |
|
||
| Media / Entertainment | 2 | $69B |
|
||
Price history
+0.0% since first listed2 events — show timeline
- 2026-05-21 Listed $599,000 OneKey® MLS as Distributed by MLS Grid
- 2026-05-19 Coming Soon $599,000 OneKey® MLS as Distributed by MLS Grid
Property tax history
+3.5%/yrLatest (2024): $9,432 · -4.1% YoY. Source: county tax records.
Cash-flow waterfall
monthlySold comps — $/sqft
last 12 mo · ≤1 miLoading sold comps…