3904 Monica Ln
Johnsburg, IL 60051
$313,440D
3 bd · 2.5 ba ·
1,785 sqft ·
Built 2025
· Townhouse
· Active
· 323 DOM
Cashflow @ list (25.0% down · 7.5%)
Estimated rent
$2,327/mo
Mortgage (P&I)
−$1,644
Tax + insurance
−$522
HOA
−$239
Vac / Maint / Mgmt
−$489
Net cashflow
$-566/mo
Annual
$-6,798/yr
Cap rate
4.12%
Cash-on-cash
-7.75%
DSCR
0.66
1% rule
0.74%
Cash to close
$87,763
Investor read
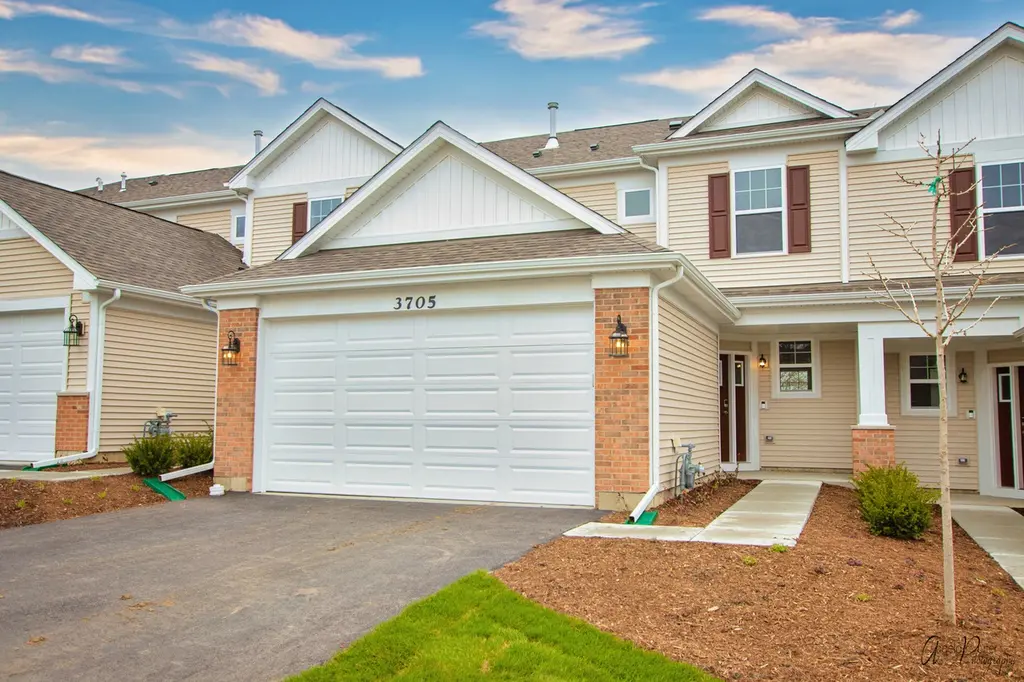
- This is a 3-bed/2.5-bath townhouse listed at $313k. Condition is rated good.
- At list price, monthly cash flow is $-566 ($-7k/yr) — negative.
- To cash-flow at today's rent, offer at most $231k (26.2% below list).
- To meet the 1% rule (rent ≥ 1% of price), the offer needs to be $233k (25.7% below list).
- It's been on market 323 days — a 12% lower offer ($276k) is reasonable based on typical stale-listing flexibility.
- Recommended offer: $231k (26.2% below list) — sets the bar for cash-flow.
- In year one you build about $34k of equity ($2k loan paydown + $31k appreciation (10.0% local appreciation)).
- Location reads 80/100 on livability (#111 in IL, #1,796 nationally) — a professional / high-income tenant draw. Strengths: crime A+, employment A+, housing A+; Watch: cost of living C-, amenities F, commute F.
- Johnsburg CUSD 12 (suburban): math 22% / reading 21% proficiency, ranked #321 of 620 in IL (top 52%) — low school quality limits family demand, transient renter base, plan for 1-2y turnover; only 19% free/reduced lunch — higher-income household profile.
- Zoned schools: Ringwood School Primary Ctr (433 students, 0% FRL); Johnsburg Jr High School (math 23% / reading 26%, grade F, #332 of 665 statewide, top 55%, 344 students, 0% FRL); Johnsburg High School (math 27% / reading 32%, grade F, #187 of 693 statewide, top 30%, 560 students, 0% FRL) — zoned schools average 0% FRL vs 19% district-wide (19 pts lower); this property's tenant base skews higher-income than the district average.
- Market conditions: 151 active listings in the ZIP; 3 comparable units currently listed for rent nearby; rentals leasing fast (median 1d on market — plan ~1-2 weeks tenant-placement turnaround); 1,595 units permitted in McHenry County in 2024 (485 in 5+ unit buildings).
- McHenry County population projected at -12% by 2050 — secular population decline; favor cash flow + early exit over multi-decade hold.
- By year 2, paydown + projected appreciation supports a ~$54k cash-out refi (75% LTV) — recoverable capital for the next deal without selling this one.
- Cap rate 4.1% vs local median 2.9% in Johnsburg — top-decile yield for the area; either an underpriced asset or a hidden risk that comps aren't pricing in. Stress-test before assuming the spread holds.
Questions for listing agent
- What do current leases actually rent for vs. the listed asking? Can we see a recent rent roll and the last 12 months of T-12 income?
- It's been on market 323 days. Have you received any prior offers? Is the seller open to a 26% concession, seller financing, or rate buy-down credit?
- What does the HOA fee cover, when was the last increase, and are there any pending special assessments or reserve-fund shortfalls?
- Why hasn't it sold? Are there any deal-killer items the seller is aware of (foundation, flood, title, zoning, code violations)?
- Is there a deadline driving the sale (1031 exchange, divorce, estate, relocation)? That informs how much negotiation room exists.
- The area grade is low — what's the realistic commute time and amenity access for the typical tenant pool here? Any planned neighborhood developments (good or bad) we should know about?
- What's the average days-on-market for RENTAL listings here right now (not sales)? A rising rental-DOM trend means longer vacancies and softer asking-rent achievability than the comps imply.
- What's the recent tenant-quality profile in this submarket — average credit score on applications, eviction rate, late-payment / NSF rate, and stable-employment percentage? A property-management company in the area should have these aggregated.
CashFlowRE · CFR-ZVBZEF6XNPZ1DZ
· Data 1 day ago
cashflowre.app · 2026-05-29