3904 Monica Ln · Johnsburg, IL
Flood risk 1/10 · Minimal
- FEMA flood zone
- X (unshaded)
- Chance of flooding over 30 yrs
- 0.0%
- Est. flood insurance / yr
- $507 – $1,088
Fire risk 3/10 · Minor
- Est. fire insurance / yr
- $804 – $1,492
Heat risk 2/10 · Minimal
- Hot days now (above 100°F)
- 7 days/yr
- Hot days in 30 yrs
- 14 days/yr
Wind risk 2/10 · Minimal
- Chance of severe wind over 30 yrs
- —
Air-quality risk 2/10 · Minimal
- Unhealthy air days now
- 1 days/yr
- Unhealthy air days in 30 yrs
- 1 days/yr
Risk factors via First Street. Map © Google.
Why this score? — see what drove the D grade
The composite is a weighted blend of 9 inputs, each scored 0–100. Each bar is that input's sub-score; the figure is the points it added to the 100-point composite (weight × sub-score).
- Appreciation +10.0/10.0
- ARV discount +9.3/15.0
- Cash flow +6.2/30.0
- Livability +4.0/5.0
- Condition / age +4.0/5.0
- Rent growth +2.5/5.0
- 1% rule +2.4/10.0
- Schools +2.2/10.0
- DSCR +0.6/10.0
$313,440
🖨 Deal sheet (PDF) 📄 Offer letter ✓ Due diligence
Listing remarks MLS
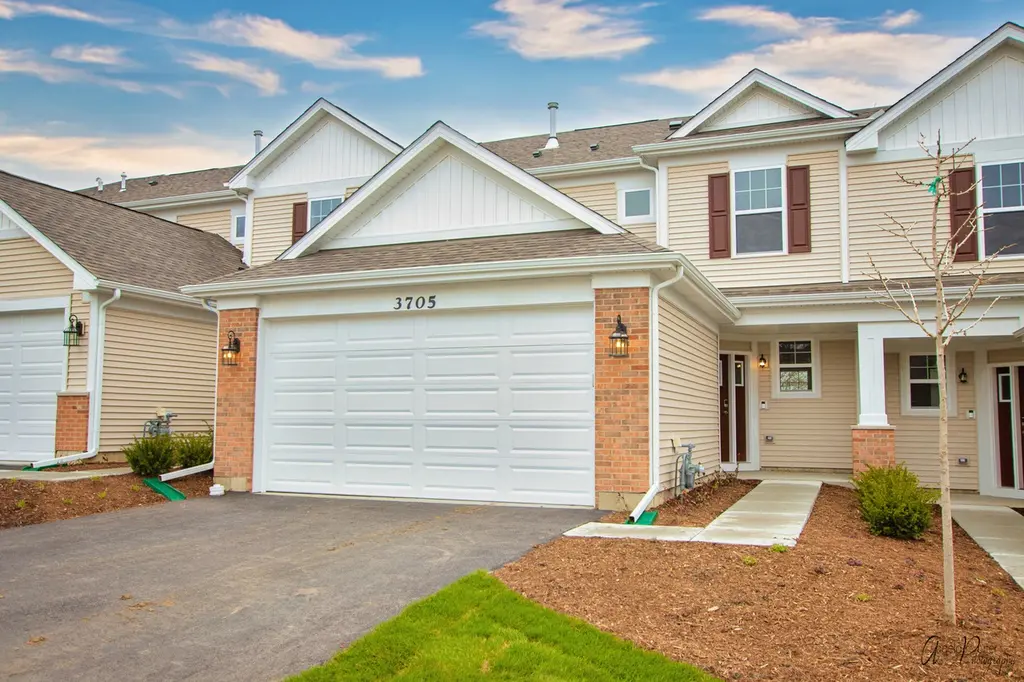
BRAND NEW MIDDLE UNIT 2-STORY 3 BEDS + DEN/ 2.1 BATHS TOWNHOUSE TO BE BUILT WITH JOHNSBURG SCHOOLS! 4 Plans to Choose from including one Ranch Style Townhome and Three Two Story Town Houses. TOWNHOUSE IS LOCATED IN A PLANNED URBAN DEVELOPMENT (PUD) AND IS APPROVED FOR FHA, VA AND CONVENTIONAL FINANCING! Tucked away in a corner of scenic McHenry county, Remington Grove boasts quality new townhomes in Johnsburg. This is a beautiful area that still maintains its small town charm. Great schools! 77 NEW CONSTRUCTION LUXURY TOWN HOUSES TO BE BUILT!
Key facts
- $239 HOA
- 2 garage spots
- Built 2025
Neighborhood map
What this means for you Summary
Snapshot
- This is a 3-bed/2.5-bath townhouse listed at $313k. Condition is rated good.
Deal economics
- At list price, monthly cash flow is $-566 ($-7k/yr) — negative.
- To cash-flow at today's rent, offer at most $231k (26.2% below list).
- To meet the 1% rule (rent ≥ 1% of price), the offer needs to be $233k (25.7% below list).
- Recommended offer: $231k (26.2% below list) — sets the bar for cash-flow.
- Cap rate 4.1% vs local median 2.9% in Johnsburg — top-decile yield for the area; either an underpriced asset or a hidden risk that comps aren't pricing in. Stress-test before assuming the spread holds.
Location & tenants
- Location reads 80/100 on livability (#111 in IL, #1,796 nationally) — a professional / high-income tenant draw. Strengths: crime A+, employment A+, housing A+; Watch: cost of living C-, amenities F, commute F.
- Johnsburg CUSD 12 (suburban): math 22% / reading 21% proficiency, ranked #321 of 620 in IL (top 52%) — low school quality limits family demand, transient renter base, plan for 1-2y turnover; only 19% free/reduced lunch — higher-income household profile.
- Zoned schools: Ringwood School Primary Ctr (433 students, 0% FRL); Johnsburg Jr High School (math 23% / reading 26%, grade F, #332 of 665 statewide, top 55%, 344 students, 0% FRL); Johnsburg High School (math 27% / reading 32%, grade F, #187 of 693 statewide, top 30%, 560 students, 0% FRL) — zoned schools average 0% FRL vs 19% district-wide (19 pts lower); this property's tenant base skews higher-income than the district average.
- Market conditions: 151 active listings in the ZIP; 3 comparable units currently listed for rent nearby; rentals leasing fast (median 0d on market — plan ~1-2 weeks tenant-placement turnaround); 1,595 units permitted in McHenry County in 2024 (485 in 5+ unit buildings).
Forward outlook
- In year one you build about $34k of equity ($2k loan paydown + $31k appreciation (10.0% local appreciation)).
- McHenry County population projected at -12% by 2050 — secular population decline; favor cash flow + early exit over multi-decade hold.
- By year 2, paydown + projected appreciation supports a ~$54k cash-out refi (75% LTV) — recoverable capital for the next deal without selling this one.
Negotiation context
- It's been on market 323 days — a 12% lower offer ($276k) is reasonable based on typical stale-listing flexibility.
Questions for the listing agent
- What do current leases actually rent for vs. the listed asking? Can we see a recent rent roll and the last 12 months of T-12 income?
- It's been on market 323 days. Have you received any prior offers? Is the seller open to a 26% concession, seller financing, or rate buy-down credit?
- What does the HOA fee cover, when was the last increase, and are there any pending special assessments or reserve-fund shortfalls?
- Why hasn't it sold? Are there any deal-killer items the seller is aware of (foundation, flood, title, zoning, code violations)?
- Is there a deadline driving the sale (1031 exchange, divorce, estate, relocation)? That informs how much negotiation room exists.
- The area grade is low — what's the realistic commute time and amenity access for the typical tenant pool here? Any planned neighborhood developments (good or bad) we should know about?
- What's the average days-on-market for RENTAL listings here right now (not sales)? A rising rental-DOM trend means longer vacancies and softer asking-rent achievability than the comps imply.
- What's the recent tenant-quality profile in this submarket — average credit score on applications, eviction rate, late-payment / NSF rate, and stable-employment percentage? A property-management company in the area should have these aggregated.
- How much new for-sale + rental construction is in the pipeline within 1–3 miles? Heavy new supply typically softens prices + rents 12–24 months out; constrained supply supports both.
Investment metrics
- 1% rule
- 0.74% ✗
- Cap rate
- 4.12%
- Cash-on-cash
- -7.75%
- DSCR
- 0.66
- GRM
- 11.2
CMA / ARV
- ARV (median comp)
- $326,401
- List price
- $313,440
- Delta
- -3.97%
- Verdict
- FAIR
- Comps
- 20 within 1.0 mi
Show comp detail 12 sales within ~0.75 mi
| Address | Dist | Beds/Ba | Sqft | Sold | Price | $/sf | Match |
|---|---|---|---|---|---|---|---|
| 3913 Monica Ln #2 | 0.05mi | 3/2.5 | 1,785 (0%) | 5mo | $372,156 | $208 | 93 |
| 3919 Monica Ln #5 | 0.06mi | 2/2.5 (-1) | 1,785 (0%) | 2mo | $369,905 | $207 | 91 |
| 3824 Monica Ln #3 | 0.03mi | 3/2.5 | 1,785 (0%) | 9mo | $313,870 | $176 | 91 |
| 4007 Monica Ln #4 | 0.07mi | 3/2.5 | 1,785 (0%) | 9mo | $345,730 | $194 | 89 |
| 3902 Monica Ln | 0.01mi | 4/3.5 (+1) | 1,857 (+4%) | 2mo | $346,770 | $187 | 83 |
| 3910 Monica Ln | 0.02mi | 2/2.5 (-1) | 1,587 (-11%) | 2mo | $296,500 | $187 | 74 |
| 3915 Monica Ln #3 | 0.05mi | 2/2.5 (-1) | 1,587 (-11%) | 2mo | $324,865 | $205 | 72 |
| 3917 Monica Ln #4 | 0.05mi | 2/2.5 (-1) | 1,587 (-11%) | 3mo | $335,075 | $211 | 71 |
| 4004 Monica Ln #3 | 0.05mi | 2/2.5 (-1) | 1,587 (-11%) | 9mo | $306,680 | $193 | 67 |
| 3921 Monica Ln #6 | 0.06mi | 2/2.0 (-1) | 1,565 (-12%) | 7mo | $352,195 | $225 | 64 |
| 3712 Monica Ln #1 | 0.08mi | 4/2.5 (+1) | 2,020 (+13%) | 9mo | $305,000 | $151 | 62 |
| 2904 Payton Xing | 0.69mi | 3/2.5 | 1,728 (-3%) | 5mo | $275,000 | $159 | 58 |
Match score weights: distance 35% · size 25% · config 20% · recency 20%. Top-matched comps best support the ARV.
Projected returns pro-forma
10.0% appreciation · 3.0% rent growth · sell at horizon
- IRR
- 18.8%
- Equity multiple
- 2.54×
- Total profit
- $134,810
- Equity at exit
- $282,372
- IRR
- 17.5%
- Equity multiple
- 5.85×
- Total profit
- $425,728
- Equity at exit
- $608,945
Cash invested: $87,763 (down + closing). Projections, not guarantees.
Landlord ↔ Tenant lean methodology
- Overall (STATE)
- 43 Moderately Tenant-Leaning
- State Illinois
- 43 Moderately Tenant-Leaning · D+7
- County
- — inherits STATE
- City
- — inherits STATE
ZIP-level market 60051
- Home prices YoY
- 4.9%
- Active inventory
- 151
- Price-to-rent
- 11.2×
Monthly cashflow live
- Estimated rent
- $2,327 medium interval (Pro) →
- Mortgage (P&I)
- −$1,644
- Tax est. 1.5%
- −$392 /mo · $4,702/yr
- Insurance
- −$131
- HOA
- −$239
- Vacancy / Maint / Mgmt
- −$489
- Net cashflow
- $-566
Break-even live
Sensitivity live
| Price | -10% $-350 | -5% $-458 | +0% $-566 | +5% $-675 | +10% $-783 |
|---|---|---|---|---|---|
| Rent | -10% $-750 | -5% $-658 | +0% $-566 | +5% $-475 | +10% $-383 |
| Rate | -1.0pp $-409 | -0.5pp $-487 | base $-566 | +0.5pp $-648 | +1.0pp $-730 |
UW: 25.0% down · 7.5% · 30yr · 1.5% tax · 5.0% vac · 8.0% maint · 8.0% mgmt
Financing live
Cash to close
- Down payment
- $78,360
- Closing costs
- $9,403
- Reserves months
- —
- Total cash needed
- —
Loan-product check · same deal, 3 products live
Conventional
25% down · 7.5% · 30yr
- Down + closing
- —
- Monthly P&I
- —
- Monthly cashflow
- —
- DSCR
- —
- Eligible?
- —
Personal DTI + credit; lowest rate.
DSCR
20% down · 8.5% · 30yr
- Down + closing
- —
- Monthly P&I
- —
- Monthly cashflow
- —
- DSCR
- —
- Eligible?
- —
No personal income docs; deal must DSCR.
Hard money
10% down · 12.0% · 12mo
- Down + closing
- —
- Monthly P&I
- —
- Monthly cashflow
- —
- DSCR
- —
- Eligible?
- —
Short-term bridge; refi at stabilization.
Rent comps 3 comps
| Address | Beds | Baths | Sqft | Rent | $/sqft | DOM | Units | Dist |
|---|---|---|---|---|---|---|---|---|
| 2554 Evergreen Cir Unit 2554 McHenry, IL | 3.0 | 2.5 | 1500 | $2,350 | $1.57 | 0d | 1 | 0.92mi |
| 2554 Evergreen Cir Unit 2554 McHenry, IL | 3.0 | 2.5 | 1500 | $2,300 | $1.53 | 17d | 1 | 0.92mi |
| 3415 Blake Rd McHenry, IL | 3.0 | 1.0–2.0 | 926 | $2,338 | $2.52 | 0d | 19 | 1.26mi |
HOA detail
- Monthly dues
- $239 · $2,868/yr
Listing history 17 events
-
2026-06-21days on market $313,440 Active 323 DOM
-
2026-06-18days on market $313,440 Active 320 DOM
-
2026-06-17days on market $313,440 Active 319 DOM
-
2026-06-16days on market $313,440 Active 318 DOM
-
2026-06-15days on market $313,440 Active 317 DOM
-
2026-06-13days on market $313,440 Active 315 DOM
-
2026-06-13days on market $313,440 Active 314 DOM
-
2026-06-09days on market $313,440 Active 311 DOM
-
2026-06-08days on market $313,440 Active 310 DOM
-
2026-06-07days on market $313,440 Active 309 DOM
-
2026-06-04days on market $313,440 Active 306 DOM
-
2026-06-03days on market $313,440 Active 305 DOM
-
2026-06-02days on market $313,440 Active 304 DOM
-
2026-06-01days on market $313,440 Active 303 DOM
-
2026-05-31days on market $313,440 Active 302 DOM
-
2025-08-14price $313,440 548-char remark
Show marketing remark (548 chars)
BRAND NEW MIDDLE UNIT 2-STORY 3 BEDS + DEN/ 2.1 BATHS TOWNHOUSE TO BE BUILT WITH JOHNSBURG SCHOOLS! 4 Plans to Choose from including one Ranch Style Townhome and Three Two Story Town Houses. TOWNHOUSE IS LOCATED IN A PLANNED URBAN DEVELOPMENT (PUD) AND IS APPROVED FOR FHA, VA AND CONVENTIONAL FINANCING! Tucked away in a corner of scenic McHenry county, Remington Grove boasts quality new townhomes in Johnsburg. This is a beautiful area that still maintains its small town charm. Great schools! 77 NEW CONSTRUCTION LUXURY TOWN HOUSES TO BE BUILT!
-
2025-08-02$308,900 Active 548-char remark
Show marketing remark (548 chars)
BRAND NEW MIDDLE UNIT 2-STORY 3 BEDS + DEN/ 2.1 BATHS TOWNHOUSE TO BE BUILT WITH JOHNSBURG SCHOOLS! 4 Plans to Choose from including one Ranch Style Townhome and Three Two Story Town Houses. TOWNHOUSE IS LOCATED IN A PLANNED URBAN DEVELOPMENT (PUD) AND IS APPROVED FOR FHA, VA AND CONVENTIONAL FINANCING! Tucked away in a corner of scenic McHenry county, Remington Grove boasts quality new townhomes in Johnsburg. This is a beautiful area that still maintains its small town charm. Great schools! 77 NEW CONSTRUCTION LUXURY TOWN HOUSES TO BE BUILT!
ⓘ Source: listings_history table (triggers on properties + properties_extension) + one-shot
backfill from property_details.listing_events for pre-trigger history.
Climate risk First Street
- Flood 1/10 Low FEMA zone X (unshaded) · 0% chance over 30 yrs
- Wildfire 3/10 Moderate
- Heat 2/10 Low 7 d/yr ≥100°F today · 14 d/yr by 30 yrs out
- Wind 2/10 Low
- Air quality 2/10 Low 1 unhealthy d/yr today · 1 by 30 yrs out
Nearby sold comps map
Loading sold comps map…
Walkable amenities ~0.75 mi
Loading nearby amenities…
Taxation est. · year 1
- Rental income
- $27,929
- − Mortgage interest
- −$17,558
- − Property taxes
- −$4,702
- − Insurance
- −$1,567
- − Repairs & maintenance
- −$2,234
- − Management
- −$2,234
- − HOA
- −$2,868
- − Depreciation
- −$9,118
- Taxable loss
- −$12,353
- Est. tax savings @ 24.0%
- +$2,965
- After-tax cash flow
- $-3,833/yr
For passive investors: Depreciation is non-cash, so a rental often shows a tax loss while cash-flowing — sheltering income. Rental losses are passive: they offset passive income freely, and up to $25,000/yr can offset ordinary (W-2) income if you actively participate and your MAGI is under $100k (phasing out to $0 by $150k); unused losses carry forward. On sale, claimed depreciation is recaptured at up to 25%, and gains may owe capital-gains tax (a 1031 exchange can defer both). Figures are a year-1 estimate at your 24.0% rate — not tax advice; consult a CPA.
Condition & rehab AI · 1 photo
This townhouse is in excellent condition with no visible repairs needed. It offers a good investment opportunity with potential for both resale and rental value through minor updates.
Value-add opportunities
- Both Painting exterior and interior — Enhances curb appeal and interior aesthetics
- Both Landscaping improvements — Enhances curb appeal and adds value
- Both New flooring in bathrooms and kitchen — Improves functionality and aesthetics
- Both New windows and doors — Enhances energy efficiency and curb appeal
Renovation cost estimate screening
Value-add ROI direction
- Both Painting exterior and interior — Enhances curb appeal and interior aesthetics ↑
- Both Landscaping improvements — Enhances curb appeal and adds value ↑
- Both New flooring in bathrooms and kitchen — Improves functionality and aesthetics ↑
- Both New windows and doors — Enhances energy efficiency and curb appeal ↑
ⓘ Cost ranges are severity-bucket heuristics (US national rule-of-thumb). Get contractor quotes + a written scope before underwriting a rehab budget.
Schools (NCES district)
- District
- Johnsburg CUSD 12
- NCES district ID
- 1720490
- Math proficiency
- 22% ▼ -18.00%
- Reading proficiency
- 21% ▼ -18.00%
- Median HH income
- $79,626
- Composite
- 22.0/100
- National rank
- #8206
- State rank
- #321 of 620 in IL
Livability — Johnsburg
- Score
- 80/100
- State rank
- #111
- US rank
- #1796
Category grades
Schools grade is shown separately in the Schools card above.
Census & demographics
- Census place
- Johnsburg, IL
- Population (ZIP)
- 23,931
Population outlook (McHenry County) Hauer SSP2
- Today (2025)
- 305,342 people
- By 2030
- 301,491 · -1.3%
- By 2040
- 288,211 · -5.6%
- By 2050
- 268,430 · -12.1%
- By 2075
- 226,209 · -25.9%
- By 2100
- 181,247 · -40.6%
Race, ethnicity, and origin ACS 2023
- Neighborhood character
- Predominantly White (84%)
- Race & ethnicity
- White 84% Hispanic / Latino 10% Two or more races 6% Asian 2%
- Hispanic origin (detail)
- Mexican 8%
- Common ancestry
- Romanian 12% Slovak 2% Lithuanian 2%
- Foreign-born
- 5% · Canada
- Languages at home
- 92% English-only · Spanish 5% Other Indo-European 2% Russian/Polish/Slavic 1%
Political lean MEDSL · McHenry
- 2024 margin
- Lean R (+5.3) · D 46.6% · R 51.9% · Other 1.5%
- 2008→2024 swing
- -10.6pp toward R · 2008: 5.3pp · 2024: -5.3pp
- All cycles
- 2024: R+5.3 2020: R+2.5 2016: R+8.1 2012: R+8.8 2008: D+5.3
Not yet ingested
- Civics
- —
Market trends
- HPI YoY
- ▲ 28.50%
- Current HPI
- 612.07
- Rent YoY
- —
- Metro
- —
- State GDP YoY
- ▲ 1.59%
- F500 in state
- 60
Industry mix (Fortune 500 HQ in IL)
| Industry | F500 HQs | Revenue |
|---|---|---|
| Insurance | 4 | $201B |
|
||
| Consumer Goods | 4 | $87B |
|
||
| Industrial Machinery | 3 | $64B |
|
||
| Healthcare | 2 | $55B |
|
||
| Retail / Pharmacy | 1 | $148B |
|
||
| Agriculture / Food | 1 | $86B |
|
||
Price history
+1.5% since first listed2 events — show timeline
- 2025-08-14 Price Changed $313,440 MRED as Distributed by MLS Grid
- 2025-08-02 Listed $308,900 MRED as Distributed by MLS Grid
Cash-flow waterfall
monthlySold comps — $/sqft
last 12 mo · ≤1 miLoading sold comps…