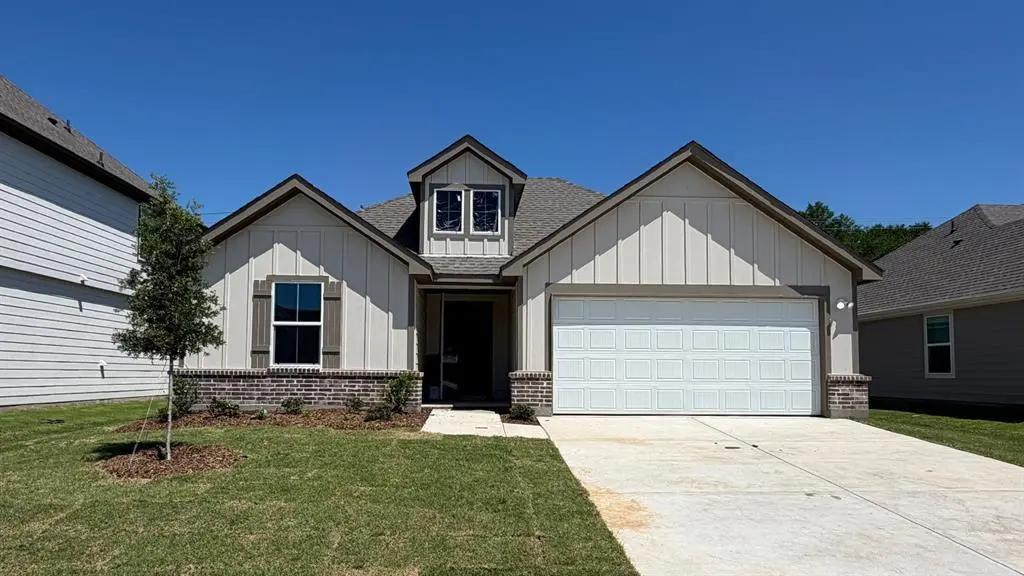
2073 Bobby Ashcraft Dr
Lindale, TX 75706
$258,490D+
4 bd · 2.0 ba ·
1,606 sqft ·
Built 2026
· SingleFamily
· Pending
· 42 DOM
Cashflow @ list (25.0% down · 7.5%)
Estimated rent
$2,082/mo
Mortgage (P&I)
−$1,356
Tax + insurance
−$431
HOA
−$46
Vac / Maint / Mgmt
−$437
Net cashflow
$-187/mo
Annual
$-2,247/yr
Cap rate
5.42%
Cash-on-cash
-3.11%
DSCR
0.86
1% rule
0.81%
Cash to close
$72,377
Investor read
- This is a 4-bed/2.0-bath single-family listed at $258k. Condition is rated good.
- At list price, monthly cash flow is $-187 ($-2k/yr) — negative.
- To cash-flow at today's rent, offer at most $231k (10.5% below list).
- To meet the 1% rule (rent ≥ 1% of price), the offer needs to be $208k (19.4% below list).
- It's been on market 42 days — a 3% lower offer ($251k) is reasonable based on typical stale-listing flexibility.
- Recommended offer: $208k (19.4% below list) — sets the bar for 1% rule.
- In year one you build about $19k of equity ($2k loan paydown + $17k appreciation (6.7% local appreciation)).
- Location reads 79/100 on livability (#52 in TX, #2,100 nationally) — a middle-class / working-renter tenant base. Strengths: employment A+, cost of living A+, housing A+; Watch: amenities F, commute F.
- Lindale ISD (town): math 71% / reading 66% proficiency, ranked #20 of 826 in TX (top 2%) — acceptable for families but not a draw, mixed tenant base, ~2y average lease.
- Market conditions: 109 active listings in the ZIP; 2 comparable units currently listed for rent nearby; 595 units permitted in Smith County in 2024 (45 in 5+ unit buildings).
- Smith County population projected at +24% by 2050 — long-run rental-demand tailwind backs the buy-and-hold thesis.
- By year 2, paydown + projected appreciation supports a ~$31k cash-out refi (75% LTV) — recoverable capital for the next deal without selling this one.
- Cap rate 5.4% vs local median 3.3% in Lindale — top-decile yield for the area; either an underpriced asset or a hidden risk that comps aren't pricing in. Stress-test before assuming the spread holds.
Questions for listing agent
- What do current leases actually rent for vs. the listed asking? Can we see a recent rent roll and the last 12 months of T-12 income?
- It's been on market 42 days. Have you received any prior offers? Is the seller open to a 19% concession, seller financing, or rate buy-down credit?
- What does the HOA fee cover, when was the last increase, and are there any pending special assessments or reserve-fund shortfalls?
- Is there a deadline driving the sale (1031 exchange, divorce, estate, relocation)? That informs how much negotiation room exists.
- The area grade is low — what's the realistic commute time and amenity access for the typical tenant pool here? Any planned neighborhood developments (good or bad) we should know about?
- What's the average days-on-market for RENTAL listings here right now (not sales)? A rising rental-DOM trend means longer vacancies and softer asking-rent achievability than the comps imply.
- What's the recent tenant-quality profile in this submarket — average credit score on applications, eviction rate, late-payment / NSF rate, and stable-employment percentage? A property-management company in the area should have these aggregated.
- How much new for-sale + rental construction is in the pipeline within 1–3 miles? Heavy new supply typically softens prices + rents 12–24 months out; constrained supply supports both.
CashFlowRE · CFR-ZYGDKRBKCY2PE4
· Data 3 weeks ago
cashflowre.app · 2026-05-29