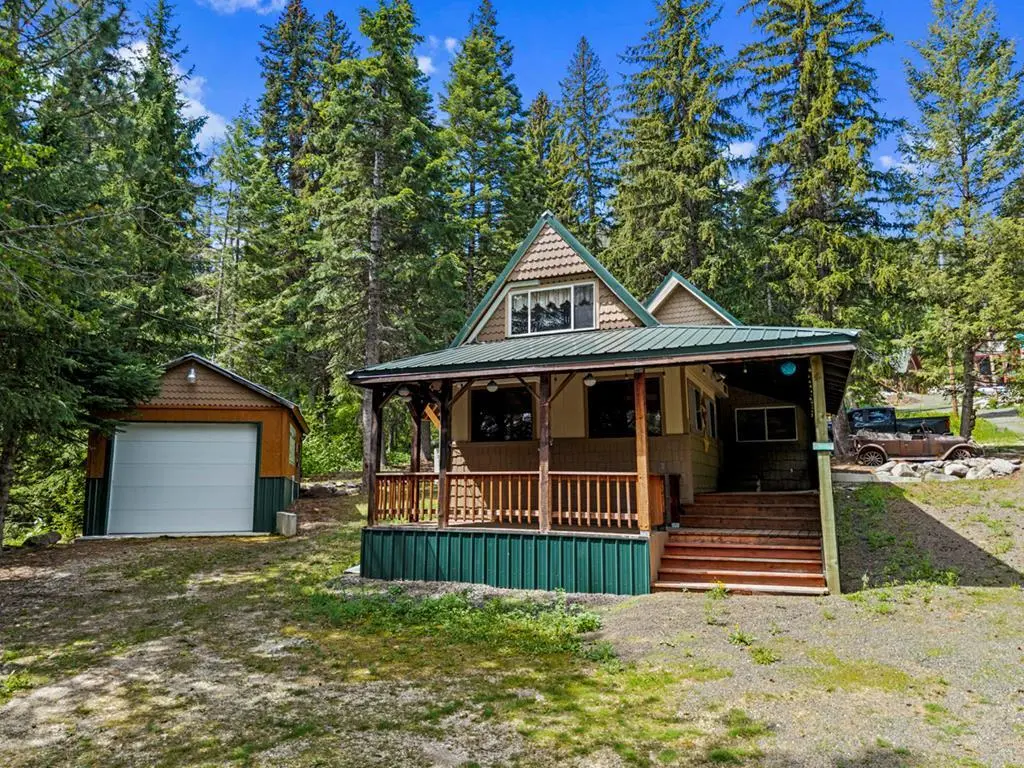
567 West Mountain Rd
Cascade, ID 83611
$425,000D-
3 bd · 1.0 ba ·
936 sqft ·
Built 1976
· Other
· Active
· 15 DOM
Cashflow @ list (25.0% down · 7.5%)
Estimated rent
$3,081/mo
Mortgage (P&I)
−$2,229
Tax + insurance
−$265
HOA
−$0
Vac / Maint / Mgmt
−$647
Net cashflow
$-60/mo
Annual
$-714/yr
Cap rate
6.12%
Cash-on-cash
-0.60%
DSCR
0.97
1% rule
0.72%
Cash to close
$119,000
Investor read
- This is a 3-bed/1.0-bath other listed at $425k.
- At list price, monthly cash flow is $-60 ($-714/yr) — negative.
- To cash-flow at today's rent, offer at most $414k (2.5% below list).
- To meet the 1% rule (rent ≥ 1% of price), the offer needs to be $308k (27.5% below list).
- It's been on market 15 days — a 2% lower offer ($419k) is reasonable based on typical stale-listing flexibility.
- Recommended offer: $308k (27.5% below list) — sets the bar for 1% rule.
- Local home prices are declining (-3.0%/yr); year-one equity from $3k of loan paydown is wiped out by about $13k of value loss. Plan a longer hold.
- Location reads 66/100 on livability (#116 in ID) — a middle-class / working-renter tenant base. Strengths: housing A+, cost of living A, crime A-; Watch: employment C-, amenities F, commute F.
- Cascade District (rural): math 35% / reading 45% proficiency, ranked #94 of 133 in ID (top 71%) — families likely to look elsewhere, expect single-tenant / working-renter base with shorter leases.
- Zoned schools: Cascade Elementary School (math 54% / reading 44%, grade D, #148 of 357 statewide, top 47%, 119 students, 33% FRL); Cascade Jr/Sr High School (math 54% / reading 74%, grade B-, #10 of 169 statewide, top 7%, 87 students, 15% FRL).
- Zoned-school proficiency averages 57% at this address vs 40% district-wide (+17 pts) — the actual schools serving this property are materially stronger than the Cascade District average implies; a family-tenant draw the district grade alone would hide.
- Market conditions: 406 active listings in the ZIP; 250 units permitted in Valley County in 2024 (0 in 5+ unit buildings).
- Valley County population projected at +7% by 2050 — modest demand growth; plan on rents tracking national, not racing it.
- 3 sale attempts since 15y ago with the ask held roughly flat each time — persistent listings suggest the price (not the market) is what's stuck; bring a comps-based counter.
- Climate carrying-cost: severe wildfire risk — expect insurance premiums to compound above CPI over the hold.
- Cap rate 6.1% vs local median 3.6% in Cascade — top-decile yield for the area; either an underpriced asset or a hidden risk that comps aren't pricing in. Stress-test before assuming the spread holds.
Questions for listing agent
- What do current leases actually rent for vs. the listed asking? Can we see a recent rent roll and the last 12 months of T-12 income?
- Built in 1976 — when were the roof, HVAC, electrical panel, plumbing, and water heater last replaced?
- Is there a deadline driving the sale (1031 exchange, divorce, estate, relocation)? That informs how much negotiation room exists.
- Schools are D-rated, which usually means shorter tenancies and higher turnover. Who's the typical renter profile here, and what's been the actual vacancy rate?
- The area grade is low — what's the realistic commute time and amenity access for the typical tenant pool here? Any planned neighborhood developments (good or bad) we should know about?
- What's the average days-on-market for RENTAL listings here right now (not sales)? A rising rental-DOM trend means longer vacancies and softer asking-rent achievability than the comps imply.
- What's the recent tenant-quality profile in this submarket — average credit score on applications, eviction rate, late-payment / NSF rate, and stable-employment percentage? A property-management company in the area should have these aggregated.
- How much new for-sale + rental construction is in the pipeline within 1–3 miles? Heavy new supply typically softens prices + rents 12–24 months out; constrained supply supports both.
CashFlowRE · CFR-ZYSAJ3CVFR67DX
· Data 2 days ago
cashflowre.app · 2026-05-29