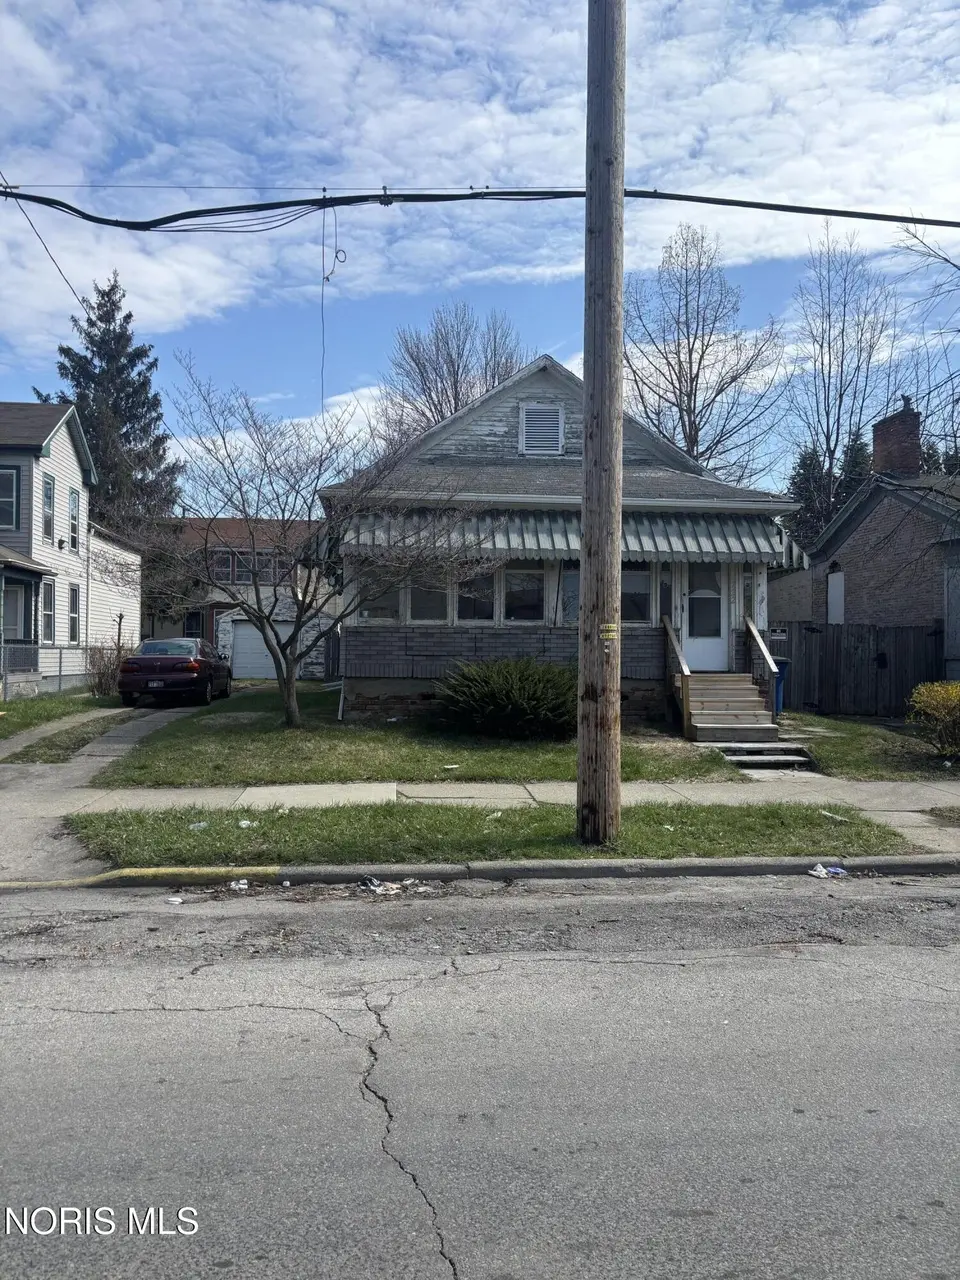
722 Walnut St · Toledo, OH
Flood risk 1/10 · Minimal
- FEMA flood zone
- X (unshaded)
- Chance of flooding over 30 yrs
- 0.0%
- Est. flood insurance / yr
- $507 – $1,088
Fire risk 1/10 · Minimal
- Est. fire insurance / yr
- $713 – $1,323
Heat risk 3/10 · Minor
- Hot days now (above 100°F)
- 7 days/yr
- Hot days in 30 yrs
- 16 days/yr
Wind risk 2/10 · Minimal
- Chance of severe wind over 30 yrs
- —
Air-quality risk 2/10 · Minimal
- Unhealthy air days now
- 1 days/yr
- Unhealthy air days in 30 yrs
- 3 days/yr
Risk factors via First Street. Map © Google.
Why this score? — see what drove the B+ grade
The composite is a weighted blend of 9 inputs, each scored 0–100. Each bar is that input's sub-score; the figure is the points it added to the 100-point composite (weight × sub-score).
- Cash flow +30.0/30.0
- ARV discount +13.4/15.0
- 1% rule +10.0/10.0
- DSCR +10.0/10.0
- Appreciation +6.2/10.0
- Livability +3.3/5.0
- Rent growth +2.5/5.0
- Condition / age +2.5/5.0
- Schools +1.6/10.0
$34,900
🖨 Deal sheet 📄 Offer letter ✓ Due diligence
Listing remarks
Low maintenance well priced home now vacant and ready for new owner. . Make this was shine with a good cleaning and start making ROI immediately. Come check it out!
Key facts
- 5,000 sq ft lot
- Garage
- Built 1887
Neighborhood map
What this means for you Summary
Snapshot
- This is a 2-bed/1.0-bath single-family listed at $35k.
Deal economics
- At list price, monthly cash flow is $772 ($9k/yr) — positive.
- The deal already cash-flows at list — no discount required.
- Meets the 1% rule at list price ($1k rent vs $35k).
- Cap rate 32.8% vs local median 7.6% in Toledo — top-decile yield for the area; either an underpriced asset or a hidden risk that comps aren't pricing in. Stress-test before assuming the spread holds.
Location & tenants
- Location reads 66/100 on livability (#645 in OH) — a middle-class / working-renter tenant base. Strengths: cost of living A+, housing A+, health & safety A+; Watch: amenities C-, crime F, commute F.
- Toledo City (urban): math 15% / reading 24% proficiency, ranked #634 of 656 in OH (top 97%) — low school quality limits family demand, transient renter base, plan for 1-2y turnover; 72% free/reduced lunch — lower-income household profile, screen leases tightly.
- Zoned schools: Sherman Elementary School (math 2% / reading 8%, grade F, #1,554 of 1,584 statewide, top 100%, 293 students, 0% FRL); Woodward High School (math 2% / reading 22%, grade F, #726 of 781 statewide, top 94%, 672 students, 0% FRL) — zoned schools average 0% FRL vs 72% district-wide (72 pts lower); this property's tenant base skews higher-income than the district average.
- Market conditions: 16 active listings in the ZIP; 40 comparable units currently listed for rent nearby; rentals lingering (median 44d on market — plan ~5-8 weeks vacancy on turnover, expect pricing pressure); 50% of comp listings sitting > 30 days — soft ceiling on asking rent; lower-income renter base — watch delinquency; 415 units permitted in Lucas County in 2024 (122 in 5+ unit buildings).
- At $1,309/mo this rent would consume 76% of the median local household income ($21k/yr) (locally 693% of renters already pay >50% of income on rent) — very limited rent-growth headroom before tenants either downsize or default.
Forward outlook
- In year one you build about $1k of equity ($241 loan paydown + $820 appreciation (2.4% local appreciation)).
- Lucas County population projected at -16% by 2050 — secular population decline; favor cash flow + early exit over multi-decade hold.
- At projected returns (2.4% appreciation + 3.0% rent growth), your $10k cash investment doubles in ~1 year — after that, you're playing with house money.
Negotiation context
- Only 10 days on market — expect competitive offers; lowballing is unlikely to land.
Risks & watch-outs
- Watch-outs: built in 1887 — expect roof / HVAC / electrical / plumbing capex.
Questions for the listing agent
- Built in 1887 — when were the roof, HVAC, electrical panel, plumbing, and water heater last replaced?
- Is there a deadline driving the sale (1031 exchange, divorce, estate, relocation)? That informs how much negotiation room exists.
- Schools are D-rated, which usually means shorter tenancies and higher turnover. Who's the typical renter profile here, and what's been the actual vacancy rate?
- Crime grade is F in this area — have there been break-ins, vandalism, or insurance claims at this property in the last 3 years? What carrier currently insures it and at what premium?
- What's the average days-on-market for RENTAL listings here right now (not sales)? A rising rental-DOM trend means longer vacancies and softer asking-rent achievability than the comps imply.
- What's the recent tenant-quality profile in this submarket — average credit score on applications, eviction rate, late-payment / NSF rate, and stable-employment percentage? A property-management company in the area should have these aggregated.
- How much new for-sale + rental construction is in the pipeline within 1–3 miles? Heavy new supply typically softens prices + rents 12–24 months out; constrained supply supports both.
Investment metrics
- 1% rule
- 3.75% ✓
- Cap rate
- 32.83%
- Cash-on-cash
- 94.77%
- DSCR
- 5.22
- GRM
- 2.2
CMA / ARV
- ARV (on-the-fly)
- $40,170
- Comps found
- 9
Show comp detail 9 sales within ~0.75 mi
| Address | Dist | Beds/Ba | Sqft | Sold | Price | $/sf | Match |
|---|---|---|---|---|---|---|---|
| 626 Walnut St | 0.07mi | 3/1.0 (+1) | 1,088 (+6%) | 11mo | $27,000 | $25 | 73 |
| 907 Lagrange St | 0.19mi | 2/1.0 | 1,144 (+11%) | 11mo | $45,000 | $39 | 64 |
| 922 N Ontario St | 0.13mi | 3/2.0 (+1) | 1,080 (+5%) | 20mo | $46,000 | $43 | 60 |
| 1411 N Erie St | 0.57mi | 3/1.0 (+1) | 1,010 (-2%) | 10mo | $25,000 | $25 | 57 |
| 1313 N Erie St | 0.48mi | 2/1.0 | 886 (-14%) | 10mo | $39,000 | $44 | 46 |
| 1133 Sherman St | 0.68mi | 3/1.0 (+1) | 1,080 (+5%) | 11mo | $50,000 | $46 | 46 |
| 1523 Elm St | 0.52mi | 3/1.0 (+1) | 1,109 (+8%) | 18mo | $68,900 | $62 | 43 |
| 914 Moore St | 0.73mi | 2/1.0 | 1,096 (+6%) | 16mo | $31,900 | $29 | 42 |
| 1036 Sherman St | 0.62mi | 2/1.0 | 896 (-13%) | 13mo | $24,200 | $27 | 38 |
Match score weights: distance 35% · size 25% · config 20% · recency 20%. Top-matched comps best support the ARV.
Projected returns pro-forma
2.35% appreciation · 3.0% rent growth · sell at horizon
- IRR
- 98.6%
- Equity multiple
- 6.34×
- Total profit
- $52,205
- Equity at exit
- $14,434
- IRR
- 98.6%
- Equity multiple
- 13.13×
- Total profit
- $118,523
- Equity at exit
- $21,311
Cash invested: $9,772 (down + closing). Projections, not guarantees.
Landlord ↔ Tenant lean methodology
- Overall (STATE)
- 73 Landlord-Friendly
- State Ohio
- 73 Landlord-Friendly · R+6
- County
- — inherits STATE
- City
- — inherits STATE
ZIP-level market 43604
- Home prices YoY
- 2.1%
- Active inventory
- 16
- Price-to-rent
- 2.2×
Monthly cashflow live
- Estimated rent
- $1,309 high interval (Pro) →
- Mortgage (P&I)
- −$183
- Tax from tax record
- −$65 /mo · $776/yr
- Insurance
- −$15
- HOA
- −$0
- Vacancy / Maint / Mgmt
- −$275
- Net cashflow
- $772
Break-even live
UW: 25.0% down · 7.5% · 30yr · 1.5% tax · 5.0% vac · 8.0% maint · 8.0% mgmt
Financing live
Cash to close
- Down payment
- $8,725
- Closing costs
- $1,047
- Reserves months
- —
- Total cash needed
- —
Loan-product check · same deal, 3 products live
Conventional
25% down · 7.5% · 30yr
- Down + closing
- —
- Monthly P&I
- —
- Monthly cashflow
- —
- DSCR
- —
- Eligible?
- —
Personal DTI + credit; lowest rate.
DSCR
20% down · 8.5% · 30yr
- Down + closing
- —
- Monthly P&I
- —
- Monthly cashflow
- —
- DSCR
- —
- Eligible?
- —
No personal income docs; deal must DSCR.
Hard money
10% down · 12.0% · 12mo
- Down + closing
- —
- Monthly P&I
- —
- Monthly cashflow
- —
- DSCR
- —
- Eligible?
- —
Short-term bridge; refi at stabilization.
Rent comps 40 comps
| Address | Beds | Baths | Sqft | Rent | $/sqft | DOM | Units | Dist |
|---|---|---|---|---|---|---|---|---|
| 626 Walnut St Toledo, OH | 3.0 | 1.0 | 1088 | $995 | $0.91 | 43d | 1 | 0.08mi |
| 1031 N Michigan St Toledo, OH | 3.0 | 2.0 | 1488 | $1,195 | $0.80 | 23d | 1 | 0.29mi |
| 1119 N Summit St Toledo, OH | 2.0 | 2.0 | 1500 | $1,890 | $1.26 | 43d | 1 | 0.42mi |
| 1119 N Summit St Toledo, OH | 2.0 | 2.0 | 1226 | $1,750 | $1.43 | 23d | 1 | 0.42mi |
| 1119 N Summit St Toledo, OH | 1.0–2.0 | 1.0–2.0 | 1023 | $1,750 | $1.71 | 13d | 2 | 0.42mi |
| 513 Adams St Toledo, OH | 1.0–2.0 | 1.0 | 1175 | $1,424 | $1.21 | 13d | 11 | 0.45mi |
| 426 Beacon St Toledo, OH | 1.0–2.0 | 1.0–1.5 | 809 | $882 | $1.09 | 13d | 10 | 0.48mi |
| 630 Mulberry St Toledo, OH | 2.0 | 1.0 | 1000 | $950 | $0.95 | 23d | 1 | 0.49mi |
| 332 14th St Unit 303 Toledo, OH | 3.0 | 1.5 | 1040 | $1,000 | $0.96 | 43d | 1 | 0.60mi |
| 322 14th St Apt 203 Toledo, OH | 3.0 | 1.5 | 1065 | $1,000 | $0.94 | 13d | 1 | 0.61mi |
| 200 N St Clair St Toledo, OH | 2.0 | 1.0–2.0 | 835 | $2,550 | $3.05 | 13d | 15 | 0.63mi |
| 625 Riverside Dr Toledo, OH | 1.0–2.0 | 1.0–2.0 | 860 | $1,767 | $2.05 | 13d | 37 | 0.64mi |
| 123 Water St Unit 307 Toledo, OH | 1.0 | 1.0 | 914 | $1,445 | $1.58 | 43d | 1 | 0.73mi |
| 123 Water St Unit 406 Toledo, OH | 1.0 | 1.0 | 1207 | $1,675 | $1.39 | 43d | 1 | 0.73mi |
| 123 Water St Unit 411 Toledo, OH | 1.0 | 1.0 | 747 | $1,380 | $1.85 | 23d | 1 | 0.73mi |
| 624 Bush St Toledo, OH | 1.0 | 1.0 | 1193 | $699 | $0.59 | 43d | 1 | 0.73mi |
| 2131 Franklin Ave Toledo, OH | 2.0 | 2.0 | 1255 | $900 | $0.72 | 43d | 1 | 0.78mi |
| 23 N Summit St Toledo, OH | 1.0 | 1.0 | 838 | $1,475 | $1.76 | 13d | 2 | 0.80mi |
| 1 S Erie St Toledo, OH | 1.0 | 1.0 | 846 | $1,410 | $1.67 | 13d | 1 | 0.87mi |
| 15 S Ontario St Apt 409 Toledo, OH | 1.0 | 1.0 | 984 | $1,695 | $1.72 | 43d | 1 | 0.89mi |
| 1337 Moore St Toledo, OH | 3.0 | 1.5 | 1194 | $995 | $0.83 | 21d | 1 | 0.91mi |
| 34 S Erie St Unit 209 Toledo, OH | 1.0 | 1.0 | 930 | $1,375 | $1.48 | 23d | 1 | 0.93mi |
| 34 S Erie St Unit 202 Toledo, OH | 1.0 | 1.0 | 894 | $1,275 | $1.43 | 23d | 1 | 0.93mi |
| 34 S Erie St Unit 409 Toledo, OH | 1.0 | 1.0 | 930 | $1,375 | $1.48 | 43d | 1 | 0.93mi |
| 34 S Erie St Apt 602 Toledo, OH | 1.0 | 1.0 | 894 | $1,315 | $1.47 | 43d | 1 | 0.93mi |
| 34 S Erie St Unit 611 Toledo, OH | 1.0 | 1.0 | 990 | $1,300 | $1.31 | 43d | 1 | 0.93mi |
| 34 S Erie St Unit 107 Toledo, OH | 1.0 | 1.0 | 1103 | $1,300 | $1.18 | 23d | 1 | 0.93mi |
| 470 2nd St Unit 1 Toledo, OH | 2.0 | 1.0 | 950 | $799 | $0.84 | 43d | 1 | 0.98mi |
| 225 Palmer St Toledo, OH | 2.0 | 1.0 | 924 | $895 | $0.97 | 43d | 1 | 1.00mi |
| 2621 Chestnut St Toledo, OH | 3.0 | 1.0 | 1444 | $1,250 | $0.87 | 43d | 1 | 1.01mi |
| 1305 Mott Ave Toledo, OH | 3.0 | 1.0 | 1080 | $1,000 | $0.93 | 43d | 1 | 1.04mi |
| 128 Carbon St Toledo, OH | 3.0 | 1.0 | 1113 | $1,200 | $1.08 | 23d | 1 | 1.05mi |
| 1306 Mott Ave Toledo, OH | 3.0 | 1.5 | 1282 | $1,149 | $0.90 | 43d | 1 | 1.06mi |
| 414 Platt St Unit ST-1 Toledo, OH | 1.0 | 1.0 | 800 | $800 | $1.00 | 43d | 1 | 1.09mi |
| 414 Platt St Unit ST-3 Toledo, OH | 3.0 | 1.0 | 1500 | $1,150 | $0.77 | 23d | 1 | 1.09mi |
| 420 Platt St Toledo, OH | 2.0 | 1.0 | 1499 | $685 | $0.46 | 21d | 1 | 1.10mi |
| 221 Licking St Unit 2 Toledo, OH | 3.0 | 1.0 | 1048 | $1,099 | $1.05 | 23d | 1 | 1.13mi |
| 451 5th St Apt 1 Toledo, OH | 1.0 | 1.0 | 850 | $650 | $0.76 | 43d | 1 | 1.13mi |
| 142 23rd St Toledo, OH | 1.0 | 1.0–1.5 | 508 | $1,395 | $2.75 | 43d | 1 | 1.13mi |
| 409 W Bancroft St Toledo, OH | 2.0 | 1.0 | 730 | $880 | $1.21 | 43d | 1 | 1.14mi |
Listing history 2 events
-
2026-04-22status Pending
-
2026-04-12$34,900 Active
ⓘ Source: listings_history table (triggers on properties + properties_extension) + one-shot
backfill from property_details.listing_events for pre-trigger history.
Tax reassessment forecast OH · Partial reset (capped growth)
- Current annual tax
- $776 · $65/mo
- Projected year-2 tax
- $776 · $65/mo
- Expected delta
- $0/yr ($0/mo · 0.0%)
ⓘ Screening estimate from a state-policy table — verify with the county assessor before closing.
Climate risk First Street
- Flood 1/10 Low FEMA zone X (unshaded) · 0% chance over 30 yrs
- Wildfire 1/10 Low
- Heat 3/10 Moderate 7 d/yr ≥100°F today · 16 d/yr by 30 yrs out
- Wind 2/10 Low
- Air quality 2/10 Low 1 unhealthy d/yr today · 3 by 30 yrs out
Nearby sold comps map
Loading sold comps map…
Walkable amenities ~0.75 mi
Loading nearby amenities…
Taxation est. · year 1
- Rental income
- $15,705
- − Mortgage interest
- −$1,955
- − Property taxes
- −$776
- − Insurance
- −$174
- − Repairs & maintenance
- −$1,256
- − Management
- −$1,256
- − Depreciation
- −$1,015
- Taxable income
- $9,272
- Est. tax owed @ 24.0%
- −$2,225
- After-tax cash flow
- $7,035/yr
For passive investors: Depreciation is non-cash, so a rental often shows a tax loss while cash-flowing — sheltering income. Rental losses are passive: they offset passive income freely, and up to $25,000/yr can offset ordinary (W-2) income if you actively participate and your MAGI is under $100k (phasing out to $0 by $150k); unused losses carry forward. On sale, claimed depreciation is recaptured at up to 25%, and gains may owe capital-gains tax (a 1031 exchange can defer both). Figures are a year-1 estimate at your 24.0% rate — not tax advice; consult a CPA.
Schools (NCES district)
- District
- Toledo City
- NCES district ID
- 3904490
- Math proficiency
- 15% ▼ -16.00%
- Reading proficiency
- 24% ▼ -13.00%
- Median HH income
- $32,137
- Composite
- 15.76/100
- National rank
- #9276
- State rank
- #634 of 656 in OH
Livability — Toledo
- Score
- 66/100
- State rank
- #645
- US rank
- #11442
Category grades
Schools grade is shown separately in the Schools card above.
Census & demographics
- Census place
- Toledo, OH
- County
- Lucas County · 380,724 people
- City population
- 280,811
- Metro
- Toledo, OH
- Population (ZIP)
- 9,594
- Household income
- $20,734
- Rent vs Own
- Severe rent burden
- 693.0
Population outlook (Lucas County) Hauer SSP2
- Today (2025)
- 420,751 people
- By 2030
- 410,187 · -2.5%
- By 2040
- 384,019 · -8.7%
- By 2050
- 355,125 · -15.6%
- By 2075
- 291,683 · -30.7%
- By 2100
- 233,670 · -44.5%
Race, ethnicity, and origin ACS 2023
- Neighborhood character
- Diverse neighborhood (Simpson 0.61)
- Race & ethnicity
- Black 51% White 34% Two or more races 9% Hispanic / Latino 9%
- Hispanic origin (detail)
- Mexican 8%
- Common ancestry
- Romanian 2% Slovak 1% Lithuanian 1%
- Foreign-born
- 4% · Canada, South Korea, China
- Languages at home
- 95% English-only · Spanish 3% Arabic 1%
Political lean MEDSL · Lucas
- 2024 margin
- D (+12.6) · D 55.8% · R 43.2%
- 2008→2024 swing
- -18.9pp toward R · 2008: 31.4pp · 2024: 12.6pp
- All cycles
- 2024: D+12.6 2020: D+16.8 2016: D+17.4 2012: D+30.4 2008: D+31.4
Not yet ingested
- Civics
- —
Market trends
- HPI YoY
- ▲ 2.35%
- Current HPI
- 111.6154
- Rent YoY
- —
- Metro
- Toledo, OH
- State GDP YoY
- ▲ 1.98%
- F500 in state
- 48
Industry mix (Fortune 500 HQ in OH)
| Industry | F500 HQs | Revenue |
|---|---|---|
| Insurance | 3 | $145B |
|
||
| Industrial Machinery | 3 | $49B |
|
||
| Financial Services | 3 | $24B |
|
||
| Consumer Goods | 2 | $93B |
|
||
| Aerospace / Defense | 2 | $47B |
|
||
| Utilities | 2 | $33B |
|
||
Price history
2 events — show timeline
- 2026-04-22 Pending — NORIS
- 2026-04-12 Listed $34,900 NORIS
Property tax history
+15.1%/yrLatest (2025): $776 · +2.1% YoY. Source: county tax records.
Cash-flow waterfall
monthlySold comps — $/sqft
last 12 mo · ≤1 miLoading sold comps…