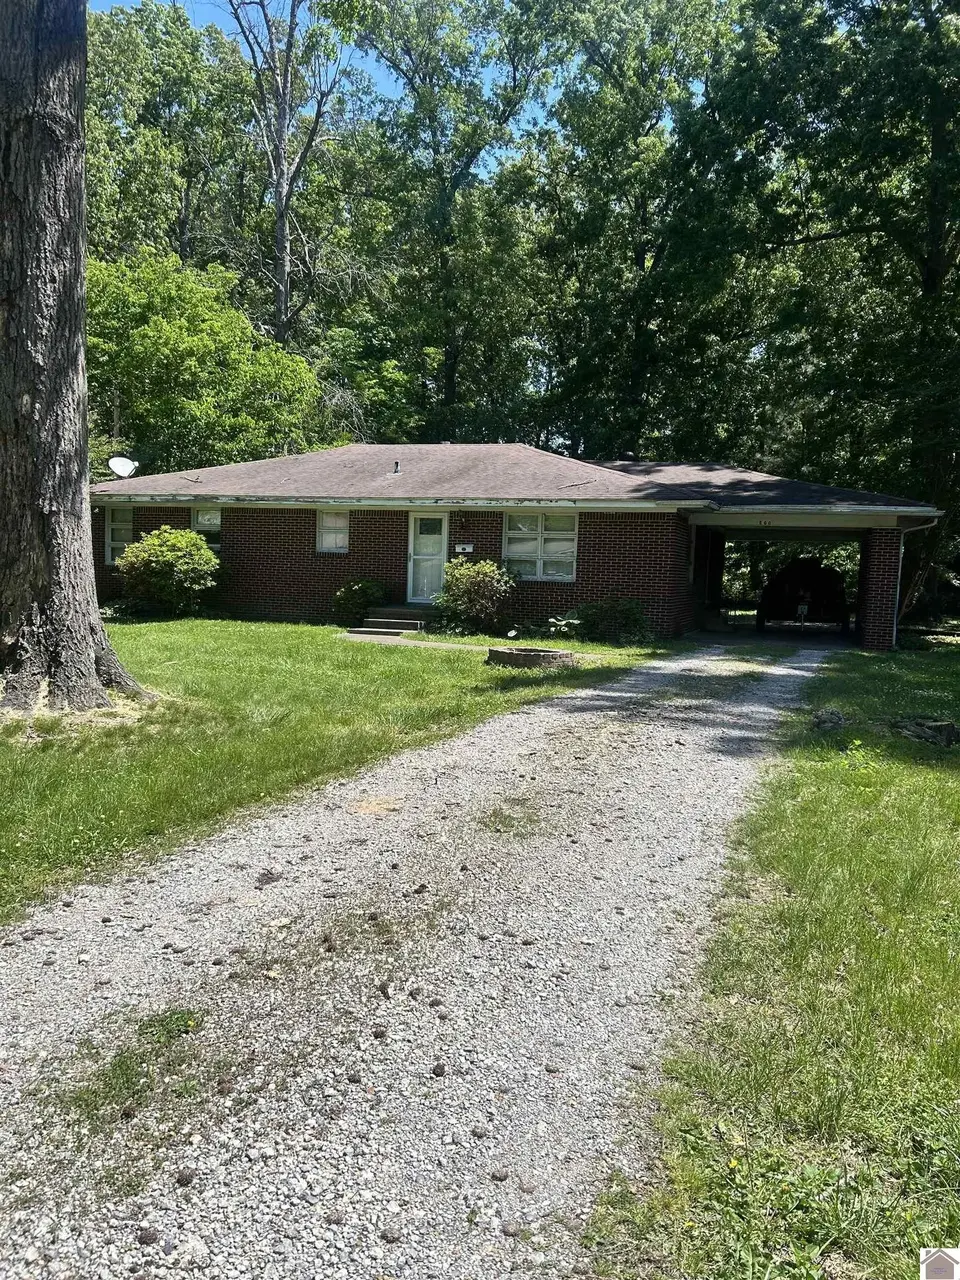
800 N 21st St · Paducah, KY
Flood risk 1/10 · Minimal
- FEMA flood zone
- X
- Chance of flooding over 30 yrs
- 0.0%
- Est. flood insurance / yr
- $507 – $1,088
Fire risk 3/10 · Minor
- Est. fire insurance / yr
- $839 – $1,559
Heat risk 6/10 · Moderate
- Hot days now (above 108°F)
- 7 days/yr
- Hot days in 30 yrs
- 20 days/yr
Wind risk 3/10 · Minor
- Chance of severe wind over 30 yrs
- 7.0%
Air-quality risk 3/10 · Minor
- Unhealthy air days now
- 1 days/yr
- Unhealthy air days in 30 yrs
- 4 days/yr
Risk factors via First Street. Map © Google.
Why this score? — see what drove the B- grade
The composite is a weighted blend of 9 inputs, each scored 0–100. Each bar is that input's sub-score; the figure is the points it added to the 100-point composite (weight × sub-score).
- Cash flow +30.0/30.0
- DSCR +10.0/10.0
- ARV discount +9.9/15.0
- 1% rule +7.6/10.0
- Livability +3.4/5.0
- Rent growth +2.5/5.0
- Condition / age +2.5/5.0
- Schools +2.3/10.0
- Appreciation +0.0/10.0
$109,900
🖨 Deal sheet 📄 Offer letter ✓ Due diligence
Listing remarks MLS
Selling "as is" condition. Great property for rental or starter home. Two large bedrooms 1 bath, spacious layout. Nice backyard with fire pit and mature trees. Large patio area great for grilling out and gatherings.
Key facts
- Huge back patio
- Back yard
- Firepit
Tags
Property features AI
Exterior
- Parking: Carport with 1 space
- Utilities: Public water; Public sewer
- Home design: Single-family residence; Residential property; Single story
- Construction: Frame construction; Composition roof
- Exterior features: Level lot
Interior
- Flooring: Wood
- Bathrooms: 1 full bathroom
- Interior features: Wood flooring; Crawl space foundation
Neighborhood map
What this means for you Summary
Snapshot
- This is a 2-bed/1.0-bath single-family listed at $110k.
Deal economics
- At list price, monthly cash flow is $444 ($5k/yr) — positive.
- The deal already cash-flows at list — no discount required.
- Meets the 1% rule at list price ($1k rent vs $110k).
- Recommended offer: $107k (3.0% below list) — sets the bar for market timing.
- Cap rate 11.1% vs local median 4.5% in Paducah — top-decile yield for the area; either an underpriced asset or a hidden risk that comps aren't pricing in. Stress-test before assuming the spread holds.
Location & tenants
- Location reads 68/100 on livability (#197 in KY) — a middle-class / working-renter tenant base. Strengths: cost of living A+, housing A+, health & safety A+; Watch: crime C-, employment D, amenities F.
- Paducah Independent (town): math 22% / reading 36% proficiency, ranked #122 of 165 in KY (top 74%) — low school quality limits family demand, transient renter base, plan for 1-2y turnover; 69% free/reduced lunch — lower-income household profile, screen leases tightly.
- Zoned schools: Mcnabb Elementary School (math 8% / reading 17%, grade F, #630 of 676 statewide, top 95%, 322 students, 91% FRL); Paducah Middle School (math 19% / reading 36%, grade F, #168 of 217 statewide, top 78%, 652 students, 69% FRL); Paducah Tilghman High School (math 22% / reading 42%, grade F, #97 of 254 statewide, top 46%, 878 students, 64% FRL).
- Market conditions: 248 active listings in the ZIP; 2 comparable units currently listed for rent nearby; 187 units permitted in McCracken County in 2024 (104 in 5+ unit buildings).
Forward outlook
- Local home prices are declining (-3.0%/yr); year-one equity from $760 of loan paydown is wiped out by about $3k of value loss. Plan a longer hold.
- McCracken County population projected to shrink 9% by 2050 — rents likely to lag national; underwrite the cash flow, not the appreciation.
- At projected returns (-3.0% appreciation + 3.0% rent growth), your $31k cash investment doubles in ~7 years — after that, you're playing with house money.
Negotiation context
- It's been on market 44 days — a 3% lower offer ($107k) is reasonable based on typical stale-listing flexibility.
- 2 sale attempts; this cycle's ask has dropped $15k (12%) from the opening price — seller is motivated, your offer sets the floor, not the list.
- Current owner paid $44k; list at $110k implies a 150% gain — meaningful room to come down on a strong offer.
Risks & watch-outs
- Watch-outs: built in 1958 — expect roof / HVAC / electrical / plumbing capex.
- Climate carrying-cost: extreme-heat days projected 7→20/yr by 2055 (HVAC capex compounding) — expect insurance premiums to compound above CPI over the hold.
Questions for the listing agent
- It's been on market 44 days. Have you received any prior offers? Is the seller open to a 3% concession, seller financing, or rate buy-down credit?
- Built in 1958 — when were the roof, HVAC, electrical panel, plumbing, and water heater last replaced?
- Is there a deadline driving the sale (1031 exchange, divorce, estate, relocation)? That informs how much negotiation room exists.
- Schools are D-rated, which usually means shorter tenancies and higher turnover. Who's the typical renter profile here, and what's been the actual vacancy rate?
- What's the average days-on-market for RENTAL listings here right now (not sales)? A rising rental-DOM trend means longer vacancies and softer asking-rent achievability than the comps imply.
- What's the recent tenant-quality profile in this submarket — average credit score on applications, eviction rate, late-payment / NSF rate, and stable-employment percentage? A property-management company in the area should have these aggregated.
- How much new for-sale + rental construction is in the pipeline within 1–3 miles? Heavy new supply typically softens prices + rents 12–24 months out; constrained supply supports both.
Investment metrics
- 1% rule
- 1.26% ✓
- Cap rate
- 11.14%
- Cash-on-cash
- 17.31%
- DSCR
- 1.77
- GRM
- 6.6
CMA / ARV
- ARV (median comp)
- $115,965
- List price
- $109,900
- Delta
- -5.23%
- Verdict
- FAIR
- Comps
- 20 within 1.0 mi
Show comp detail 12 sales within ~0.75 mi
| Address | Dist | Beds/Ba | Sqft | Sold | Price | $/sf | Match |
|---|---|---|---|---|---|---|---|
| 2501 Clay St | 0.45mi | 3/1.5 (+1) | 1,573 (-3%) | 2mo | $194,000 | $123 | 66 |
| 2400 Harrison St | 0.44mi | 3/2.0 (+1) | 1,582 (-2%) | 2mo | $205,000 | $130 | 65 |
| 2213 Monroe St | 0.47mi | 2/1.0 | 1,699 (+5%) | 7mo | $175,000 | $103 | 64 |
| 2562 Clay St | 0.56mi | 2/1.0 | 1,558 (-4%) | 7mo | $54,000 | $35 | 62 |
| 500 N 16th St | 0.44mi | 2/1.5 | 1,490 (-8%) | 5mo | $139,000 | $93 | 60 |
| 1321 Jefferson St | 0.72mi | 2/1.0 | 1,660 (+3%) | 3mo | $186,550 | $112 | 60 |
| 2432 Madison St | 0.54mi | 3/1.5 (+1) | 1,522 (-6%) | 4mo | $70,000 | $46 | 55 |
| 2544 Trimble St | 0.50mi | 3/2.0 (+1) | 1,755 (+8%) | 2mo | $239,000 | $136 | 52 |
| 2222 Madison St | 0.44mi | 3/2.0 (+1) | 1,451 (-10%) | 2mo | $180,000 | $124 | 52 |
| 2617 Jefferson St | 0.72mi | 3/1.0 (+1) | 1,450 (-10%) | 6mo | $200,000 | $138 | 39 |
| 1008 N 12th St | 0.66mi | 3/2.0 (+1) | 1,793 (+11%) | 8mo | $127,000 | $71 | 35 |
| 2541 Monroe St | 0.64mi | 3/2.0 (+1) | 1,821 (+13%) | 9mo | $200,000 | $110 | 33 |
Match score weights: distance 35% · size 25% · config 20% · recency 20%. Top-matched comps best support the ARV.
Projected returns pro-forma
-3.0% appreciation · 3.0% rent growth · sell at horizon
- IRR
- 8.6%
- Equity multiple
- 1.34×
- Total profit
- $10,421
- Equity at exit
- $16,386
- IRR
- 17.8%
- Equity multiple
- 2.47×
- Total profit
- $45,293
- Equity at exit
- $9,502
Cash invested: $30,772 (down + closing). Projections, not guarantees.
Landlord ↔ Tenant lean methodology
- Overall (STATE)
- 83 Strongly Landlord-Friendly
- State Kentucky
- 83 Strongly Landlord-Friendly · R+16
- County
- — inherits STATE
- City
- — inherits STATE
ZIP-level market 42001
- Home prices YoY
- -24.8%
- Active inventory
- 248
- Price-to-rent
- 6.6×
Monthly cashflow live
- Estimated rent
- $1,383 medium interval (Pro) →
- Mortgage (P&I)
- −$576
- Tax from tax record
- −$26 /mo · $317/yr
- Insurance
- −$46
- HOA
- −$0
- Vacancy / Maint / Mgmt
- −$290
- Net cashflow
- $444
Break-even live
UW: 25.0% down · 7.5% · 30yr · 1.5% tax · 5.0% vac · 8.0% maint · 8.0% mgmt
Financing live
Cash to close
- Down payment
- $27,475
- Closing costs
- $3,297
- Reserves months
- —
- Total cash needed
- —
Loan-product check · same deal, 3 products live
Conventional
25% down · 7.5% · 30yr
- Down + closing
- —
- Monthly P&I
- —
- Monthly cashflow
- —
- DSCR
- —
- Eligible?
- —
Personal DTI + credit; lowest rate.
DSCR
20% down · 8.5% · 30yr
- Down + closing
- —
- Monthly P&I
- —
- Monthly cashflow
- —
- DSCR
- —
- Eligible?
- —
No personal income docs; deal must DSCR.
Hard money
10% down · 12.0% · 12mo
- Down + closing
- —
- Monthly P&I
- —
- Monthly cashflow
- —
- DSCR
- —
- Eligible?
- —
Short-term bridge; refi at stabilization.
Rent comps 2 comps
| Address | Beds | Baths | Sqft | Rent | $/sqft | DOM | Units | Dist |
|---|---|---|---|---|---|---|---|---|
| 1643 Monroe St Apt A Paducah, KY | 2.0 | 1.0 | 1127 | $1,250 | $1.11 | 43d | 1 | 0.45mi |
| 415 N 6th St #100 Paducah, KY | 2.0 | 2.0 | 1500 | $2,000 | $1.33 | 43d | 1 | 1.24mi |
Listing history 17 events
-
2026-06-19days on market $109,900 Active 44 DOM
-
2026-06-18days on market $109,900 Active 43 DOM
-
2026-06-17days on market $109,900 Active 42 DOM
-
2026-06-16days on market $109,900 Active 41 DOM
-
2026-06-15days on market $109,900 Active 40 DOM
Show marketing remark (226 chars)
Selling "as is" condition. Great property for rental or starter home. Two large bedrooms 1 bath, spacious layout. Nice backyard with fire pit and mature trees. Large patio area great for grilling out and gatherings.
-
2026-06-14days on market $109,900 Active 38 DOM
-
2026-06-12days on market $109,900 Active 37 DOM
-
2026-06-09days on market $109,900 Active 34 DOM
-
2026-06-08days on market $109,900 Active 33 DOM
-
2026-06-07pricedays on market $109,900 Active 32 DOM
-
2026-06-03days on market $119,500 Active 28 DOM
-
2026-06-02days on market $119,500 Active 27 DOM
-
2026-06-01days on market $119,500 Active 26 DOM
-
2026-05-31days on market $119,500 Active 25 DOM
-
2026-05-30days on market $119,500 Active 24 DOM
-
2026-05-06$124,900 Active 246-char remark
Show marketing remark (226 chars)
Selling "as is" condition. Great property for rental or starter home. Two large bedrooms 1 bath, spacious layout. Nice backyard with fire pit and mature trees. Large patio area great for grilling out and gatherings.
-
2000-07-01soldstatus $44,000
ⓘ Source: listings_history table (triggers on properties + properties_extension) + one-shot
backfill from property_details.listing_events for pre-trigger history.
Tax reassessment forecast KY · Resets to sale price
- Current annual tax
- $317 · $26/mo
- Projected year-2 tax
- $945 · $79/mo
- Expected delta
- +$628/yr (+$52/mo · 198.0%)
ⓘ Screening estimate from a state-policy table — verify with the county assessor before closing.
Climate risk First Street
- Flood 1/10 Low FEMA zone X · 0% chance over 30 yrs
- Wildfire 3/10 Moderate
- Heat 6/10 Major 7 d/yr ≥108°F today · 20 d/yr by 30 yrs out
- Wind 3/10 Moderate 7% chance of damaging wind over 30 yrs
- Air quality 3/10 Moderate 1 unhealthy d/yr today · 4 by 30 yrs out
Nearby sold comps map
Loading sold comps map…
Walkable amenities ~0.75 mi
Loading nearby amenities…
Taxation est. · year 1
- Rental income
- $16,595
- − Mortgage interest
- −$6,156
- − Property taxes
- −$317
- − Insurance
- −$550
- − Repairs & maintenance
- −$1,328
- − Management
- −$1,328
- − Depreciation
- −$3,197
- Taxable income
- $3,720
- Est. tax owed @ 24.0%
- −$893
- After-tax cash flow
- $4,435/yr
For passive investors: Depreciation is non-cash, so a rental often shows a tax loss while cash-flowing — sheltering income. Rental losses are passive: they offset passive income freely, and up to $25,000/yr can offset ordinary (W-2) income if you actively participate and your MAGI is under $100k (phasing out to $0 by $150k); unused losses carry forward. On sale, claimed depreciation is recaptured at up to 25%, and gains may owe capital-gains tax (a 1031 exchange can defer both). Figures are a year-1 estimate at your 24.0% rate — not tax advice; consult a CPA.
Schools (NCES district)
- District
- Paducah Independent
- NCES district ID
- 2104650
- Math proficiency
- 22% ▼ -14.00%
- Reading proficiency
- 36% ▼ -17.00%
- Median HH income
- $30,067
- Composite
- 23.41/100
- National rank
- #7896
- State rank
- #122 of 165 in KY
Livability — Paducah
- Score
- 68/100
- State rank
- #197
- US rank
- #9780
Category grades
Schools grade is shown separately in the Schools card above.
Census & demographics
- Census place
- Paducah, KY
- County
- McCracken County · 30,856 people
- City population
- 30,856
- Metro
- Paducah, KY-IL
- Population (ZIP)
- 30,856
- Household income
- $71,365
- Rent vs Own
- Severe rent burden
- 1001.0
Population outlook (McCracken County) Hauer SSP2
- Today (2025)
- 64,237 people
- By 2030
- 63,468 · -1.2%
- By 2040
- 61,221 · -4.7%
- By 2050
- 58,432 · -9.0%
- By 2075
- 52,668 · -18.0%
- By 2100
- 44,517 · -30.7%
Race, ethnicity, and origin ACS 2023
- Neighborhood character
- Predominantly White (78%)
- Race & ethnicity
- White 78% Black 13% Two or more races 6% Hispanic / Latino 2% Asian 1%
- Common ancestry
- Lithuanian 2% Italian 2% Serbian 2%
- Foreign-born
- 2% · Canada, China
- Languages at home
- 97% English-only · Spanish 1%
Political lean MEDSL · McCracken
- 2024 margin
- Solid R (+34.9) · D 31.9% · R 66.8% · Other 1.2%
- 2008→2024 swing
- -9.7pp toward R · 2008: -25.2pp · 2024: -34.9pp
- All cycles
- 2024: R+34.9 2020: R+31.7 2016: R+37.2 2012: R+32.5 2008: R+25.2
Not yet ingested
- Civics
- —
Market trends
- HPI YoY
- ▼ -85.23%
- Current HPI
- 258.1706
- Rent YoY
- —
- Metro
- Paducah, KY-IL
- State GDP YoY
- ▲ 1.81%
- F500 in state
- 4
Industry mix (Fortune 500 HQ in KY)
| Industry | F500 HQs | Revenue |
|---|---|---|
| Healthcare | 1 | $118B |
|
||
| Food / Beverage | 1 | $7B |
|
||
Price history
+149.8% since first listed7 events — show timeline
- 2026-06-15 Price Changed $109,900 ImagineMLS
- 2026-06-15 Pending — ImagineMLS
- 2026-06-05 Price Changed $109,900 WKRMLS
- 2026-05-29 Price Changed $119,500 WKRMLS
- 2026-05-06 Listed $124,900 WKRMLS
- 2026-05-06 Listed $124,900 ImagineMLS
- 2000-07-01 Sold (Public Records) $44,000 Public Records
Property tax history
-9.5%/yrLatest (2025): $317 · -0.8% YoY. Source: county tax records.
Cash-flow waterfall
monthlySold comps — $/sqft
last 12 mo · ≤1 miLoading sold comps…