 Duplex
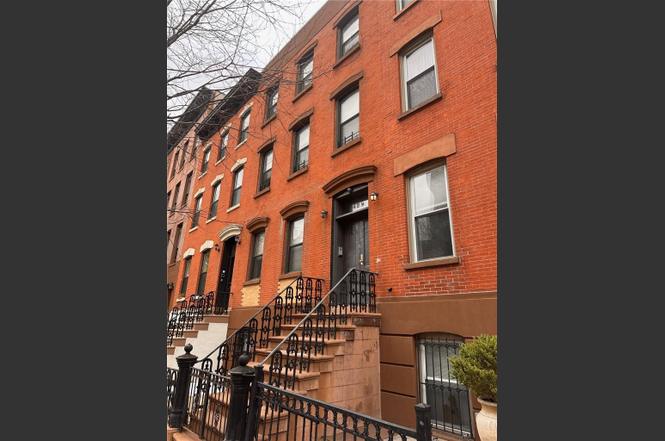
429 E 118th St · New York, NY
Flood risk 6/10 · Moderate
- FEMA flood zone
- X (shaded)
- Chance of flooding over 30 yrs
- 0.7%
- Est. flood insurance / yr
- $507 – $1,088
Fire risk 1/10 · Minimal
- Est. fire insurance / yr
- $691 – $1,283
Heat risk 6/10 · Moderate
- Hot days now (above 99°F)
- 7 days/yr
- Hot days in 30 yrs
- 15 days/yr
Wind risk 6/10 · Moderate
- Chance of severe wind over 30 yrs
- 27.0%
Air-quality risk 4/10 · Minor
- Unhealthy air days now
- 5 days/yr
- Unhealthy air days in 30 yrs
- 6 days/yr
Risk factors via First Street. Map © Google.
Why this score? — see what drove the D grade
The composite is a weighted blend of 9 inputs, each scored 0–100. Each bar is that input's sub-score; the figure is the points it added to the 100-point composite (weight × sub-score).
- Cash flow +9.9/30.0
- ARV discount +7.5/15.0
- Appreciation +6.6/10.0
- Schools +5.0/10.0
- Rent growth +3.9/5.0
- Livability +3.8/5.0
- DSCR +2.8/10.0
- Condition / age +2.5/5.0
- 1% rule +1.6/10.0
$1,850,000
🖨 Deal sheet (PDF) 📄 Offer letter ✓ Due diligence
Multi-family units
County records classify this as Multi-Family (2-4 Unit). Listing-text estimate: 2 units. confirmed
Listing remarks
Nestled in the heart of Harlem. This charming 3-family townhouse (5 floors) offers opportunity for both home ownership and investment in one of New York City's most vibrant neighborhoods. The crown jewel of this property is the spacious duplex unit, perfect for the owner's residence. Boasting 3 bedrooms, it opens onto a delightful deck and a private yard, providing a serene oasis in the bustling cityscape. This classic NYC townhouse is steeped in history and charm, promising a living experience that truly embodies the essence of city living. Conveniently located near iconic eateries like RAO's and Patsy's Pizzeria, indulge in the diverse culinary offerings that Harlem has to offer, right a
Key facts
- Private yard
- Spacious duplex unit
- Built 1899
Tags
Neighborhood map
What this means for you Summary
Snapshot
- This is a 2 × 3-bed/2.0-bath units multifamily listed at $1.85M.
Deal economics
- At list price, monthly cash flow is $-1k ($-14k/yr) — negative. Per door: $-579/mo.
- To cash-flow at today's rent, offer at most $1.65M (11.1% below list).
- To meet the 1% rule (rent ≥ 1% of price), the offer needs to be $1.23M (33.6% below list).
- Recommended offer: $1.23M (33.6% below list) — sets the bar for 1% rule.
- Cap rate 5.5% vs local median 2.6% in New York — top-decile yield for the area; either an underpriced asset or a hidden risk that comps aren't pricing in. Stress-test before assuming the spread holds.
Location & tenants
- Location reads 75/100 on livability (#268 in NY, #4,188 nationally) — a middle-class / working-renter tenant base. Strengths: amenities A+, commute A+, health & safety A; Watch: crime F, cost of living F.
- Zoned schools: Elm Tree Elementary School (math 27% / reading 52%, grade F, #1,444 of 2,108 statewide, top 71%, 806 students, 94% FRL); Mark Twain Is 239 For The Gifted And Talented (math 90% / reading 96%, grade A+, #6 of 729 statewide, top 1%, 1,207 students, 44% FRL); Midwood High School (math 94% / reading 96%, grade A+, #83 of 1,100 statewide, top 8%, 4,062 students, 73% FRL).
- Market conditions: Rents rising fast (+5.6%/yr); 71 active listings in the ZIP; 4,467 units permitted in New York County in 2024 (4,463 in 5+ unit buildings).
- At $12,284/mo this rent would consume 327% of the median local household income ($45k/yr) (locally 3992% of renters already pay >50% of income on rent) — very limited rent-growth headroom before tenants either downsize or default.
Forward outlook
- In year one you build about $73k of equity ($13k loan paydown + $60k appreciation (3.2% local appreciation)).
- New York County population projected at +21% by 2050 — long-run rental-demand tailwind backs the buy-and-hold thesis.
- By year 2, paydown + projected appreciation supports a ~$118k cash-out refi (75% LTV) — recoverable capital for the next deal without selling this one.
Negotiation context
- It's been on market 114 days — a 9% lower offer ($1.68M) is reasonable based on typical stale-listing flexibility.
Risks & watch-outs
- Watch-outs: built in 1899 — expect roof / HVAC / electrical / plumbing capex.
- Climate carrying-cost: major flood risk; major wind risk, 27% chance of damaging wind over 30y; extreme-heat days projected 7→15/yr by 2055 (HVAC capex compounding) — expect insurance premiums to compound above CPI over the hold.
Questions for the listing agent
- What do current leases actually rent for vs. the listed asking? Can we see a recent rent roll and the last 12 months of T-12 income?
- It's been on market 114 days. Have you received any prior offers? Is the seller open to a 34% concession, seller financing, or rate buy-down credit?
- Can we see the unit-by-unit rent roll, current vacancy, and any below-market leases? What's the average tenancy length?
- What capital expenditures (roof, boiler, parking lot, exteriors) have been made in the last 5 years, and what's planned in the next 2?
- Built in 1899 — when were the roof, HVAC, electrical panel, plumbing, and water heater last replaced?
- Why hasn't it sold? Are there any deal-killer items the seller is aware of (foundation, flood, title, zoning, code violations)?
- Is there a deadline driving the sale (1031 exchange, divorce, estate, relocation)? That informs how much negotiation room exists.
- Schools are B-rated — typically a magnet for longer-tenancy family renters. What's the average tenant stay here, and is there a school-zone premium baked into asking?
- Crime grade is F in this area — have there been break-ins, vandalism, or insurance claims at this property in the last 3 years? What carrier currently insures it and at what premium?
- The area grade is low — what's the realistic commute time and amenity access for the typical tenant pool here? Any planned neighborhood developments (good or bad) we should know about?
- What's the average days-on-market for RENTAL listings here right now (not sales)? A rising rental-DOM trend means longer vacancies and softer asking-rent achievability than the comps imply.
- What's the recent tenant-quality profile in this submarket — average credit score on applications, eviction rate, late-payment / NSF rate, and stable-employment percentage? A property-management company in the area should have these aggregated.
- How much new apartment / multifamily construction is in the pipeline within 1–3 miles? Heavy new supply (>2% of stock underway) typically softens rents 12–24 months out; light construction supports rent growth.
Investment metrics
- 1% rule
- 0.66% ✗
- Cap rate
- 5.54%
- Cash-on-cash
- -2.68%
- DSCR
- 0.88
- GRM
- 12.6
CMA / ARV
No comps found within radius.
Projected returns pro-forma
3.23% appreciation · 5.62% rent growth · sell at horizon
- IRR
- 6.7%
- Equity multiple
- 1.39×
- Total profit
- $204,095
- Equity at exit
- $856,050
- IRR
- 10.4%
- Equity multiple
- 2.65×
- Total profit
- $855,419
- Equity at exit
- $1,338,414
Cash invested: $518,000 (down + closing). Projections, not guarantees.
Landlord ↔ Tenant lean methodology
- Overall (CITY)
- 0 Strongly Tenant-Friendly
- State New York
- 15 Strongly Tenant-Friendly · D+10
- County
- — inherits STATE
- City New York
- 0 Strongly Tenant-Friendly · D+34
ZIP-level market 10035
- Home prices YoY
- 1.0%
- Rents YoY
- 5.6%
- Active inventory
- 71
- Price-to-rent
- 25.1×
Monthly cashflow live
- Estimated rent
- $12,284 high interval (Pro) →
- Mortgage (P&I)
- −$9,702
- Tax from tax record
- −$390 /mo · $4,679/yr
- Insurance
- −$771
- HOA
- −$0
- Vacancy / Maint / Mgmt
- −$2,580
- Net cashflow
- $-1,158
Break-even live
Sensitivity live
| Price | -10% $-111 | -5% $-634 | +0% $-1,158 | +5% $-1,682 | +10% $-2,205 |
|---|---|---|---|---|---|
| Rent | -10% $-2,128 | -5% $-1,643 | +0% $-1,158 | +5% $-673 | +10% $-188 |
| Rate | -1.0pp $-226 | -0.5pp $-687 | base $-1,158 | +0.5pp $-1,637 | +1.0pp $-2,125 |
2-unit breakdown (identical units grouped — click to expand)
| Units | Beds | Baths | Est. rent |
|---|---|---|---|
| 2× units | 3 | 2 | $12,284 |
| #1 | 3 | 2 | $6,142 |
| #2 | 3 | 2 | $6,142 |
| Total (2 units) | $12,284 | ||
UW: 25.0% down · 7.5% · 30yr · 1.5% tax · 5.0% vac · 8.0% maint · 8.0% mgmt
Financing live
Cash to close
- Down payment
- $462,500
- Closing costs
- $55,500
- Reserves months
- —
- Total cash needed
- —
Loan-product check · same deal, 3 products live
Conventional
25% down · 7.5% · 30yr
- Down + closing
- —
- Monthly P&I
- —
- Monthly cashflow
- —
- DSCR
- —
- Eligible?
- —
Personal DTI + credit; lowest rate.
DSCR
20% down · 8.5% · 30yr
- Down + closing
- —
- Monthly P&I
- —
- Monthly cashflow
- —
- DSCR
- —
- Eligible?
- —
No personal income docs; deal must DSCR.
Hard money
10% down · 12.0% · 12mo
- Down + closing
- —
- Monthly P&I
- —
- Monthly cashflow
- —
- DSCR
- —
- Eligible?
- —
Short-term bridge; refi at stabilization.
Listing history 3 events
-
2025-01-02soldstatus $1,686,000
-
2024-09-25status Pending
-
2024-06-03$1,850,000 Active
ⓘ Source: listings_history table (triggers on properties + properties_extension) + one-shot
backfill from property_details.listing_events for pre-trigger history.
Tax reassessment forecast NY · Partial reset (capped growth)
- Current annual tax
- $4,679 · $390/mo
- Projected year-2 tax
- $17,972 · $1,498/mo
- Expected delta
- +$13,293/yr (+$1,108/mo · 284.1%)
ⓘ Screening estimate from a state-policy table — verify with the county assessor before closing.
Climate risk First Street
- Flood 6/10 Major FEMA zone X (shaded) · 70% chance over 30 yrs
- Wildfire 1/10 Low
- Heat 6/10 Major 7 d/yr ≥99°F today · 15 d/yr by 30 yrs out
- Wind 6/10 Major 27% chance of damaging wind over 30 yrs
- Air quality 4/10 Moderate 5 unhealthy d/yr today · 6 by 30 yrs out
Nearby sold comps map
Loading sold comps map…
Walkable amenities ~0.75 mi
Loading nearby amenities…
Taxation est. · year 1
- Rental income
- $147,408
- − Mortgage interest
- −$103,629
- − Property taxes
- −$4,679
- − Insurance
- −$9,250
- − Repairs & maintenance
- −$11,793
- − Management
- −$11,793
- − Depreciation
- −$53,818
- Taxable loss
- −$47,554
- Est. tax savings @ 24.0%
- +$11,413
- After-tax cash flow
- $-2,483/yr
For passive investors: Depreciation is non-cash, so a rental often shows a tax loss while cash-flowing — sheltering income. Rental losses are passive: they offset passive income freely, and up to $25,000/yr can offset ordinary (W-2) income if you actively participate and your MAGI is under $100k (phasing out to $0 by $150k); unused losses carry forward. On sale, claimed depreciation is recaptured at up to 25%, and gains may owe capital-gains tax (a 1031 exchange can defer both). Figures are a year-1 estimate at your 24.0% rate — not tax advice; consult a CPA.
Schools (NCES district)
No district data.
Livability — New York
- Score
- 75/100
- State rank
- #268
- US rank
- #4188
Category grades
Schools grade is shown separately in the Schools card above.
Census & demographics
- Census place
- New York, NY
- County
- New York County · 1,599,927 people
- City population
- 7,731,280
- Metro
- New York-Newark-Jersey City, NY-NJ-PA
- Population (ZIP)
- 38,862
- Household income
- $45,121
- Rent vs Own
- Severe rent burden
- 3992.0
Population outlook (New York County) Hauer SSP2
- Today (2025)
- 1,825,725 people
- By 2030
- 1,904,611 · +4.3%
- By 2040
- 2,052,719 · +12.4%
- By 2050
- 2,206,601 · +20.9%
- By 2075
- 2,509,427 · +37.4%
- By 2100
- 2,702,933 · +48.0%
Race, ethnicity, and origin ACS 2023
- Neighborhood character
- Diverse neighborhood (Simpson 0.68)
- Race & ethnicity
- Hispanic / Latino 42% Black 35% White 14% Two or more races 13% Asian 6% Native American 2%
- Hispanic origin (detail)
- Mexican 5% Puerto Rican 16% Dominican 10%
- Common ancestry
- Lithuanian 2% Romanian 1% Scotch-Irish 1%
- Foreign-born
- 23% · Canada, China, Jamaica
- Languages at home
- 54% English-only · Spanish 34% Other Indo-European 3% Russian/Polish/Slavic 2%
Political lean MEDSL · New York
- 2024 margin
- Solid D (+64.8) · D 82.4% · R 17.6%
- 2008→2024 swing
- -7.4pp toward R · 2008: 72.2pp · 2024: 64.8pp
- All cycles
- 2024: D+64.8 2020: D+74.5 2016: D+77.2 2012: D+69.6 2008: D+72.2
Not yet ingested
- Civics
- —
Market trends
- HPI YoY
- ▲ 3.23%
- Current HPI
- 317.1637
- Rent YoY
- ▲ 5.62%
- Metro
- New York-Newark-Jersey City, NY-NJ-PA
- State GDP YoY
- ▲ 2.60%
- F500 in state
- 92
Industry mix (Fortune 500 HQ in NY)
| Industry | F500 HQs | Revenue |
|---|---|---|
| Financial Services | 10 | $950B |
|
||
| Consumer Goods | 9 | $162B |
|
||
| Insurance | 4 | $225B |
|
||
| Telecommunications | 2 | $144B |
|
||
| Pharmaceuticals | 2 | $112B |
|
||
| Media / Entertainment | 2 | $69B |
|
||
Price history
-8.9% since first listed3 events — show timeline
- 2025-01-02 Sold (Public Records) $1,686,000 Public Records
- 2024-09-25 Pending — OneKey® MLS as Distributed by MLS Grid
- 2024-06-03 Listed $1,850,000 OneKey® MLS as Distributed by MLS Grid
Property tax history
+6.1%/yrLatest (2025): $4,679 · +12.9% YoY. Source: county tax records.
Cash-flow waterfall
monthlySold comps — $/sqft
last 12 mo · ≤1 miLoading sold comps…