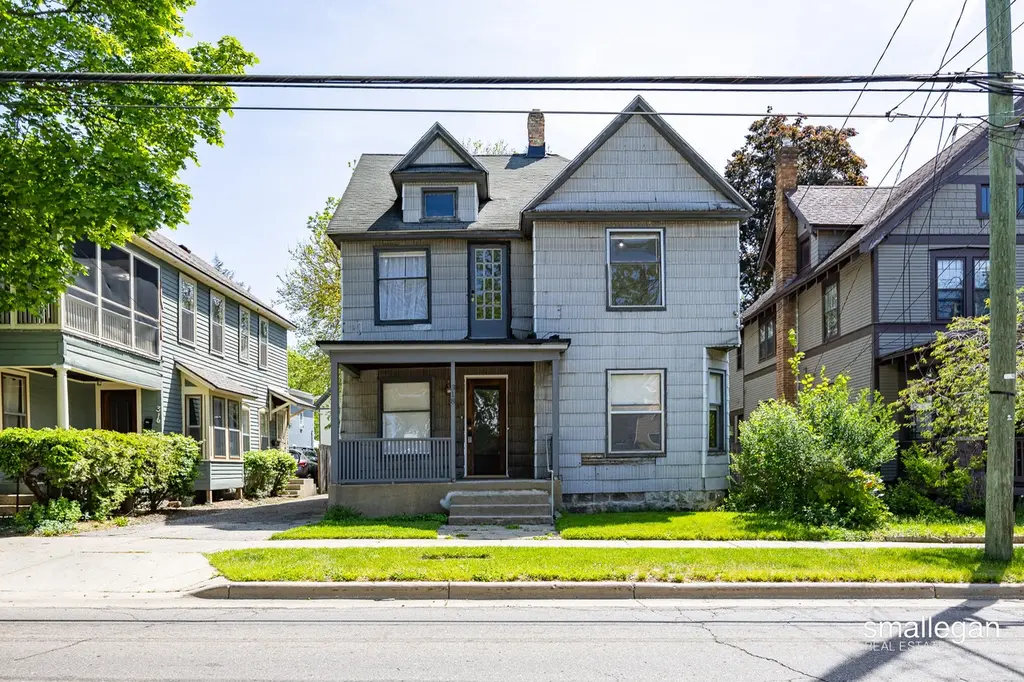
318 Diamond Ave SE · Grand Rapids, MI
Flood risk 1/10 · Minimal
- FEMA flood zone
- X (unshaded)
- Chance of flooding over 30 yrs
- 0.0%
- Est. flood insurance / yr
- $473 – $860
Fire risk 1/10 · Minimal
- Est. fire insurance / yr
- $784 – $1,456
Heat risk 2/10 · Minimal
- Hot days now (above 96°F)
- 7 days/yr
- Hot days in 30 yrs
- 16 days/yr
Wind risk 2/10 · Minimal
- Chance of severe wind over 30 yrs
- —
Air-quality risk 3/10 · Minor
- Unhealthy air days now
- 2 days/yr
- Unhealthy air days in 30 yrs
- 3 days/yr
Risk factors via First Street. Map © Google.
Why this score? — see what drove the D grade
The composite is a weighted blend of 9 inputs, each scored 0–100. Each bar is that input's sub-score; the figure is the points it added to the 100-point composite (weight × sub-score).
- Cash flow +13.2/30.0
- ARV discount +7.5/15.0
- 1% rule +5.4/10.0
- Livability +4.2/5.0
- DSCR +4.0/10.0
- Rent growth +3.2/5.0
- Condition / age +2.5/5.0
- Schools +1.9/10.0
- Appreciation +0.0/10.0
$225,000
🖨 Deal sheet 📄 Offer letter ✓ Due diligence
Listing remarks
Welcome to this 2-unit duplex right in the heart of East Hills. Lower unit has 3 bedrooms and 1 bathroom and upper unit has 2 bedrooms and 1 bathroom. This house has a ton of potential as an owner-occupied home or your next investment property. Both units currently vacant, lower was rented out at $1,600 M2M and upper was rented out at $1,300 M2M. Located just minutes from downtown and the Medical Mile, this property offers convenient access to Cherry Street, Wealthy Street, and Eastown dining, coffee shops, breweries, boutique shopping, and entertainment. Whether you are looking to expand your investment portfolio or offset your mortgage by living in one unit and renting the other, this loc
Key facts
- 3,485 sq ft lot
- 4 parking spots
- Built 1905
Property features AI
Finance
- Financial info: Upper unit rent: $1,300; Lower unit rent: $1,600
Exterior
- Parking: Four parking spaces; Concrete parking surface
- Utilities: Public water; Public sewer / sewer connected; Electricity connected
- Home design: Multi-family residential income property; Vinyl siding construction; 2-story configuration (upper and lower units)
- Construction: Vinyl siding
- Exterior features: Paved road access; Public-maintained road; Residential zoning
Interior
- Bedrooms: Upper unit: 2 bedrooms; Lower unit: 3 bedrooms
- Bathrooms: Upper unit: 1 bathroom; Lower unit: 1 bathroom
- Heating & cooling: Baseboard heating; Natural gas heating
- Interior features: Has a basement; Sidewalks nearby
- Laundry & utility: Laundry available on main and upper levels
Neighborhood map
What this means for you Summary
Snapshot
- This is a 4-bed/2.0-bath single-family listed at $225k.
Deal economics
- At list price, monthly cash flow is $-6 ($-71/yr) — negative.
- To cash-flow at today's rent, offer at most $224k (0.5% below list).
- Meets the 1% rule at list price ($2k rent vs $225k).
- Recommended offer: $224k (0.5% below list) — sets the bar for cash-flow.
- Cap rate 6.3% vs local median 4.5% in Grand Rapids — top-decile yield for the area; either an underpriced asset or a hidden risk that comps aren't pricing in. Stress-test before assuming the spread holds.
Location & tenants
- Location reads 83/100 on livability (#44 in MI, #939 nationally) — a professional / high-income tenant draw. Strengths: amenities A+, commute A+, cost of living A+; Watch: employment C-, crime F.
- Grand Rapids Public Schools (urban): math 15% / reading 29% proficiency, ranked #451 of 540 in MI (top 84%) — low school quality limits family demand, transient renter base, plan for 1-2y turnover; 80% free/reduced lunch — lower-income household profile, screen leases tightly.
- Market conditions: Rents rising (+2.8%/yr); 181 active listings in the ZIP; 16 comparable units currently listed for rent nearby; rentals lingering (median 44d on market — plan ~5-8 weeks vacancy on turnover, expect pricing pressure); 62% of comp listings sitting > 30 days — soft ceiling on asking rent; 2,253 units permitted in Kent County in 2024 (969 in 5+ unit buildings).
- This rent runs 43% of the median local income ($65k/yr) — at the standard rent-burdened threshold; future hikes will face affordability resistance.
Forward outlook
- Local home prices are declining (-3.0%/yr); year-one equity from $2k of loan paydown is wiped out by about $7k of value loss. Plan a longer hold.
- Kent County population projected at +22% by 2050 — long-run rental-demand tailwind backs the buy-and-hold thesis.
Negotiation context
- Only 4 days on market — expect competitive offers; lowballing is unlikely to land.
- 9 sale attempts since 26y ago with the ask held roughly flat each time — persistent listings suggest the price (not the market) is what's stuck; bring a comps-based counter.
- Current owner paid $178k; 26% above their basis — modest negotiation headroom, anchor on the comps not their cost.
Risks & watch-outs
- Watch-outs: property tax is 3.1% of price; built in 1905 — expect roof / HVAC / electrical / plumbing capex.
Questions for the listing agent
- What do current leases actually rent for vs. the listed asking? Can we see a recent rent roll and the last 12 months of T-12 income?
- Built in 1905 — when were the roof, HVAC, electrical panel, plumbing, and water heater last replaced?
- Property tax is high relative to price — has the assessment been appealed recently, and will the sale trigger a re-assessment?
- Is there a deadline driving the sale (1031 exchange, divorce, estate, relocation)? That informs how much negotiation room exists.
- Crime grade is F in this area — have there been break-ins, vandalism, or insurance claims at this property in the last 3 years? What carrier currently insures it and at what premium?
- The area grade is low — what's the realistic commute time and amenity access for the typical tenant pool here? Any planned neighborhood developments (good or bad) we should know about?
- What's the average days-on-market for RENTAL listings here right now (not sales)? A rising rental-DOM trend means longer vacancies and softer asking-rent achievability than the comps imply.
- What's the recent tenant-quality profile in this submarket — average credit score on applications, eviction rate, late-payment / NSF rate, and stable-employment percentage? A property-management company in the area should have these aggregated.
- How much new for-sale + rental construction is in the pipeline within 1–3 miles? Heavy new supply typically softens prices + rents 12–24 months out; constrained supply supports both.
Investment metrics
- 1% rule
- 1.04% ✓
- Cap rate
- 6.26%
- Cash-on-cash
- -0.11%
- DSCR
- 1.00
- GRM
- 8.0
CMA / ARV
No comps found within radius.
Projected returns pro-forma
-3.0% appreciation · 2.82% rent growth · sell at horizon
- IRR
- -16.6%
- Equity multiple
- 0.41×
- Total profit
- $-37,041
- Equity at exit
- $33,548
- IRR
- -8.6%
- Equity multiple
- 0.47×
- Total profit
- $-33,585
- Equity at exit
- $19,454
Cash invested: $63,000 (down + closing). Projections, not guarantees.
Landlord ↔ Tenant lean methodology
- Overall (STATE)
- 62 Landlord-Friendly
- State Michigan
- 62 Landlord-Friendly · EVEN
- County
- — inherits STATE
- City
- — inherits STATE
ZIP-level market 49503
- Rents YoY
- 2.8%
- Active inventory
- 181
- Price-to-rent
- 8.0×
Monthly cashflow live
- Estimated rent
- $2,333 high interval (Pro) →
- Mortgage (P&I)
- −$1,180
- Tax from tax record
- −$575 /mo · $6,905/yr
- Insurance
- −$94
- HOA
- −$0
- Vacancy / Maint / Mgmt
- −$490
- Net cashflow
- $-6
Break-even live
UW: 25.0% down · 7.5% · 30yr · 1.5% tax · 5.0% vac · 8.0% maint · 8.0% mgmt
Financing live
Cash to close
- Down payment
- $56,250
- Closing costs
- $6,750
- Reserves months
- —
- Total cash needed
- —
Loan-product check · same deal, 3 products live
Conventional
25% down · 7.5% · 30yr
- Down + closing
- —
- Monthly P&I
- —
- Monthly cashflow
- —
- DSCR
- —
- Eligible?
- —
Personal DTI + credit; lowest rate.
DSCR
20% down · 8.5% · 30yr
- Down + closing
- —
- Monthly P&I
- —
- Monthly cashflow
- —
- DSCR
- —
- Eligible?
- —
No personal income docs; deal must DSCR.
Hard money
10% down · 12.0% · 12mo
- Down + closing
- —
- Monthly P&I
- —
- Monthly cashflow
- —
- DSCR
- —
- Eligible?
- —
Short-term bridge; refi at stabilization.
Rent comps 16 comps
| Address | Beds | Baths | Sqft | Rent | $/sqft | DOM | Units | Dist |
|---|---|---|---|---|---|---|---|---|
| 258 Orchard Hill St SE Grand Rapids, MI | 3.0 | 1.0 | 1300 | $1,900 | $1.46 | 43d | 1 | 0.18mi |
| 1321 Bemis St SE Grand Rapids, MI | 4.0 | 2.5 | 2367 | $2,700 | $1.14 | 3d | 1 | 0.49mi |
| 414 Paris Ave SE Grand Rapids, MI | 3.0 | 1.5 | 1700 | $2,850 | $1.68 | 43d | 1 | 0.58mi |
| 728 Fuller Ave SE Grand Rapids, MI | 4.0 | 2.0 | 2500 | $2,200 | $0.88 | 43d | 1 | 0.58mi |
| 550 Union Ave SE Grand Rapids, MI | 3.0 | 1.5 | 1743 | $2,800 | $1.61 | 43d | 1 | 0.59mi |
| 729 Bates St SE Unit 1 Grand Rapids, MI | 4.0 | 3.5 | 1576 | $2,395 | $1.52 | 43d | 1 | 0.62mi |
| 325 Norwood Ave SE Grand Rapids, MI | 3.0 | 1.5 | 1398 | $2,700 | $1.93 | 23d | 1 | 0.63mi |
| 1027 Underwood Ave SE Grand Rapids, MI | 4.0 | 2.0 | 1600 | $2,300 | $1.44 | 14d | 1 | 0.95mi |
| 414 Benson Ave NE Grand Rapids, MI | 1.0–3.0 | 1.0–2.0 | 1110 | $2,673 | $2.41 | 43d | 14 | 1.08mi |
| 541 Eastern Ave NE Grand Rapids, MI | 4.0 | 2.0 | 1600 | $2,300 | $1.44 | 43d | 1 | 1.11mi |
| 130 Plymouth Ave NE Grand Rapids, MI | 4.0 | 2.0 | 2116 | $2,750 | $1.30 | 2d | 1 | 1.14mi |
| 425 Woodlawn St SE Grand Rapids, MI | 4.0 | 1.0 | 2072 | $2,200 | $1.06 | 43d | 1 | 1.21mi |
| 209 Division Ave S Grand Rapids, MI | 1.0–3.0 | 1.0–2.0 | 1180 | $1,495 | $1.27 | 21d | 2 | 1.23mi |
| 350 Ionia Ave SW Grand Rapids, MI | 2.0–3.0 | 2.0–3.0 | 1400 | $1,350 | $0.96 | 11d | 2 | 1.31mi |
| 1154 Prospect Ave SE Grand Rapids, MI | 5.0 | 2.0 | 1800 | $2,300 | $1.28 | 43d | 1 | 1.31mi |
| 1400 Rossman Ave SE Grand Rapids, MI | 3.0 | 1.0 | 1400 | $2,200 | $1.57 | 43d | 1 | 1.47mi |
Listing history 29 events
-
2026-06-02status $225,000 Pending 4 DOM
-
2026-06-01days on market $225,000 Active 4 DOM
-
2026-05-31days on market $225,000 Active 3 DOM
-
2026-05-28$225,000 Active
-
2026-01-01historical
-
2025-12-31historical
-
2025-07-20$250,000 Active
-
2025-07-20$250,000 Active
-
2025-07-01status Pending
-
2025-06-30status Pending
-
2025-06-28price $250,000
-
2025-06-28price $250,000
-
2025-06-28historical
-
2025-06-28historical
-
2025-05-08price $275,000
-
2025-05-08price $275,000
-
2024-11-12price $299,000
-
2024-11-11price $299,000
-
2024-10-01$325,000 Active
-
2024-10-01$325,000 Active
-
2020-12-14soldstatus $178,000
-
2020-11-19soldstatus $178,000
-
2020-11-19soldstatus $178,000
-
2020-09-09$187,000
-
2020-09-09$187,000
-
2015-02-13historical
-
2015-02-13historical
-
2005-10-13$84,900
-
2000-04-05$68,365
ⓘ Source: listings_history table (triggers on properties + properties_extension) + one-shot
backfill from property_details.listing_events for pre-trigger history.
Tax reassessment forecast MI · Partial reset (capped growth)
- Current annual tax
- $6,905 · $575/mo
- Projected year-2 tax
- $6,905 · $575/mo
- Expected delta
- $0/yr ($0/mo · 0.0%)
ⓘ Screening estimate from a state-policy table — verify with the county assessor before closing.
Climate risk First Street
- Flood 1/10 Low FEMA zone X (unshaded) · 0% chance over 30 yrs
- Wildfire 1/10 Low
- Heat 2/10 Low 7 d/yr ≥96°F today · 16 d/yr by 30 yrs out
- Wind 2/10 Low
- Air quality 3/10 Moderate 2 unhealthy d/yr today · 3 by 30 yrs out
Nearby sold comps map
Loading sold comps map…
Walkable amenities ~0.75 mi
Loading nearby amenities…
Taxation est. · year 1
- Rental income
- $27,998
- − Mortgage interest
- −$12,603
- − Property taxes
- −$6,905
- − Insurance
- −$1,125
- − Repairs & maintenance
- −$2,240
- − Management
- −$2,240
- − Depreciation
- −$6,545
- Taxable loss
- −$3,661
- Est. tax savings @ 24.0%
- +$879
- After-tax cash flow
- $808/yr
For passive investors: Depreciation is non-cash, so a rental often shows a tax loss while cash-flowing — sheltering income. Rental losses are passive: they offset passive income freely, and up to $25,000/yr can offset ordinary (W-2) income if you actively participate and your MAGI is under $100k (phasing out to $0 by $150k); unused losses carry forward. On sale, claimed depreciation is recaptured at up to 25%, and gains may owe capital-gains tax (a 1031 exchange can defer both). Figures are a year-1 estimate at your 24.0% rate — not tax advice; consult a CPA.
Schools (NCES district)
- District
- Grand Rapids Public Schools
- NCES district ID
- 2616440
- Math proficiency
- 15% ▼ -5.00%
- Reading proficiency
- 29% ▼ -1.00%
- Median HH income
- $40,612
- Composite
- 18.62/100
- National rank
- #8899
- State rank
- #451 of 540 in MI
Livability — Grand Rapids
- Score
- 83/100
- State rank
- #44
- US rank
- #939
Category grades
Schools grade is shown separately in the Schools card above.
Census & demographics
- Census place
- Grand Rapids, MI
- County
- Kent County · 533,805 people
- City population
- 181,325
- Metro
- Grand Rapids-Kentwood, MI
- Population (ZIP)
- 39,489
- Household income
- $64,661
- Rent vs Own
- Severe rent burden
- 1891.0
Population outlook (Kent County) Hauer SSP2
- Today (2025)
- 712,484 people
- By 2030
- 748,618 · +5.1%
- By 2040
- 814,777 · +14.4%
- By 2050
- 868,556 · +21.9%
- By 2075
- 966,487 · +35.7%
- By 2100
- 967,975 · +35.9%
Race, ethnicity, and origin ACS 2023
- Neighborhood character
- Diverse neighborhood (Simpson 0.60)
- Race & ethnicity
- White 59% Hispanic / Latino 19% Two or more races 14% Black 14% Asian 3%
- Hispanic origin (detail)
- Mexican 11% Puerto Rican 1%
- Common ancestry
- Iranian 10% Romanian 7% Slovak 2%
- Foreign-born
- 11% · Canada, South Korea, China
- Languages at home
- 82% English-only · Spanish 15% Chinese 1%
Political lean MEDSL · Kent
- 2024 margin
- Lean D (+5.4) · D 51.8% · R 46.5% · Other 1.7%
- 2008→2024 swing
- +4.8pp toward D · 2008: 0.5pp · 2024: 5.4pp
- All cycles
- 2024: D+5.4 2020: D+6.1 2016: R+3.1 2012: R+7.9 2008: D+0.5
Not yet ingested
- Civics
- —
Market trends
- HPI YoY
- ▼ -347.22%
- Current HPI
- 312.3878
- Rent YoY
- ▲ 2.82%
- Metro
- Grand Rapids-Kentwood, MI
- State GDP YoY
- ▲ 1.37%
- F500 in state
- 28
Industry mix (Fortune 500 HQ in MI)
| Industry | F500 HQs | Revenue |
|---|---|---|
| Automotive Parts | 3 | $48B |
|
||
| Automotive | 2 | $372B |
|
||
| Chemicals | 1 | $45B |
|
||
| Automotive Retail | 1 | $29B |
|
||
| Healthcare / Medical Devices | 1 | $23B |
|
||
| Automotive Technology | 1 | $20B |
|
||
Price history
+229.1% since first listed26 events — show timeline
- 2026-05-28 Listed $225,000 REALCOMP
- 2026-01-01 Listing Removed — MiRealSource-MiMLS
- 2025-12-31 Listing Removed — REALCOMP
- 2025-07-20 Listed $250,000 REALCOMP
- 2025-07-20 Listed $250,000 MiRealSource-MiMLS
- 2025-07-01 Pending — MiRealSource-MiMLS
- 2025-06-30 Pending — REALCOMP
- 2025-06-28 Price Changed $250,000 MiRealSource-MiMLS
- 2025-06-28 Price Changed $250,000 REALCOMP
- 2025-06-28 Listing Removed — REALCOMP
- 2025-06-28 Listing Removed — MiRealSource-MiMLS
- 2025-05-08 Price Changed $275,000 MiRealSource-MiMLS
- 2025-05-08 Price Changed $275,000 REALCOMP
- 2024-11-12 Price Changed $299,000 MiRealSource-MiMLS
- 2024-11-11 Price Changed $299,000 REALCOMP
- 2024-10-01 Listed $325,000 REALCOMP
- 2024-10-01 Listed $325,000 MiRealSource-MiMLS
- 2020-12-14 Sold (Public Records) $178,000 Public Records
- 2020-11-19 Sold (MLS) $178,000 MiRealSource-MiMLS
- 2020-11-19 Sold (MLS) $178,000 REALCOMP
- 2020-09-09 Listed $187,000 MiRealSource-MiMLS
- 2020-09-09 Listed $187,000 REALCOMP
- 2015-02-13 Listing Removed — SW Michigan MLS
- 2015-02-13 Listing Removed — SW Michigan MLS
- 2005-10-13 Listed $84,900 SW Michigan MLS
- 2000-04-05 Listed $68,365 SW Michigan MLS
Property tax history
+14.5%/yrLatest (2025): $6,905 · +1.3% YoY. Source: county tax records.
Cash-flow waterfall
monthlySold comps — $/sqft
last 12 mo · ≤1 miLoading sold comps…