2056 E Miller Rd · Mio, MI
Flood risk 1/10 · Minimal
- FEMA flood zone
- —
- Chance of flooding over 30 yrs
- 0.0%
- Est. flood insurance / yr
- —
Fire risk 4/10 · Minor
- Est. fire insurance / yr
- $784 – $1,456
Heat risk 1/10 · Minimal
- Hot days now (above 94°F)
- 7 days/yr
- Hot days in 30 yrs
- 14 days/yr
Wind risk 1/10 · Minimal
- Chance of severe wind over 30 yrs
- —
Air-quality risk 1/10 · Minimal
- Unhealthy air days now
- 0 days/yr
- Unhealthy air days in 30 yrs
- 0 days/yr
Risk factors via First Street. Map © Google.
Why this score? — see what drove the B+ grade
The composite is a weighted blend of 9 inputs, each scored 0–100. Each bar is that input's sub-score; the figure is the points it added to the 100-point composite (weight × sub-score).
- Cash flow +26.8/30.0
- ARV discount +15.0/15.0
- Appreciation +9.6/10.0
- DSCR +9.2/10.0
- 1% rule +6.0/10.0
- Schools +4.1/10.0
- Livability +3.1/5.0
- Rent growth +2.5/5.0
- Condition / age +2.5/5.0
$99,900
🖨 Deal sheet 📄 Offer letter ✓ Due diligence
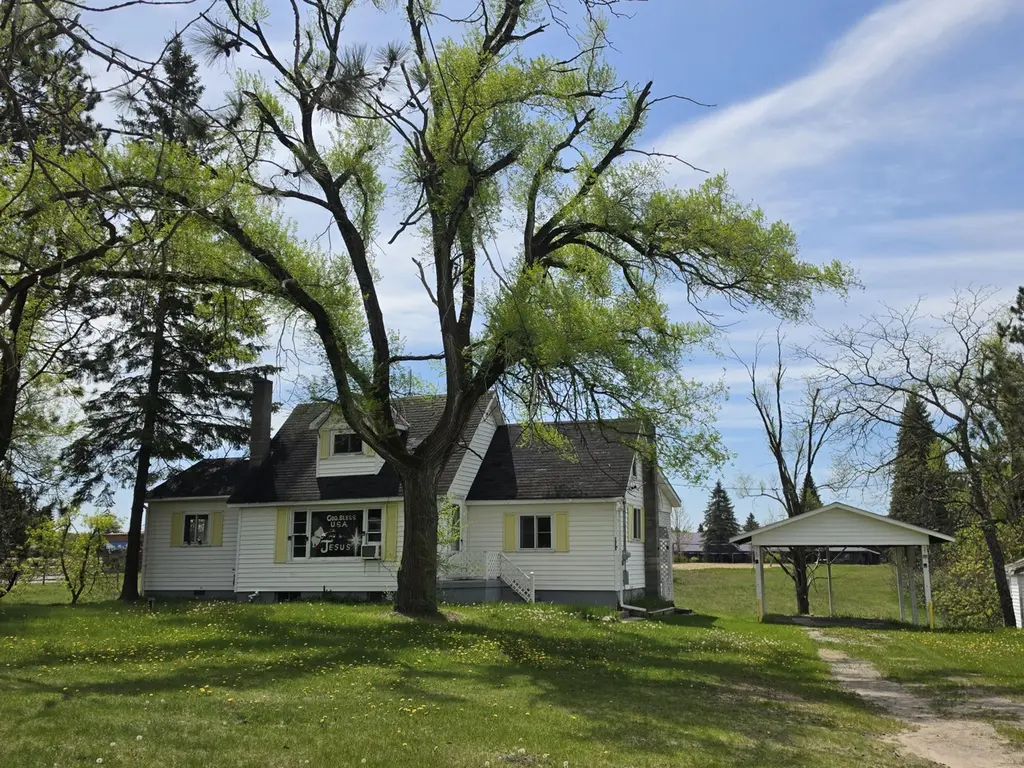
Listing remarks
In-town'' Fairview. Neat and clean older home featuring 2 bedrooms and 2 bathrooms, including a main-level primary bedroom. Complete with a carport, a full basement, and high-efficiency, natural gas, forced-air heating. Situated on a large, 1.7-acre parcel adjoining Comins Township's ''Boney Park. * * * All information herein is deemed accurate but is not warranted. * * *
Key facts
- Natural gas heating
- Adjoining boney park
- Carport
Tags
Property features AI
Exterior
- Utilities: Well water; Septic tank; Cable available
- Home design: Single-family residence; Residential property
- Exterior features: Shed(s); Paved road access; Approximately 1.7-acre lot
Interior
- Kitchen: Refrigerator; Oven; Range
- Bedrooms: Master bedroom downstairs
- Bathrooms: 2 full bathrooms
- Heating & cooling: Forced air heating (natural gas); Ceiling fans; Has cooling
- Interior features: Master bedroom on the main level; Full basement
- Laundry & utility: Laundry in basement
Neighborhood map
What this means for you Summary
Snapshot
- This is a 2-bed/1.0-bath single-family listed at $100k.
Deal economics
- At list price, monthly cash flow is $272 ($3k/yr) — positive.
- The deal already cash-flows at list — no discount required.
- Meets the 1% rule at list price ($1k rent vs $100k).
Location & tenants
- Location reads 61/100 on livability (#557 in MI) — a middle-class / working-renter tenant base. Strengths: cost of living A+, housing A+, crime A; Watch: schools F, amenities F, commute F.
- Fairview Area School District (rural): math 45% / reading 50% proficiency, ranked #244 of 760 in MI (top 32%) — families likely to look elsewhere, expect single-tenant / working-renter base with shorter leases.
- Market conditions: 29 active listings in the ZIP; 1 comparable units currently listed for rent nearby; 29 units permitted in Oscoda County in 2024 (0 in 5+ unit buildings).
Forward outlook
- In year one you build about $10k of equity ($691 loan paydown + $9k appreciation (9.3% local appreciation)).
- Oscoda County population projected at -32% by 2050 — secular population decline; favor cash flow + early exit over multi-decade hold.
- At projected returns (9.3% appreciation + 3.0% rent growth), your $28k cash investment doubles in ~3 years — after that, you're playing with house money.
- By year 4, paydown + projected appreciation supports a ~$35k cash-out refi (75% LTV) — recoverable capital for the next deal without selling this one.
Negotiation context
- Only 2 days on market — expect competitive offers; lowballing is unlikely to land.
Questions for the listing agent
- Is there a deadline driving the sale (1031 exchange, divorce, estate, relocation)? That informs how much negotiation room exists.
- Schools are F-rated, which usually means shorter tenancies and higher turnover. Who's the typical renter profile here, and what's been the actual vacancy rate?
- What's the average days-on-market for RENTAL listings here right now (not sales)? A rising rental-DOM trend means longer vacancies and softer asking-rent achievability than the comps imply.
- What's the recent tenant-quality profile in this submarket — average credit score on applications, eviction rate, late-payment / NSF rate, and stable-employment percentage? A property-management company in the area should have these aggregated.
- How much new for-sale + rental construction is in the pipeline within 1–3 miles? Heavy new supply typically softens prices + rents 12–24 months out; constrained supply supports both.
Investment metrics
- 1% rule
- 1.10% ✓
- Cap rate
- 9.57%
- Cash-on-cash
- 11.69%
- DSCR
- 1.52
- GRM
- 7.6
CMA / ARV
- ARV (on-the-fly)
- $177,429
- Comps found
- 1
Show comp detail 1 sale within ~0.75 mi
| Address | Dist | Beds/Ba | Sqft | Sold | Price | $/sf | Match |
|---|---|---|---|---|---|---|---|
| 2239 N E Miller Rd | 0.42mi | 2/2.0 | 1,055 (-13%) | 8mo | $155,000 | $147 | 49 |
Match score weights: distance 35% · size 25% · config 20% · recency 20%. Top-matched comps best support the ARV.
Projected returns pro-forma
9.27% appreciation · 3.0% rent growth · sell at horizon
- IRR
- 31.5%
- Equity multiple
- 3.39×
- Total profit
- $66,768
- Equity at exit
- $84,727
- IRR
- 27.5%
- Equity multiple
- 7.50×
- Total profit
- $181,785
- Equity at exit
- $177,386
Cash invested: $27,972 (down + closing). Projections, not guarantees.
Landlord ↔ Tenant lean methodology
- Overall (STATE)
- 62 Landlord-Friendly
- State Michigan
- 62 Landlord-Friendly · EVEN
- County
- — inherits STATE
- City
- — inherits STATE
ZIP-level market 48621
- Home prices YoY
- 4.6%
- Active inventory
- 29
- Price-to-rent
- 7.6×
Monthly cashflow live
- Estimated rent
- $1,100 medium interval (Pro) →
- Mortgage (P&I)
- −$524
- Tax from tax record
- −$31 /mo · $372/yr
- Insurance
- −$42
- HOA
- −$0
- Vacancy / Maint / Mgmt
- −$231
- Net cashflow
- $272
Break-even live
UW: 25.0% down · 7.5% · 30yr · 1.5% tax · 5.0% vac · 8.0% maint · 8.0% mgmt
Financing live
Cash to close
- Down payment
- $24,975
- Closing costs
- $2,997
- Reserves months
- —
- Total cash needed
- —
Loan-product check · same deal, 3 products live
Conventional
25% down · 7.5% · 30yr
- Down + closing
- —
- Monthly P&I
- —
- Monthly cashflow
- —
- DSCR
- —
- Eligible?
- —
Personal DTI + credit; lowest rate.
DSCR
20% down · 8.5% · 30yr
- Down + closing
- —
- Monthly P&I
- —
- Monthly cashflow
- —
- DSCR
- —
- Eligible?
- —
No personal income docs; deal must DSCR.
Hard money
10% down · 12.0% · 12mo
- Down + closing
- —
- Monthly P&I
- —
- Monthly cashflow
- —
- DSCR
- —
- Eligible?
- —
Short-term bridge; refi at stabilization.
Rent comps 1 comps
| Address | Beds | Baths | Sqft | Rent | $/sqft | DOM | Units | Dist |
|---|---|---|---|---|---|---|---|---|
| 2117 E Miller Rd Unit MIL-2117 Fairview, MI | 2.0 | 1.0 | 900 | $1,100 | $1.22 | 43d | 1 | 0.13mi |
Listing history 1 events
-
2026-05-26$99,900 Active
ⓘ Source: listings_history table (triggers on properties + properties_extension) + one-shot
backfill from property_details.listing_events for pre-trigger history.
Tax reassessment forecast MI · Partial reset (capped growth)
- Current annual tax
- $372 · $31/mo
- Projected year-2 tax
- $955 · $80/mo
- Expected delta
- +$583/yr (+$49/mo · 156.8%)
ⓘ Screening estimate from a state-policy table — verify with the county assessor before closing.
Climate risk First Street
- Flood 1/10 Low 0% chance over 30 yrs
- Wildfire 4/10 Moderate
- Heat 1/10 Low 7 d/yr ≥94°F today · 14 d/yr by 30 yrs out
- Wind 1/10 Low
- Air quality 1/10 Low 0 unhealthy d/yr today · 0 by 30 yrs out
Nearby sold comps map
Loading sold comps map…
Walkable amenities ~0.75 mi
Loading nearby amenities…
Taxation est. · year 1
- Rental income
- $13,200
- − Mortgage interest
- −$5,596
- − Property taxes
- −$372
- − Insurance
- −$500
- − Repairs & maintenance
- −$1,056
- − Management
- −$1,056
- − Depreciation
- −$2,906
- Taxable income
- $1,714
- Est. tax owed @ 24.0%
- −$411
- After-tax cash flow
- $2,858/yr
For passive investors: Depreciation is non-cash, so a rental often shows a tax loss while cash-flowing — sheltering income. Rental losses are passive: they offset passive income freely, and up to $25,000/yr can offset ordinary (W-2) income if you actively participate and your MAGI is under $100k (phasing out to $0 by $150k); unused losses carry forward. On sale, claimed depreciation is recaptured at up to 25%, and gains may owe capital-gains tax (a 1031 exchange can defer both). Figures are a year-1 estimate at your 24.0% rate — not tax advice; consult a CPA.
Schools (NCES district)
- District
- Fairview Area School District
- NCES district ID
- 2610560
- Math proficiency
- 45% ▲ 5.00%
- Reading proficiency
- 50% ▲ 5.00%
- Median HH income
- $35,353
- Composite
- 41.42/100
- National rank
- #7306
- State rank
- #244 of 760 in MI
Livability — Mio
- Score
- 61/100
- State rank
- #557
- US rank
- #17534
Category grades
Schools grade is shown separately in the Schools card above.
Census & demographics
- Population (ZIP)
- 1,087
Population outlook (Oscoda County) Hauer SSP2
- Today (2025)
- 7,410 people
- By 2030
- 6,884 · -7.1%
- By 2040
- 5,853 · -21.0%
- By 2050
- 5,055 · -31.8%
- By 2075
- 3,832 · -48.3%
- By 2100
- 2,863 · -61.4%
Race, ethnicity, and origin ACS 2023
- Neighborhood character
- Predominantly White (92%)
- Race & ethnicity
- White 92% Two or more races 5% Hispanic / Latino 3%
- Common ancestry
- Lithuanian 6% Romanian 5% Italian 4%
- Foreign-born
- 1% · Vietnam
- Languages at home
- 96% English-only · German/W. Germanic 2% Spanish 1%
Political lean MEDSL · Oscoda
- 2024 margin
- Solid R (+44.3) · D 27.2% · R 71.6% · Other 1.2%
- 2008→2024 swing
- -34.3pp toward R · 2008: -10.0pp · 2024: -44.3pp
- All cycles
- 2024: R+44.3 2020: R+43.6 2016: R+44.3 2012: R+16.2 2008: R+10.0
Not yet ingested
- Civics
- —
Market trends
- HPI YoY
- ▲ 9.27%
- Current HPI
- 210.9497
- Rent YoY
- —
- Metro
- —
- State GDP YoY
- ▲ 1.37%
- F500 in state
- 28
Industry mix (Fortune 500 HQ in MI)
| Industry | F500 HQs | Revenue |
|---|---|---|
| Automotive Parts | 3 | $48B |
|
||
| Automotive | 2 | $372B |
|
||
| Chemicals | 1 | $45B |
|
||
| Automotive Retail | 1 | $29B |
|
||
| Healthcare / Medical Devices | 1 | $23B |
|
||
| Automotive Technology | 1 | $20B |
|
||
Price history
1 event — show timeline
- 2026-05-26 Listed $99,900 WWMLS
Property tax history
+2.3%/yrLatest (2025): $372 · -48.4% YoY. Source: county tax records.
Cash-flow waterfall
monthlySold comps — $/sqft
last 12 mo · ≤1 miLoading sold comps…