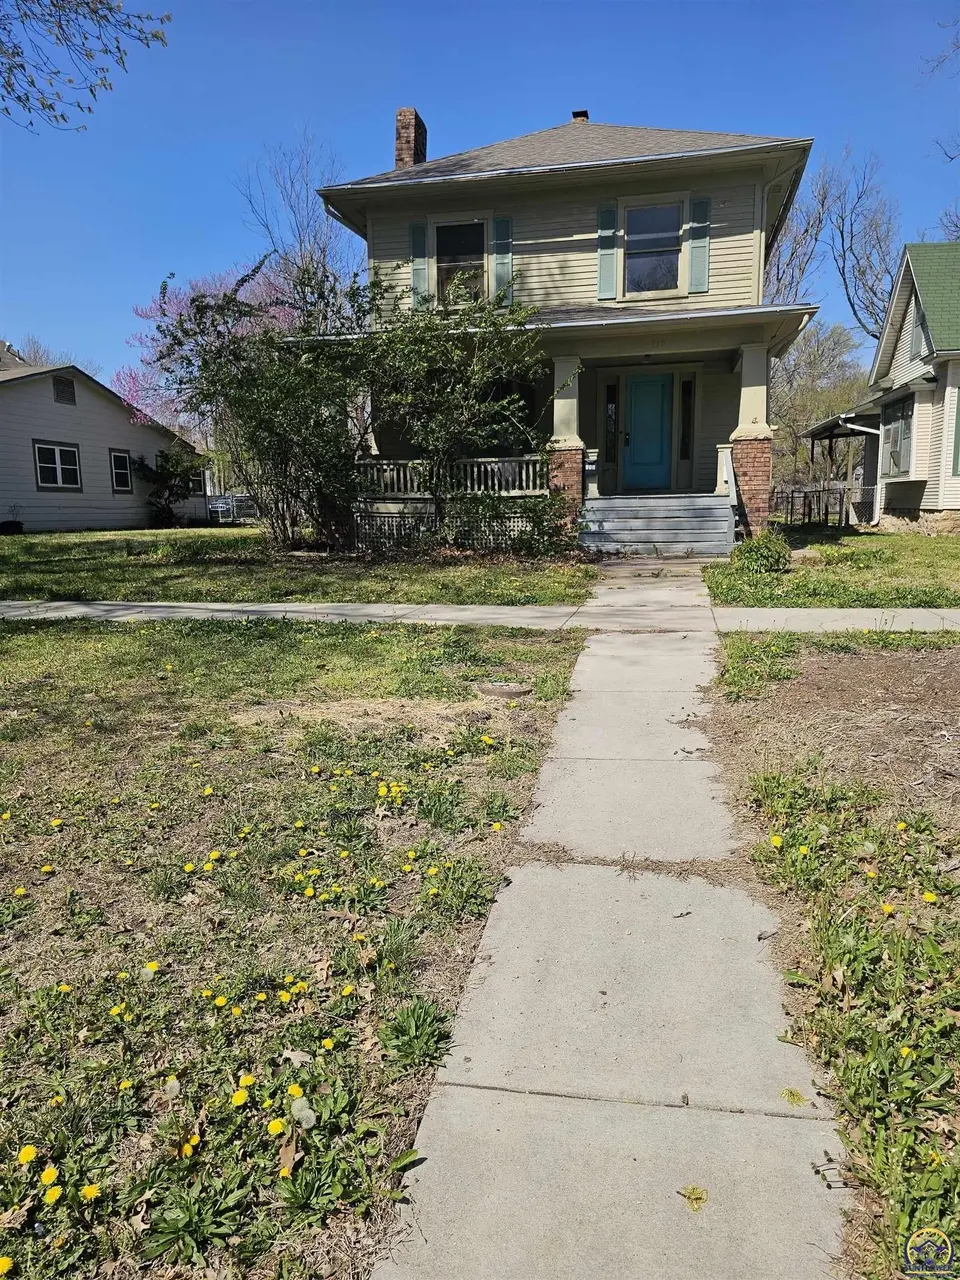
713 SW Clay St · Topeka, KS
Flood risk 1/10 · Minimal
- FEMA flood zone
- X (unshaded)
- Chance of flooding over 30 yrs
- 0.0%
- Est. flood insurance / yr
- $473 – $860
Fire risk 1/10 · Minimal
- Est. fire insurance / yr
- $1,154 – $2,142
Heat risk 4/10 · Minor
- Hot days now (above 107°F)
- 7 days/yr
- Hot days in 30 yrs
- 15 days/yr
Wind risk 2/10 · Minimal
- Chance of severe wind over 30 yrs
- —
Air-quality risk 2/10 · Minimal
- Unhealthy air days now
- 1 days/yr
- Unhealthy air days in 30 yrs
- 2 days/yr
Risk factors via First Street. Map © Google.
Why this score? — see what drove the B- grade
The composite is a weighted blend of 9 inputs, each scored 0–100. Each bar is that input's sub-score; the figure is the points it added to the 100-point composite (weight × sub-score).
- Cash flow +27.0/30.0
- ARV discount +15.0/15.0
- DSCR +9.3/10.0
- 1% rule +6.7/10.0
- Livability +3.5/5.0
- Rent growth +2.5/5.0
- Condition / age +2.5/5.0
- Schools +1.7/10.0
- Appreciation +0.0/10.0
$101,240
🖨 Deal sheet (PDF) 📄 Offer letter ✓ Due diligence
Listing remarks MLS
Old Charm Home in Central Topeka, with 3 bedrooms 2 baths. Fireplace in living room to keep you toasty in the winters. Large dining area off the kitchen for a more formal dining. . Fenced back yard. Home needs a caring hand to enhance the potential of this home.
Key facts
- New hot water tank
- New sewer
- Large kitchen
Tags
Property features AI
Exterior
- Parking: Detached 2-car garage
- Utilities: Public water; Public sewer; Cable available
- Home design: Single-family residence; Residential property
- Construction: Frame and plaster construction
- Exterior features: Partial privacy chain-link fence; Fenced yard
Interior
- Kitchen: Gas range; Refrigerator
- Flooring: Hardwood; Vinyl
- Bathrooms: 2 full bathrooms
- Heating & cooling: Central air conditioning
- Interior features: Wood-burning fireplace in the living room; Basement
- Laundry & utility: Laundry in basement; Gas water heater
Neighborhood map
What this means for you Summary
Snapshot
- This is a 3-bed/2.0-bath single-family listed at $101k.
Deal economics
- At list price, monthly cash flow is $284 ($3k/yr) — positive.
- The deal already cash-flows at list — no discount required.
- Meets the 1% rule at list price ($1k rent vs $101k).
- Recommended offer: $100k (1.5% below list) — sets the bar for market timing.
- Cap rate 9.7% vs local median 4.3% in Topeka — top-decile yield for the area; either an underpriced asset or a hidden risk that comps aren't pricing in. Stress-test before assuming the spread holds.
Location & tenants
- Location reads 69/100 on livability (#195 in KS) — a middle-class / working-renter tenant base. Strengths: cost of living A+, housing A+, health & safety A+; Watch: employment C-, crime F, commute F.
- Topeka Public Schools (urban): math 17% / reading 23% proficiency, ranked #158 of 169 in KS (top 94%) — low school quality limits family demand, transient renter base, plan for 1-2y turnover; 69% free/reduced lunch — lower-income household profile, screen leases tightly.
- Zoned schools: Lowman Hill Elem (math 17% / reading 22%, grade F, #593 of 684 statewide, top 89%, 308 students, 88% FRL); Robinson Middle School (math 10% / reading 19%, grade F, #180 of 219 statewide, top 83%, 360 students, 84% FRL); Topeka High (math 11% / reading 20%, grade F, #248 of 327 statewide, top 76%, 1,514 students, 72% FRL).
- Market conditions: 67 active listings in the ZIP; 9 comparable units currently listed for rent nearby; rentals at typical pace (median 22d on market — plan ~3-4 weeks tenant-placement turnaround); 219 units permitted in Shawnee County in 2024 (25 in 5+ unit buildings).
Forward outlook
- Local home prices are declining (-3.0%/yr); year-one equity from $700 of loan paydown is wiped out by about $3k of value loss. Plan a longer hold.
- Shawnee County population projected to shrink 7% by 2050 — rents likely to lag national; underwrite the cash flow, not the appreciation.
- At projected returns (-3.0% appreciation + 3.0% rent growth), your $28k cash investment doubles in ~10 years — after that, you're playing with house money.
Negotiation context
- It's been on market 30 days — a 2% lower offer ($100k) is reasonable based on typical stale-listing flexibility.
- 2 sale attempts since 12y ago with the ask held roughly flat each time — persistent listings suggest the price (not the market) is what's stuck; bring a comps-based counter.
- Current owner paid $40k; list at $101k implies a 156% gain — meaningful room to come down on a strong offer.
Risks & watch-outs
- Watch-outs: built in 1890 — expect roof / HVAC / electrical / plumbing capex.
Questions for the listing agent
- Built in 1890 — when were the roof, HVAC, electrical panel, plumbing, and water heater last replaced?
- Is there a deadline driving the sale (1031 exchange, divorce, estate, relocation)? That informs how much negotiation room exists.
- Schools are D-rated, which usually means shorter tenancies and higher turnover. Who's the typical renter profile here, and what's been the actual vacancy rate?
- Crime grade is F in this area — have there been break-ins, vandalism, or insurance claims at this property in the last 3 years? What carrier currently insures it and at what premium?
- What's the average days-on-market for RENTAL listings here right now (not sales)? A rising rental-DOM trend means longer vacancies and softer asking-rent achievability than the comps imply.
- What's the recent tenant-quality profile in this submarket — average credit score on applications, eviction rate, late-payment / NSF rate, and stable-employment percentage? A property-management company in the area should have these aggregated.
- How much new for-sale + rental construction is in the pipeline within 1–3 miles? Heavy new supply typically softens prices + rents 12–24 months out; constrained supply supports both.
Investment metrics
- 1% rule
- 1.17% ✓
- Cap rate
- 9.66%
- Cash-on-cash
- 12.02%
- DSCR
- 1.53
- GRM
- 7.1
CMA / ARV
- ARV (on-the-fly)
- $142,956
- Comps found
- 2
Show comp detail 2 sales within ~0.75 mi
| Address | Dist | Beds/Ba | Sqft | Sold | Price | $/sf | Match |
|---|---|---|---|---|---|---|---|
| 1020 / 1024 SW Fillmore St | 0.37mi | 3/1.0 | 1,630 (-13%) | 2mo | $124,000 | $76 | 55 |
| 801 SW Lindenwood Ave | 0.72mi | 4/2.0 (+1) | 2,052 (+9%) | 7mo | $124,900 | $61 | 41 |
Match score weights: distance 35% · size 25% · config 20% · recency 20%. Top-matched comps best support the ARV.
Projected returns pro-forma
-3.0% appreciation · 3.0% rent growth · sell at horizon
- IRR
- 1.5%
- Equity multiple
- 1.06×
- Total profit
- $1,665
- Equity at exit
- $15,095
- IRR
- 11.1%
- Equity multiple
- 1.87×
- Total profit
- $24,681
- Equity at exit
- $8,753
Cash invested: $28,347 (down + closing). Projections, not guarantees.
Landlord ↔ Tenant lean methodology
- Overall (STATE)
- 83 Strongly Landlord-Friendly
- State Kansas
- 83 Strongly Landlord-Friendly · R+10
- County
- — inherits STATE
- City
- — inherits STATE
ZIP-level market 66606
- Home prices YoY
- -34.5%
- Active inventory
- 67
- Price-to-rent
- 7.1×
Monthly cashflow live
- Estimated rent
- $1,181 high interval (Pro) →
- Mortgage (P&I)
- −$531
- Tax from tax record
- −$76 /mo · $909/yr
- Insurance
- −$42
- HOA
- −$0
- Vacancy / Maint / Mgmt
- −$248
- Net cashflow
- $284
Break-even live
Sensitivity live
| Price | -10% $341 | -5% $313 | +0% $284 | +5% $255 | +10% $227 |
|---|---|---|---|---|---|
| Rent | -10% $191 | -5% $237 | +0% $284 | +5% $331 | +10% $377 |
| Rate | -1.0pp $335 | -0.5pp $310 | base $284 | +0.5pp $258 | +1.0pp $231 |
UW: 25.0% down · 7.5% · 30yr · 1.5% tax · 5.0% vac · 8.0% maint · 8.0% mgmt
Financing live
Cash to close
- Down payment
- $25,310
- Closing costs
- $3,037
- Reserves months
- —
- Total cash needed
- —
Loan-product check · same deal, 3 products live
Conventional
25% down · 7.5% · 30yr
- Down + closing
- —
- Monthly P&I
- —
- Monthly cashflow
- —
- DSCR
- —
- Eligible?
- —
Personal DTI + credit; lowest rate.
DSCR
20% down · 8.5% · 30yr
- Down + closing
- —
- Monthly P&I
- —
- Monthly cashflow
- —
- DSCR
- —
- Eligible?
- —
No personal income docs; deal must DSCR.
Hard money
10% down · 12.0% · 12mo
- Down + closing
- —
- Monthly P&I
- —
- Monthly cashflow
- —
- DSCR
- —
- Eligible?
- —
Short-term bridge; refi at stabilization.
Rent comps 9 comps
| Address | Beds | Baths | Sqft | Rent | $/sqft | DOM | Units | Dist |
|---|---|---|---|---|---|---|---|---|
| 822 SW 8th Ave Topeka, KS | 3.0 | 1.5 | 1600 | $1,025 | $0.64 | 22d | 1 | 0.23mi |
| 416 SW Clay St Topeka, KS | 3.0 | 1.0 | 1639 | $1,025 | $0.63 | 22d | 1 | 0.28mi |
| 111 NW Quinton Ave Topeka, KS | 3.0 | 1.5 | 1232 | $1,045 | $0.85 | 22d | 1 | 0.69mi |
| 937 SW Jewell Ave Topeka, KS | 3.0 | 1.0 | 1297 | $1,295 | $1.00 | 22d | 1 | 0.69mi |
| 1268 SW Western Ave Unit 1A Topeka, KS | 2.0 | 1.0 | 1404 | $1,000 | $0.71 | 22d | 1 | 0.76mi |
| 1275 SW Mulvane St Topeka, KS | 3.0 | 1.5 | 1791 | $1,350 | $0.75 | 22d | 1 | 0.95mi |
| 1624 SW Polk St Topeka, KS | 3.0 | 2.0 | 1288 | $1,350 | $1.05 | 22d | 1 | 1.16mi |
| 1647 SW Buchanan St Topeka, KS | 3.0 | 2.0 | 1550 | $1,395 | $0.90 | 22d | 1 | 1.19mi |
| 1936 SW Clay St Topeka, KS | 3.0 | 1.0 | 1572 | $1,000 | $0.64 | 22d | 1 | 1.48mi |
Listing history 19 events
-
2026-06-19days on market $101,240 Active 30 DOM
-
2026-06-18days on market $101,240 Active 29 DOM
-
2026-06-17days on market $101,240 Active 28 DOM
-
2026-06-16days on market $101,240 Active 27 DOM
-
2026-06-15days on market $101,240 Active 26 DOM
-
2026-06-14days on market $101,240 Active 24 DOM
-
2026-06-13days on market $101,240 Active 23 DOM
-
2026-06-10days on market $101,240 Active 21 DOM
-
2026-06-09days on market $101,240 Active 20 DOM
-
2026-06-08days on market $101,240 Active 19 DOM
-
2026-06-07days on market $101,240 Active 18 DOM
-
2026-06-02days on market $101,240 Active 13 DOM
-
2026-06-01days on market $101,240 Active 12 DOM
-
2026-05-31days on market $101,240 Active 11 DOM
-
2026-05-30days on market $101,240 Active 10 DOM
-
2026-05-20$101,240 Active
-
2014-06-26soldstatus 263-char remark
Show marketing remark (263 chars)
Old Charm Home in Central Topeka, with 3 bedrooms 2 baths. Fireplace in living room to keep you toasty in the winters. Large dining area off the kitchen for a more formal dining. . Fenced back yard. Home needs a caring hand to enhance the potential of this home.
-
2014-03-21$24,900 263-char remark
Show marketing remark (263 chars)
Old Charm Home in Central Topeka, with 3 bedrooms 2 baths. Fireplace in living room to keep you toasty in the winters. Large dining area off the kitchen for a more formal dining. . Fenced back yard. Home needs a caring hand to enhance the potential of this home.
-
1994-07-01soldstatus $39,500
ⓘ Source: listings_history table (triggers on properties + properties_extension) + one-shot
backfill from property_details.listing_events for pre-trigger history.
Tax reassessment forecast KS · Resets to sale price
- Current annual tax
- $909 · $76/mo
- Projected year-2 tax
- $1,427 · $119/mo
- Expected delta
- +$518/yr (+$43/mo · 57.0%)
ⓘ Screening estimate from a state-policy table — verify with the county assessor before closing.
Climate risk First Street
- Flood 1/10 Low FEMA zone X (unshaded) · 0% chance over 30 yrs
- Wildfire 1/10 Low
- Heat 4/10 Moderate 7 d/yr ≥107°F today · 15 d/yr by 30 yrs out
- Wind 2/10 Low
- Air quality 2/10 Low 1 unhealthy d/yr today · 2 by 30 yrs out
Nearby sold comps map
Loading sold comps map…
Walkable amenities ~0.75 mi
Loading nearby amenities…
Taxation est. · year 1
- Rental income
- $14,169
- − Mortgage interest
- −$5,671
- − Property taxes
- −$909
- − Insurance
- −$506
- − Repairs & maintenance
- −$1,134
- − Management
- −$1,134
- − Depreciation
- −$2,945
- Taxable income
- $1,870
- Est. tax owed @ 24.0%
- −$449
- After-tax cash flow
- $2,958/yr
For passive investors: Depreciation is non-cash, so a rental often shows a tax loss while cash-flowing — sheltering income. Rental losses are passive: they offset passive income freely, and up to $25,000/yr can offset ordinary (W-2) income if you actively participate and your MAGI is under $100k (phasing out to $0 by $150k); unused losses carry forward. On sale, claimed depreciation is recaptured at up to 25%, and gains may owe capital-gains tax (a 1031 exchange can defer both). Figures are a year-1 estimate at your 24.0% rate — not tax advice; consult a CPA.
Schools (NCES district)
- District
- Topeka Public Schools
- NCES district ID
- 2012260
- Math proficiency
- 17% ▼ -8.00%
- Reading proficiency
- 23% ▼ -2.00%
- Median HH income
- $37,405
- Composite
- 16.69/100
- National rank
- #9167
- State rank
- #158 of 169 in KS
Livability — Topeka
- Score
- 69/100
- State rank
- #195
- US rank
- #8848
Category grades
Schools grade is shown separately in the Schools card above.
Census & demographics
- Census place
- Topeka, KS
- County
- Shawnee County · 118,130 people
- City population
- 118,130
- Metro
- Topeka, KS
- Population (ZIP)
- 9,842
- Household income
- $57,169
- Rent vs Own
- Severe rent burden
- 521.0
Population outlook (Shawnee County) Hauer SSP2
- Today (2025)
- 179,277 people
- By 2030
- 177,762 · -0.8%
- By 2040
- 172,341 · -3.9%
- By 2050
- 166,330 · -7.2%
- By 2075
- 152,417 · -15.0%
- By 2100
- 134,782 · -24.8%
Race, ethnicity, and origin ACS 2023
- Neighborhood character
- Predominantly White (79%)
- Race & ethnicity
- White 79% Hispanic / Latino 9% Two or more races 7% Black 6% Native American 1%
- Hispanic origin (detail)
- Mexican 8%
- Common ancestry
- Lithuanian 2% Slovak 1% Italian 1%
- Foreign-born
- 2% · Canada
- Languages at home
- 97% English-only · Spanish 2%
Political lean MEDSL · Shawnee
- 2024 margin
- Toss-up / Even · D 49.3% · R 48.8% · Other 2.0%
- 2008→2024 swing
- +0.8pp no change · 2008: -0.3pp · 2024: 0.5pp
- All cycles
- 2024: D+0.5 2020: D+3.0 2016: R+2.8 2012: R+1.7 2008: R+0.3
Not yet ingested
- Civics
- —
Market trends
- HPI YoY
- ▼ -120.02%
- Current HPI
- 227.5883
- Rent YoY
- —
- Metro
- Topeka, KS
- State GDP YoY
- —
- F500 in state
- 0
Price history
+156.3% since first listed4 events — show timeline
- 2026-05-20 Listed $101,240 Sunflower MLS as distributed by MLS GRID
- 2014-06-26 Sold (MLS) — Sunflower MLS as distributed by MLS GRID
- 2014-03-21 Listed $24,900 Sunflower MLS as distributed by MLS GRID
- 1994-07-01 Sold (Public Records) $39,500 Public Records
Property tax history
-1.8%/yrLatest (2025): $909 · +6.8% YoY. Source: county tax records.
Cash-flow waterfall
monthlySold comps — $/sqft
last 12 mo · ≤1 miLoading sold comps…