2233 Homewood Ave · Baltimore, MD
Flood risk 1/10 · Minimal
- FEMA flood zone
- X (unshaded)
- Chance of flooding over 30 yrs
- 0.0%
- Est. flood insurance / yr
- $473 – $860
Fire risk 1/10 · Minimal
- Est. fire insurance / yr
- $755 – $1,403
Heat risk 7/10 · Major
- Hot days now (above 103°F)
- 7 days/yr
- Hot days in 30 yrs
- 15 days/yr
Wind risk 6/10 · Moderate
- Chance of severe wind over 30 yrs
- 27.0%
Air-quality risk 4/10 · Minor
- Unhealthy air days now
- 6 days/yr
- Unhealthy air days in 30 yrs
- 7 days/yr
Risk factors via First Street. Map © Google.
Why this score? — see what drove the D grade
The composite is a weighted blend of 9 inputs, each scored 0–100. Each bar is that input's sub-score; the figure is the points it added to the 100-point composite (weight × sub-score).
- Cash flow +19.2/30.0
- DSCR +6.1/10.0
- 1% rule +4.8/10.0
- Livability +3.8/5.0
- Rent growth +2.9/5.0
- Condition / age +2.5/5.0
- ARV discount +1.3/15.0
- Schools +1.0/10.0
- Appreciation +0.0/10.0
$209,900
🖨 Deal sheet 📄 Offer letter ✓ Due diligence
Listing remarks MLS
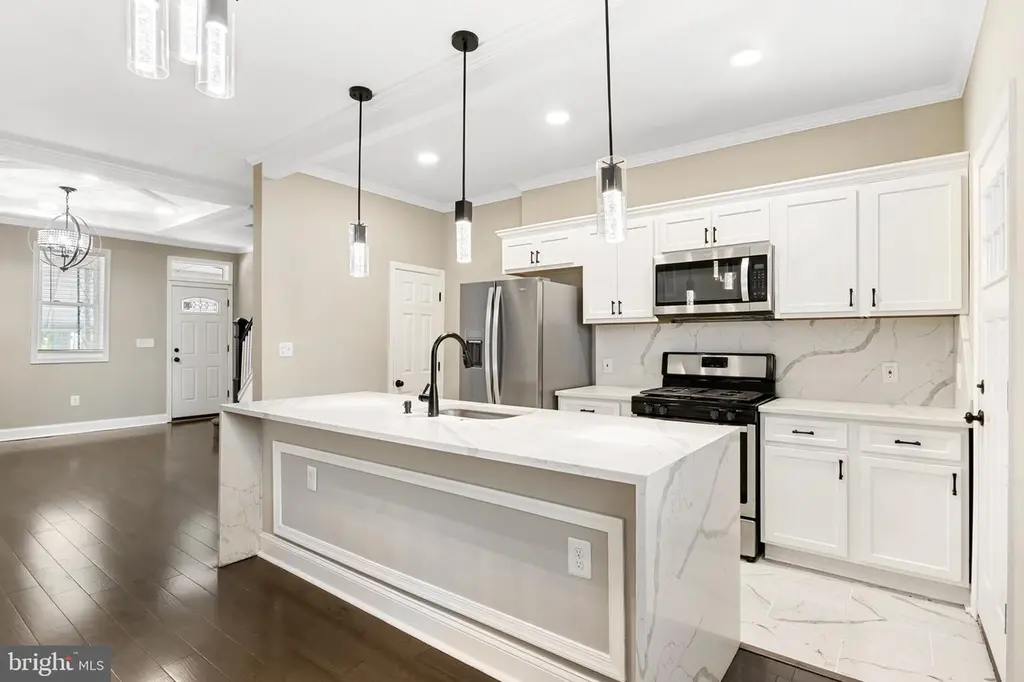
Step into this beautifully updated two-bedroom, one-bath home in the heart of Baltimore City, featuring high-end finishes throughout. Enjoy your morning coffee on one of two private balconies or relax on the welcoming front porch. Inside, you’ll find new appliances, elegant quartz countertops, and the warm ambiance of an electronic fireplace. Plus, you’ll have the convenience of off-street parking. Perfect for those who appreciate a touch of luxury and comfort in every detail.
Key facts
- Built 1920
- Listed 98 days
Neighborhood map
What this means for you Summary
Snapshot
- This is a 3-bed/2.0-bath townhouse listed at $210k.
Deal economics
- At list price, monthly cash flow is $229 ($3k/yr) — positive.
- The deal already cash-flows at list — no discount required.
- To meet the 1% rule (rent ≥ 1% of price), the offer needs to be $207k (1.6% below list).
- Recommended offer: $191k (9.0% below list) — sets the bar for market timing.
- Cap rate 7.6% vs local median 6.0% in Baltimore — meaningfully above typical; check what's discounted (condition, days-on-market, listing class) to confirm the premium yield is real.
Location & tenants
- Location reads 76/100 on livability (#90 in MD, #3,396 nationally) — a middle-class / working-renter tenant base. Strengths: amenities A+, commute A+, housing A+; Watch: schools D, crime F.
- Baltimore City Public Schools (urban): math 7% / reading 16% proficiency, ranked #24 of 24 in MD (top 100%) — low school quality limits family demand, transient renter base, plan for 1-2y turnover; 79% free/reduced lunch — lower-income household profile, screen leases tightly.
- Market conditions: Rents rising (+1.6%/yr); 325 active listings in the ZIP; 40 comparable units currently listed for rent nearby; rentals at typical pace (median 24d on market — plan ~3-4 weeks tenant-placement turnaround); 42% of comp listings sitting > 30 days — soft ceiling on asking rent; 1,273 units permitted in Baltimore city in 2024 (1,104 in 5+ unit buildings).
- This rent runs 40% of the median local income ($62k/yr) — at the standard rent-burdened threshold; future hikes will face affordability resistance.
Forward outlook
- Local home prices are declining (-3.0%/yr); year-one equity from $1k of loan paydown is wiped out by about $6k of value loss. Plan a longer hold.
- Baltimore County population projected to shrink 4% by 2050 — rents likely to lag national; underwrite the cash flow, not the appreciation.
Negotiation context
- It's been on market 98 days — a 9% lower offer ($191k) is reasonable based on typical stale-listing flexibility.
- 4 sale attempts since 5y ago with the ask held roughly flat each time — persistent listings suggest the price (not the market) is what's stuck; bring a comps-based counter.
- Current owner paid $150k; 40% above their basis — modest negotiation headroom, anchor on the comps not their cost.
Risks & watch-outs
- Watch-outs: built in 1920 — expect roof / HVAC / electrical / plumbing capex.
- Climate carrying-cost: major wind risk, 27% chance of damaging wind over 30y; extreme-heat days projected 7→15/yr by 2055 (HVAC capex compounding) — expect insurance premiums to compound above CPI over the hold.
Questions for the listing agent
- It's been on market 98 days. Have you received any prior offers? Is the seller open to a 9% concession, seller financing, or rate buy-down credit?
- Built in 1920 — when were the roof, HVAC, electrical panel, plumbing, and water heater last replaced?
- Why hasn't it sold? Are there any deal-killer items the seller is aware of (foundation, flood, title, zoning, code violations)?
- Is there a deadline driving the sale (1031 exchange, divorce, estate, relocation)? That informs how much negotiation room exists.
- Schools are D-rated, which usually means shorter tenancies and higher turnover. Who's the typical renter profile here, and what's been the actual vacancy rate?
- Crime grade is F in this area — have there been break-ins, vandalism, or insurance claims at this property in the last 3 years? What carrier currently insures it and at what premium?
- The area grade is low — what's the realistic commute time and amenity access for the typical tenant pool here? Any planned neighborhood developments (good or bad) we should know about?
- What's the average days-on-market for RENTAL listings here right now (not sales)? A rising rental-DOM trend means longer vacancies and softer asking-rent achievability than the comps imply.
- What's the recent tenant-quality profile in this submarket — average credit score on applications, eviction rate, late-payment / NSF rate, and stable-employment percentage? A property-management company in the area should have these aggregated.
- How much new for-sale + rental construction is in the pipeline within 1–3 miles? Heavy new supply typically softens prices + rents 12–24 months out; constrained supply supports both.
Investment metrics
- 1% rule
- 0.98% ✗
- Cap rate
- 7.60%
- Cash-on-cash
- 4.67%
- DSCR
- 1.21
- GRM
- 8.5
CMA / ARV
- ARV (median comp)
- $184,539
- List price
- $209,900
- Delta
- 13.74%
- Verdict
- OVERPRICED
- Comps
- 20 within 1.0 mi
Show comp detail 12 sales within ~0.75 mi
| Address | Dist | Beds/Ba | Sqft | Sold | Price | $/sf | Match |
|---|---|---|---|---|---|---|---|
| 2227 Cecil Ave | 0.17mi | 3/2.0 | 1,764 (+7%) | 2mo | $195,000 | $111 | 79 |
| 310 E 25th St | 0.35mi | 3/3.0 | 1,560 (-6%) | 1mo | $308,999 | $198 | 69 |
| 326 E 26th St | 0.39mi | 3/2.0 | 1,496 (-9%) | 2mo | $170,000 | $114 | 64 |
| 435 Ilchester Ave | 0.53mi | 3/2.0 | 1,531 (-7%) | 2mo | $123,000 | $80 | 62 |
| 422 E Lanvale St | 0.46mi | 4/3.0 (+1) | 1,566 (-5%) | 1mo | $280,000 | $179 | 60 |
| 3009 Guilford Ave | 0.73mi | 3/1.5 | 1,598 (-3%) | 2mo | $416,500 | $261 | 57 |
| 2535 N Howard St | 0.71mi | 2/3.0 (-1) | 1,680 (+2%) | 2mo | $288,000 | $171 | 54 |
| 2701 Guilford Ave | 0.49mi | 3/1.5 | 1,862 (+13%) | 2mo | $331,000 | $178 | 52 |
| 707 E Preston St | 0.74mi | 3/2.5 | 1,762 (+7%) | 2mo | $275,000 | $156 | 50 |
| 1821 N Bond St | 0.62mi | 3/3.5 | 1,800 (+9%) | 4mo | $245,000 | $136 | 47 |
| 1433 E Federal St | 0.67mi | 3/3.0 | 1,814 (+10%) | 2mo | $181,900 | $100 | 46 |
| 3035 Frisby St | 0.70mi | 3/2.5 | 1,456 (-12%) | 4mo | $163,000 | $112 | 43 |
Match score weights: distance 35% · size 25% · config 20% · recency 20%. Top-matched comps best support the ARV.
Projected returns pro-forma
-3.0% appreciation · 1.63% rent growth · sell at horizon
- IRR
- -10.5%
- Equity multiple
- 0.62×
- Total profit
- $-22,264
- Equity at exit
- $31,297
- IRR
- -3.2%
- Equity multiple
- 0.80×
- Total profit
- $-11,850
- Equity at exit
- $18,148
Cash invested: $58,772 (down + closing). Projections, not guarantees.
Landlord ↔ Tenant lean methodology
- Overall (CITY)
- 12 Strongly Tenant-Friendly
- State Maryland
- 27 Tenant-Leaning · D+14
- County
- — inherits STATE
- City Baltimore
- 12 Strongly Tenant-Friendly · D+58
ZIP-level market 21218
- Rents YoY
- 1.6%
- Active inventory
- 325
- Price-to-rent
- 8.5×
Monthly cashflow live
- Estimated rent
- $2,066 high interval (Pro) →
- Mortgage (P&I)
- −$1,101
- Tax from tax record
- −$215 /mo · $2,584/yr
- Insurance
- −$87
- HOA
- −$0
- Vacancy / Maint / Mgmt
- −$434
- Net cashflow
- $229
Break-even live
UW: 25.0% down · 7.5% · 30yr · 1.5% tax · 5.0% vac · 8.0% maint · 8.0% mgmt
Financing live
Cash to close
- Down payment
- $52,475
- Closing costs
- $6,297
- Reserves months
- —
- Total cash needed
- —
Loan-product check · same deal, 3 products live
Conventional
25% down · 7.5% · 30yr
- Down + closing
- —
- Monthly P&I
- —
- Monthly cashflow
- —
- DSCR
- —
- Eligible?
- —
Personal DTI + credit; lowest rate.
DSCR
20% down · 8.5% · 30yr
- Down + closing
- —
- Monthly P&I
- —
- Monthly cashflow
- —
- DSCR
- —
- Eligible?
- —
No personal income docs; deal must DSCR.
Hard money
10% down · 12.0% · 12mo
- Down + closing
- —
- Monthly P&I
- —
- Monthly cashflow
- —
- DSCR
- —
- Eligible?
- —
Short-term bridge; refi at stabilization.
Rent comps 40 comps
| Address | Beds | Baths | Sqft | Rent | $/sqft | DOM | Units | Dist |
|---|---|---|---|---|---|---|---|---|
| 646 Cokesbury Ave Baltimore, MD | 2.0 | 1.5 | 1200 | $1,299 | $1.08 | 43d | 1 | 0.08mi |
| 534 E 23rd St Baltimore, MD | 3.0 | 2.5 | 1700 | $2,350 | $1.38 | 43d | 1 | 0.09mi |
| 324 E 23rd St Baltimore, MD | 3.0 | 1.5 | 2018 | $2,200 | $1.09 | 23d | 1 | 0.27mi |
| 312 E 25th St Baltimore, MD | 4.0 | 3.5 | 1960 | $2,800 | $1.43 | 43d | 1 | 0.36mi |
| 450 E Lorraine Ave Baltimore, MD | 3.0 | 1.0 | 1344 | $1,695 | $1.26 | 43d | 1 | 0.39mi |
| 411 E Lorraine Ave Baltimore, MD | 3.0 | 1.5 | 1344 | $2,200 | $1.64 | 23d | 1 | 0.39mi |
| 2300 N Calvert St Baltimore, MD | 1.0–2.0 | 1.0–2.0 | 1100 | $1,995 | $1.81 | 2d | 2 | 0.40mi |
| 428 E Lorraine Ave Baltimore, MD | 3.0 | 2.0 | 1344 | $1,875 | $1.40 | 23d | 1 | 0.40mi |
| 428 E Lorraine Ave Unit 1 Baltimore, MD | 3.0 | 1.5 | 1344 | $1,875 | $1.40 | 43d | 1 | 0.40mi |
| 1827 Guilford Ave Unit G-1809 Baltimore, MD | 3.0 | 3.5 | 1920 | $2,750 | $1.43 | 23d | 1 | 0.41mi |
| 1823 Guilford Ave Unit G-1823 Baltimore, MD | 3.0 | 3.5 | 1920 | $2,750 | $1.43 | 43d | 1 | 0.41mi |
| 400 E Lorraine Ave Baltimore, MD | 3.0 | 1.0 | 1500 | $1,800 | $1.20 | 20d | 1 | 0.42mi |
| 1813 Guilford Ave Unit G-1813 Baltimore, MD | 3.0 | 3.5 | 1920 | $2,750 | $1.43 | 43d | 1 | 0.42mi |
| 1809 Guilford Ave Unit G-1809 Baltimore, MD | 3.0 | 3.5 | 1920 | $2,750 | $1.43 | 43d | 1 | 0.42mi |
| 1807 Guilford Ave Unit G-1807 Baltimore, MD | 3.0 | 3.5 | 1920 | $2,750 | $1.43 | 43d | 1 | 0.42mi |
| 1801 Guilford Ave Baltimore, MD | 3.0 | 3.5 | 1921 | $2,595 | $1.35 | 23d | 3 | 0.43mi |
| 412 E Lanvale St Baltimore, MD | 3.0 | 2.0 | 1600 | $3,100 | $1.94 | 4d | 1 | 0.43mi |
| 1333 E North Ave Baltimore, MD | 4.0 | 2.5 | 1860 | $2,200 | $1.18 | 23d | 1 | 0.45mi |
| 437 Pitman Pl Baltimore, MD | 2.0 | 3.0 | 1520 | $1,650 | $1.09 | 4d | 1 | 0.48mi |
| 519 E 28th St Baltimore, MD | 3.0 | 2.0 | 1500 | $2,000 | $1.33 | 4d | 1 | 0.48mi |
| 458 E Federal St Baltimore, MD | 2.0 | 2.5 | 1300 | $1,850 | $1.42 | 4d | 1 | 0.49mi |
| 456 E Federal St Baltimore, MD | 2.0 | 2.0 | 1450 | $1,850 | $1.28 | 43d | 1 | 0.49mi |
| 412 E Federal St Baltimore, MD | 2.0 | 2.5 | 1100 | $1,700 | $1.55 | 23d | 1 | 0.51mi |
| 1243 E Lanvale St Baltimore, MD | 3.0 | 1.5 | 1281 | $1,750 | $1.37 | 2d | 1 | 0.51mi |
| 1243 E Lanvale St Baltimore, MD | 3.0 | 1.5 | 1281 | $1,750 | $1.37 | 16d | 1 | 0.51mi |
| 402 E 28th St Baltimore, MD | 3.0 | 1.0 | 1436 | $2,200 | $1.53 | 43d | 1 | 0.55mi |
| 1803 N Dallas St Baltimore, MD | 2.0 | 2.5 | 1250 | $2,100 | $1.68 | 23d | 1 | 0.58mi |
| 424 Ilchester Ave Baltimore, MD | 3.0 | 3.0 | 1976 | $1,800 | $0.91 | 14d | 1 | 0.58mi |
| 2606 Cecil Ave Baltimore, MD | 2.0 | 1.5 | 1200 | $1,500 | $1.25 | 43d | 1 | 0.59mi |
| 1512 E Lafayette Ave Baltimore, MD | 3.0 | 2.5 | 1476 | $1,950 | $1.32 | 43d | 1 | 0.59mi |
| 1514 E Lafayette Ave Baltimore, MD | 3.0 | 1.5 | 1215 | $2,000 | $1.65 | 23d | 1 | 0.59mi |
| 1704 Saint Paul St Unit 1 Baltimore, MD | 2.0 | 1.0 | 1141 | $1,550 | $1.36 | 4d | 1 | 0.60mi |
| 1511 E Lafayette Ave Baltimore, MD | 4.0 | 3.5 | 1988 | $2,650 | $1.33 | 4d | 1 | 0.60mi |
| 1607 Cliftview Ave Baltimore, MD | 3.0 | 1.0 | 1200 | $1,475 | $1.23 | 43d | 1 | 0.61mi |
| 908 E Preston St Baltimore, MD | 3.0 | 2.0 | 1560 | $1,300 | $0.83 | 43d | 1 | 0.69mi |
| 936 Montpelier St Baltimore, MD | 2.0 | 1.0 | 1260 | $1,450 | $1.15 | 23d | 1 | 0.70mi |
| 1312 Guilford Ave Baltimore, MD | 1.0–2.0 | 1.0–2.0 | 1040 | $1,850 | $1.78 | 43d | 6 | 0.74mi |
| 814 Showell Ct Baltimore, MD | 3.0 | 1.0 | 1152 | $2,000 | $1.74 | 21d | 1 | 0.74mi |
| 218 E Preston St Baltimore, MD | 2.0 | 1.0 | 1250 | $1,724 | $1.38 | 43d | 1 | 0.76mi |
| 103 E Mt Royal Ave Baltimore, MD | 1.0–3.0 | 1.0–2.0 | 850 | $2,624 | $3.09 | 1d | 17 | 0.76mi |
Listing history 27 events
-
2026-06-18days on market $209,900 Active 98 DOM
-
2026-06-17days on market $209,900 Active 97 DOM
-
2026-06-16days on market $209,900 Active 96 DOM
-
2026-06-15days on market $209,900 Active 95 DOM
-
2026-06-13days on market $209,900 Active 93 DOM
-
2026-06-09days on market $209,900 Active 89 DOM
-
2026-06-08days on market $209,900 Active 88 DOM
-
2026-06-07days on market $209,900 Active 87 DOM
-
2026-06-04days on market $209,900 Active 84 DOM
-
2026-06-03days on market $209,900 Active 83 DOM
-
2026-06-02days on market $209,900 Active 82 DOM
-
2026-06-01days on market $209,900 Active 81 DOM
-
2026-05-31days on market $209,900 Active 80 DOM
-
2026-03-21price $209,900 493-char remark
Show marketing remark (493 chars)
Step into this beautifully updated two-bedroom, one-bath home in the heart of Baltimore City, featuring high-end finishes throughout. Enjoy your morning coffee on one of two private balconies or relax on the welcoming front porch. Inside, you’ll find new appliances, elegant quartz countertops, and the warm ambiance of an electronic fireplace. Plus, you’ll have the convenience of off-street parking. Perfect for those who appreciate a touch of luxury and comfort in every detail.
-
2026-03-13$219,000 Active 493-char remark
Show marketing remark (493 chars)
Step into this beautifully updated two-bedroom, one-bath home in the heart of Baltimore City, featuring high-end finishes throughout. Enjoy your morning coffee on one of two private balconies or relax on the welcoming front porch. Inside, you’ll find new appliances, elegant quartz countertops, and the warm ambiance of an electronic fireplace. Plus, you’ll have the convenience of off-street parking. Perfect for those who appreciate a touch of luxury and comfort in every detail.
-
2026-03-04historical $219,000 493-char remark
Show marketing remark (493 chars)
Step into this beautifully updated two-bedroom, one-bath home in the heart of Baltimore City, featuring high-end finishes throughout. Enjoy your morning coffee on one of two private balconies or relax on the welcoming front porch. Inside, you’ll find new appliances, elegant quartz countertops, and the warm ambiance of an electronic fireplace. Plus, you’ll have the convenience of off-street parking. Perfect for those who appreciate a touch of luxury and comfort in every detail.
-
2026-01-07historical
-
2025-09-22$219,900 Active
-
2025-09-19historical
-
2025-08-12price $229,900
-
2025-06-26price $239,900
-
2025-05-13$265,000 Active
-
2023-01-20soldstatus $149,938
-
2022-04-05soldstatus $47,000
-
2021-06-30soldstatus $47,000 Closed
-
2021-06-08status Pending
-
2021-04-28$10,000 Active
ⓘ Source: listings_history table (triggers on properties + properties_extension) + one-shot
backfill from property_details.listing_events for pre-trigger history.
Tax reassessment forecast MD · Partial reset (capped growth)
- Current annual tax
- $2,584 · $215/mo
- Projected year-2 tax
- $2,584 · $215/mo
- Expected delta
- $0/yr ($0/mo · 0.0%)
ⓘ Screening estimate from a state-policy table — verify with the county assessor before closing.
Climate risk First Street
- Flood 1/10 Low FEMA zone X (unshaded) · 0% chance over 30 yrs
- Wildfire 1/10 Low
- Heat 7/10 Severe 7 d/yr ≥103°F today · 15 d/yr by 30 yrs out
- Wind 6/10 Major 27% chance of damaging wind over 30 yrs
- Air quality 4/10 Moderate 6 unhealthy d/yr today · 7 by 30 yrs out
Nearby sold comps map
Loading sold comps map…
Walkable amenities ~0.75 mi
Loading nearby amenities…
Taxation est. · year 1
- Rental income
- $24,791
- − Mortgage interest
- −$11,758
- − Property taxes
- −$2,584
- − Insurance
- −$1,050
- − Repairs & maintenance
- −$1,983
- − Management
- −$1,983
- − Depreciation
- −$6,106
- Taxable loss
- −$673
- Est. tax savings @ 24.0%
- +$161
- After-tax cash flow
- $2,904/yr
For passive investors: Depreciation is non-cash, so a rental often shows a tax loss while cash-flowing — sheltering income. Rental losses are passive: they offset passive income freely, and up to $25,000/yr can offset ordinary (W-2) income if you actively participate and your MAGI is under $100k (phasing out to $0 by $150k); unused losses carry forward. On sale, claimed depreciation is recaptured at up to 25%, and gains may owe capital-gains tax (a 1031 exchange can defer both). Figures are a year-1 estimate at your 24.0% rate — not tax advice; consult a CPA.
Schools (NCES district)
- District
- Baltimore City Public Schools
- NCES district ID
- 2400090
- Math proficiency
- 7% ▼ -9.00%
- Reading proficiency
- 16% ▼ -5.00%
- Median HH income
- $42,108
- Composite
- 10.08/100
- National rank
- #9805
- State rank
- #24 of 24 in MD
Livability — Baltimore
- Score
- 76/100
- State rank
- #90
- US rank
- #3396
Category grades
Schools grade is shown separately in the Schools card above.
Census & demographics
- Census place
- Baltimore, MD
- County
- Baltimore City · 558,601 people
- City population
- 588,727
- Metro
- Baltimore-Columbia-Towson, MD
- Population (ZIP)
- 44,014
- Household income
- $62,488
- Rent vs Own
- Severe rent burden
- 2564.0
Population outlook (Baltimore County) Hauer SSP2
- Today (2025)
- 624,249 people
- By 2030
- 621,541 · -0.4%
- By 2040
- 609,756 · -2.3%
- By 2050
- 597,249 · -4.3%
- By 2075
- 552,236 · -11.5%
- By 2100
- 513,934 · -17.7%
Race, ethnicity, and origin ACS 2023
- Neighborhood character
- Diverse neighborhood (Simpson 0.58)
- Race & ethnicity
- Black 60% White 26% Two or more races 6% Hispanic / Latino 5% Asian 5%
- Hispanic origin (detail)
- Common ancestry
- Romanian 2% Italian 1% Scotch-Irish 1%
- Foreign-born
- 10% · Canada, China, South Korea
- Languages at home
- 87% English-only · Spanish 4% French/Haitian/Cajun 2% Chinese 2%
Political lean MEDSL · Baltimore
- 2024 margin
- Solid D (+73.0) · D 85.2% · R 12.2% · Other 2.6%
- 2008→2024 swing
- -2.5pp toward R · 2008: 75.5pp · 2024: 73.0pp
- All cycles
- 2024: D+73.0 2020: D+76.6 2016: D+74.6 2012: D+76.4 2008: D+75.5
Not yet ingested
- Civics
- —
Market trends
- HPI YoY
- ▼ -463.14%
- Current HPI
- 292.3986
- Rent YoY
- ▲ 1.63%
- Metro
- Baltimore-Columbia-Towson, MD
- State GDP YoY
- ▲ 2.97%
- F500 in state
- 12
Industry mix (Fortune 500 HQ in MD)
| Industry | F500 HQs | Revenue |
|---|---|---|
| Aerospace / Defense | 1 | $71B |
|
||
| Utilities | 1 | $25B |
|
||
| Hotels | 1 | $24B |
|
||
| Consumer Goods | 1 | $7B |
|
||
| Real Estate | 1 | $6B |
|
||
| Chemicals | 1 | $2B |
|
||
Price history
+1999.0% since first listed14 events — show timeline
- 2026-03-21 Price Changed $209,900 BRIGHT MLS
- 2026-03-13 Listed $219,000 BRIGHT MLS
- 2026-03-04 Coming Soon $219,000 BRIGHT MLS
- 2026-01-07 Listing Removed — BRIGHT MLS
- 2025-09-22 Listed $219,900 BRIGHT MLS
- 2025-09-19 Listing Removed — BRIGHT MLS
- 2025-08-12 Price Changed $229,900 BRIGHT MLS
- 2025-06-26 Price Changed $239,900 BRIGHT MLS
- 2025-05-13 Listed $265,000 BRIGHT MLS
- 2023-01-20 Sold (Public Records) $149,938 Public Records
- 2022-04-05 Sold (Public Records) $47,000 Public Records
- 2021-06-30 Sold (MLS) $47,000 BRIGHT MLS
- 2021-06-08 Pending — BRIGHT MLS
- 2021-04-28 Listed $10,000 BRIGHT MLS
Property tax history
+11.1%/yrLatest (2025): $2,584 · +39.2% YoY. Source: county tax records.
Cash-flow waterfall
monthlySold comps — $/sqft
last 12 mo · ≤1 miLoading sold comps…