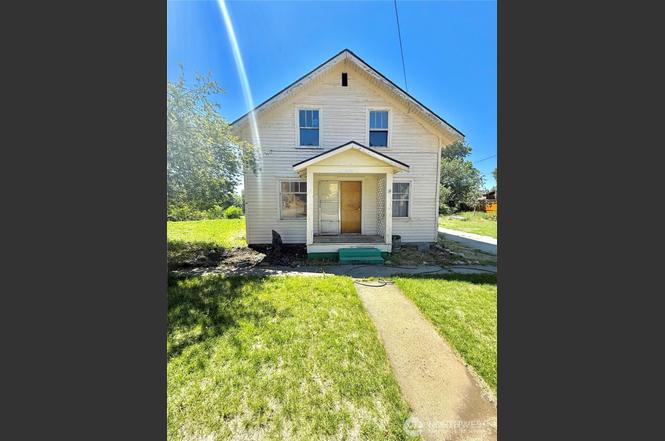
224 Bartlett Ave E · Omak, WA
Flood risk 10/10 · Severe
- FEMA flood zone
- A
- Chance of flooding over 30 yrs
- 0.99%
- Est. flood insurance / yr
- $946 – $6,584
Fire risk 9/10 · Severe
- Est. fire insurance / yr
- $604 – $1,122
Heat risk 5/10 · Moderate
- Hot days now (above 97°F)
- 7 days/yr
- Hot days in 30 yrs
- 15 days/yr
Wind risk 1/10 · Minimal
- Chance of severe wind over 30 yrs
- —
Air-quality risk 10/10 · Severe
- Unhealthy air days now
- 23 days/yr
- Unhealthy air days in 30 yrs
- 27 days/yr
Risk factors via First Street. Map © Google.
Why this score? — see what drove the B- grade
The composite is a weighted blend of 9 inputs, each scored 0–100. Each bar is that input's sub-score; the figure is the points it added to the 100-point composite (weight × sub-score).
- Cash flow +30.0/30.0
- DSCR +10.0/10.0
- 1% rule +8.3/10.0
- ARV discount +7.5/15.0
- Schools +3.6/10.0
- Livability +3.2/5.0
- Rent growth +2.5/5.0
- Condition / age +2.5/5.0
- Appreciation +0.0/10.0
$125,000
🖨 Deal sheet 📄 Offer letter ✓ Due diligence
Listing remarks
Omak - On the River - Double Lot on over 11,500+sqft overlooking the Okanogan River - Rare opportunity to own a spacious home of 5 bedroom/1 full bath 1512sqft living space & 672sqft basement for additional storage/workspace. Beauty of the river from your own property complete with detached garage that has been transformed into a lookout spot, single carport, driveway parking, and city utilities. Investment opportunity or full-time residence - Endless possibilities. $125,000 MLS-2542297/H-3774
Key facts
- City utilities
- Okanogan river
- Double lot
Tags
Property features AI
Finance
- Other: Property type: Residential - Single family residence; Finished living area reported as 1,512 (living area); Total building area reported as 2,184; Lot consists of lots 1, 2, 3; Lot size about 0.2688 acres; Site zoning: City
- Financial info: Listing terms: Cash
Exterior
- Parking: One covered parking space; Four uncovered parking spaces; Driveway; Garage (approx. 216 sq ft)
- Utilities: Public water (City of Omak); Sewer connected (City of Omak); Electric service (PUD)
- Home design: Single family residence; Two-story with basement; Built on lot; Has a view; Faces unspecified direction
- Construction: Built in 1922 (effective year); Wood construction; Composition roof; Poured concrete foundation
- Exterior features: Wood exterior; Outbuildings; Patio; Paved site
Interior
- Bedrooms: Five bedrooms total; Four bedrooms on upper level; One bedroom on main level
- Flooring: Hardwood flooring; Laminate flooring
- Bathrooms: One full bathroom; One bathtub; One shower
- Heating & cooling: Baseboard heating; Window air conditioning units
- Interior features: Ceiling fans; Dining room; Vaulted ceilings; Basement roughed-in
Neighborhood map
What this means for you Summary
Snapshot
- This is a 5-bed/1.0-bath single-family listed at $125k.
Deal economics
- At list price, monthly cash flow is $163 ($2k/yr) — positive.
- The deal already cash-flows at list — no discount required.
- Meets the 1% rule at list price ($2k rent vs $125k).
- Cap rate 10.9% vs local median 2.4% in Omak — top-decile yield for the area; either an underpriced asset or a hidden risk that comps aren't pricing in. Stress-test before assuming the spread holds.
Location & tenants
- Location reads 63/100 on livability (#386 in WA) — a middle-class / working-renter tenant base. Strengths: cost of living A+; Watch: schools C-, crime C-, health & safety C-.
- Omak School District (town): math 29% / reading 49% proficiency, ranked #227 of 291 in WA (top 78%) — families likely to look elsewhere, expect single-tenant / working-renter base with shorter leases.
- Market conditions: 105 active listings in the ZIP; 234 units permitted in Okanogan County in 2024 (0 in 5+ unit buildings).
Forward outlook
- Local home prices are declining (-3.0%/yr); year-one equity from $864 of loan paydown is wiped out by about $4k of value loss. Plan a longer hold.
- Okanogan County population projected at -12% by 2050 — secular population decline; favor cash flow + early exit over multi-decade hold.
Negotiation context
- Only 1 days on market — expect competitive offers; lowballing is unlikely to land.
Risks & watch-outs
- Watch-outs: flood insurance adds $314/mo; built in 1922 — expect roof / HVAC / electrical / plumbing capex.
- Climate carrying-cost: in FEMA flood zone A (mandatory federal flood insurance); severe wildfire risk; extreme-heat days projected 7→15/yr by 2055 (HVAC capex compounding) — expect insurance premiums to compound above CPI over the hold.
Questions for the listing agent
- Built in 1922 — when were the roof, HVAC, electrical panel, plumbing, and water heater last replaced?
- What's the actual annual flood-insurance premium (NFIP or private), and is the property in a SFHA with mandatory coverage?
- Is there a deadline driving the sale (1031 exchange, divorce, estate, relocation)? That informs how much negotiation room exists.
- What's the average days-on-market for RENTAL listings here right now (not sales)? A rising rental-DOM trend means longer vacancies and softer asking-rent achievability than the comps imply.
- What's the recent tenant-quality profile in this submarket — average credit score on applications, eviction rate, late-payment / NSF rate, and stable-employment percentage? A property-management company in the area should have these aggregated.
- How much new for-sale + rental construction is in the pipeline within 1–3 miles? Heavy new supply typically softens prices + rents 12–24 months out; constrained supply supports both.
Investment metrics
- 1% rule
- 1.33% ✓
- Cap rate
- 10.87%
- Cash-on-cash
- 16.34%
- DSCR
- 1.73
- GRM
- 6.3
CMA / ARV
- ARV (on-the-fly)
- $266,112
- Comps found
- 3
Show comp detail 3 sales within ~0.75 mi
| Address | Dist | Beds/Ba | Sqft | Sold | Price | $/sf | Match |
|---|---|---|---|---|---|---|---|
| 712 Sunrise Dr | 0.48mi | 4/2.0 (-1) | 1,440 (-5%) | 8mo | $287,900 | $200 | 54 |
| 306 S Cedar St | 0.60mi | 4/2.0 (-1) | 1,508 (-0%) | 10mo | $210,000 | $139 | 54 |
| 304 Apple Ave W | 0.44mi | 4/2.0 (-1) | 1,662 (+10%) | 10mo | $292,500 | $176 | 46 |
Match score weights: distance 35% · size 25% · config 20% · recency 20%. Top-matched comps best support the ARV.
Projected returns pro-forma
-3.0% appreciation · 3.0% rent growth · sell at horizon
- IRR
- -7.5%
- Equity multiple
- 0.72×
- Total profit
- $-9,686
- Equity at exit
- $18,638
- IRR
- 2.3%
- Equity multiple
- 1.16×
- Total profit
- $5,735
- Equity at exit
- $10,808
Cash invested: $35,000 (down + closing). Projections, not guarantees.
Landlord ↔ Tenant lean methodology
- Overall (STATE)
- 28 Tenant-Leaning
- State Washington
- 28 Tenant-Leaning · D+8
- County
- — inherits STATE
- City
- — inherits STATE
ZIP-level market 98841
- Active inventory
- 105
- Price-to-rent
- 6.3×
Monthly cashflow live
- Estimated rent
- $1,664 medium interval (Pro) →
- Mortgage (P&I)
- −$656
- Tax from tax record
- −$130 /mo · $1,562/yr
- Insurance
- −$52
- Flood insurance flood zone
- −$314 /mo · $3,765/yr
- HOA
- −$0
- Vacancy / Maint / Mgmt
- −$349
- Net cashflow
- $163
Break-even live
UW: 25.0% down · 7.5% · 30yr · 1.5% tax · 5.0% vac · 8.0% maint · 8.0% mgmt
Financing live
Cash to close
- Down payment
- $31,250
- Closing costs
- $3,750
- Reserves months
- —
- Total cash needed
- —
Loan-product check · same deal, 3 products live
Conventional
25% down · 7.5% · 30yr
- Down + closing
- —
- Monthly P&I
- —
- Monthly cashflow
- —
- DSCR
- —
- Eligible?
- —
Personal DTI + credit; lowest rate.
DSCR
20% down · 8.5% · 30yr
- Down + closing
- —
- Monthly P&I
- —
- Monthly cashflow
- —
- DSCR
- —
- Eligible?
- —
No personal income docs; deal must DSCR.
Hard money
10% down · 12.0% · 12mo
- Down + closing
- —
- Monthly P&I
- —
- Monthly cashflow
- —
- DSCR
- —
- Eligible?
- —
Short-term bridge; refi at stabilization.
Listing history 2 events
-
2026-06-18remarks 500-char remark
-
2026-06-18$125,000 Active 1 DOM
ⓘ Source: listings_history table (triggers on properties + properties_extension) + one-shot
backfill from property_details.listing_events for pre-trigger history.
Tax reassessment forecast WA · Resets to sale price
- Current annual tax
- $1,562 · $130/mo
- Projected year-2 tax
- $1,562 · $130/mo
- Expected delta
- $0/yr ($0/mo · 0.0%)
ⓘ Screening estimate from a state-policy table — verify with the county assessor before closing.
Climate risk First Street
- Flood 10/10 Extreme FEMA zone A · 99% chance over 30 yrs
- Wildfire 9/10 Extreme
- Heat 5/10 Major 7 d/yr ≥97°F today · 15 d/yr by 30 yrs out
- Wind 1/10 Low
- Air quality 10/10 Extreme 23 unhealthy d/yr today · 27 by 30 yrs out
Nearby sold comps map
Loading sold comps map…
Walkable amenities ~0.75 mi
Loading nearby amenities…
Taxation est. · year 1
- Rental income
- $19,964
- − Mortgage interest
- −$7,002
- − Property taxes
- −$1,562
- − Insurance
- −$4,390
- − Repairs & maintenance
- −$1,597
- − Management
- −$1,597
- − Depreciation
- −$3,636
- Taxable income
- $179
- Est. tax owed @ 24.0%
- −$43
- After-tax cash flow
- $1,910/yr
For passive investors: Depreciation is non-cash, so a rental often shows a tax loss while cash-flowing — sheltering income. Rental losses are passive: they offset passive income freely, and up to $25,000/yr can offset ordinary (W-2) income if you actively participate and your MAGI is under $100k (phasing out to $0 by $150k); unused losses carry forward. On sale, claimed depreciation is recaptured at up to 25%, and gains may owe capital-gains tax (a 1031 exchange can defer both). Figures are a year-1 estimate at your 24.0% rate — not tax advice; consult a CPA.
Schools (NCES district)
- District
- Omak School District
- NCES district ID
- 5306220
- Math proficiency
- 29% ▬ 0.00%
- Reading proficiency
- 49% ▲ 1.00%
- Median HH income
- $44,421
- Composite
- 35.56/100
- National rank
- #9729
- State rank
- #227 of 291 in WA
Livability — Omak
- Score
- 63/100
- State rank
- #386
- US rank
- #15185
Category grades
Schools grade is shown separately in the Schools card above.
Census & demographics
- Census place
- Omak, WA
- Population (ZIP)
- 9,376
Population outlook (Okanogan County) Hauer SSP2
- Today (2025)
- 40,288 people
- By 2030
- 39,265 · -2.5%
- By 2040
- 37,110 · -7.9%
- By 2050
- 35,389 · -12.2%
- By 2075
- 31,609 · -21.5%
- By 2100
- 26,647 · -33.9%
Race, ethnicity, and origin ACS 2023
- Neighborhood character
- Predominantly White (65%)
- Race & ethnicity
- White 65% Hispanic / Latino 16% Two or more races 16% Native American 14%
- Hispanic origin (detail)
- Mexican 14% Puerto Rican 1%
- Common ancestry
- Portuguese 4% Slovak 3% Lithuanian 2%
- Foreign-born
- 6% · Canada
- Languages at home
- 91% English-only · Spanish 8%
Political lean MEDSL · Okanogan
- 2024 margin
- R (+15.0) · D 41.1% · R 56.0% · Other 2.9%
- 2008→2024 swing
- -8.0pp toward R · 2008: -7.0pp · 2024: -15.0pp
- All cycles
- 2024: R+15.0 2020: R+13.8 2016: R+21.3 2012: R+14.8 2008: R+7.0
Not yet ingested
- Civics
- —
Market trends
- HPI YoY
- ▼ -144.79%
- Current HPI
- 190.8789
- Rent YoY
- —
- Metro
- —
- State GDP YoY
- ▲ 4.65%
- F500 in state
- 22
Industry mix (Fortune 500 HQ in WA)
| Industry | F500 HQs | Revenue |
|---|---|---|
| Retail | 2 | $269B |
|
||
| Technology / Retail | 1 | $638B |
|
||
| Technology | 1 | $245B |
|
||
| Telecommunications | 1 | $38B |
|
||
| Food / Beverage | 1 | $36B |
|
||
| Automotive / Trucks | 1 | $34B |
|
||
Price history
1 event — show timeline
- 2026-06-18 Listed $125,000 NWMLS as Distributed by MLS Grid
Property tax history
+3.2%/yrLatest (2026): $1,562 · -4.1% YoY. Source: county tax records.
Cash-flow waterfall
monthlySold comps — $/sqft
last 12 mo · ≤1 miLoading sold comps…