403 E 2nd St · Antwerp, MI
Flood risk 1/10 · Minimal
- FEMA flood zone
- X (unshaded)
- Chance of flooding over 30 yrs
- 0.0%
- Est. flood insurance / yr
- $473 – $860
Fire risk 1/10 · Minimal
- Est. fire insurance / yr
- $784 – $1,456
Heat risk 2/10 · Minimal
- Hot days now (above 99°F)
- 7 days/yr
- Hot days in 30 yrs
- 16 days/yr
Wind risk 2/10 · Minimal
- Chance of severe wind over 30 yrs
- —
Air-quality risk 3/10 · Minor
- Unhealthy air days now
- 2 days/yr
- Unhealthy air days in 30 yrs
- 4 days/yr
Risk factors via First Street. Map © Google.
Why this score? — see what drove the D+ grade
The composite is a weighted blend of 9 inputs, each scored 0–100. Each bar is that input's sub-score; the figure is the points it added to the 100-point composite (weight × sub-score).
- Cash flow +24.8/30.0
- DSCR +8.1/10.0
- 1% rule +5.2/10.0
- Schools +3.1/10.0
- Rent growth +2.5/5.0
- Livability +2.5/5.0
- Condition / age +2.5/5.0
- ARV discount +0.0/15.0
- Appreciation +0.0/10.0
$219,900
🖨 Deal sheet 📄 Offer letter ✓ Due diligence
Listing remarks MLS
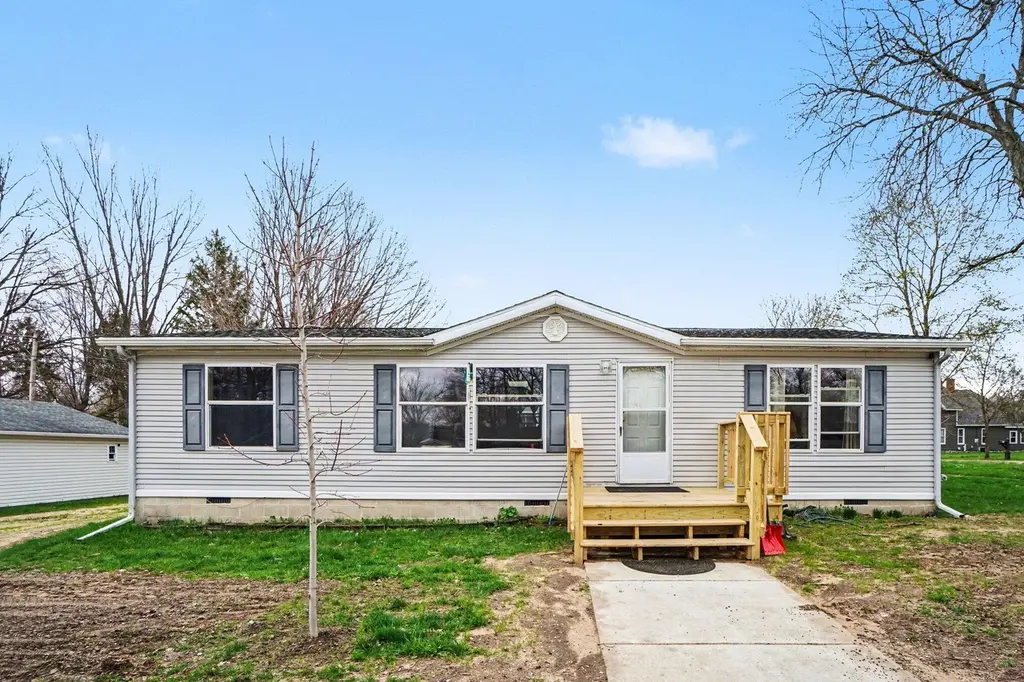
Village location Ranch layout Detached 2-car garage3-bedroom, 2-bath ranch offering 1,188 sq ft of single-level living on a 0.21-acre corner lot in Lawton. Main level includes all bedrooms, including a primary suite, plus a functional layout with living space and kitchen area. Exterior features vinyl siding, composition roof, new front porch, and a detached 2-car garage for parking and storage. Situated on a corner lot with public water and sewer, paved road frontage, and access to high-speed internet. Natural gas forced-air heat and central air conditioning provide year-round comfort. Located near Lawton village amenities with convenient access to M-40, local shops, parks, and services.
Key facts
- New front porch
- Ranch layout
- Composition roof
Tags
Neighborhood map
What this means for you Summary
Snapshot
- This is a 3-bed/2.0-bath single-family listed at $220k.
Deal economics
- At list price, monthly cash flow is $468 ($6k/yr) — positive.
- The deal already cash-flows at list — no discount required.
- Meets the 1% rule at list price ($2k rent vs $220k).
- Recommended offer: $207k (6.0% below list) — sets the bar for market timing.
Location & tenants
- Location reads: area grade D — affects rentability + tenant quality, not the cash-flow math above.
- Lawton Community School District (rural): math 27% / reading 45% proficiency, ranked #263 of 540 in MI (top 49%) — families likely to look elsewhere, expect single-tenant / working-renter base with shorter leases.
- Market conditions: 32 active listings in the ZIP; 165 units permitted in Van Buren County in 2024 (0 in 5+ unit buildings).
Forward outlook
- Local home prices are declining (-3.0%/yr); year-one equity from $2k of loan paydown is wiped out by about $7k of value loss. Plan a longer hold.
- Van Buren County population projected at -23% by 2050 — secular population decline; favor cash flow + early exit over multi-decade hold.
Negotiation context
- It's been on market 70 days — a 6% lower offer ($207k) is reasonable based on typical stale-listing flexibility.
- 16 sale attempts since 31y ago with the ask held roughly flat each time — persistent listings suggest the price (not the market) is what's stuck; bring a comps-based counter.
- Current owner paid $34k; list at $220k implies a 537% gain — meaningful room to come down on a strong offer.
Questions for the listing agent
- It's been on market 70 days. Have you received any prior offers? Is the seller open to a 6% concession, seller financing, or rate buy-down credit?
- Why hasn't it sold? Are there any deal-killer items the seller is aware of (foundation, flood, title, zoning, code violations)?
- Is there a deadline driving the sale (1031 exchange, divorce, estate, relocation)? That informs how much negotiation room exists.
- The area grade is low — what's the realistic commute time and amenity access for the typical tenant pool here? Any planned neighborhood developments (good or bad) we should know about?
- What's the average days-on-market for RENTAL listings here right now (not sales)? A rising rental-DOM trend means longer vacancies and softer asking-rent achievability than the comps imply.
- What's the recent tenant-quality profile in this submarket — average credit score on applications, eviction rate, late-payment / NSF rate, and stable-employment percentage? A property-management company in the area should have these aggregated.
- How much new for-sale + rental construction is in the pipeline within 1–3 miles? Heavy new supply typically softens prices + rents 12–24 months out; constrained supply supports both.
Investment metrics
- 1% rule
- 1.02% ✓
- Cap rate
- 8.85%
- Cash-on-cash
- 9.13%
- DSCR
- 1.41
- GRM
- 8.1
CMA / ARV
- ARV (median comp)
- $187,903
- List price
- $219,900
- Delta
- 17.03%
- Verdict
- OVERPRICED
- Comps
- 2 within 1.0 mi
Show comp detail 7 sales within ~0.75 mi
| Address | Dist | Beds/Ba | Sqft | Sold | Price | $/sf | Match |
|---|---|---|---|---|---|---|---|
| 117 S Adams St | 0.12mi | 3/1.5 | 1,156 (-3%) | 5mo | $195,000 | $169 | 84 |
| 106 N Quincy St | 0.35mi | 3/1.0 | 1,208 (+2%) | 2mo | $165,013 | $137 | 75 |
| 405 E Bitely St | 0.31mi | 2/1.0 (-1) | 1,205 (+1%) | 8mo | $226,000 | $188 | 68 |
| 604 E 2nd St | 0.13mi | 3/1.0 | 1,350 (+14%) | 4mo | $162,000 | $120 | 64 |
| 806 E 4th St | 0.32mi | 3/1.0 | 1,056 (-11%) | 3mo | $235,000 | $223 | 60 |
| 727 E 2nd St | 0.23mi | 2/2.0 (-1) | 1,333 (+12%) | 14mo | $250,000 | $188 | 52 |
| 322 S Nursery St | 0.31mi | 2/1.0 (-1) | 1,025 (-14%) | 6mo | $170,000 | $166 | 49 |
Match score weights: distance 35% · size 25% · config 20% · recency 20%. Top-matched comps best support the ARV.
Projected returns pro-forma
-3.0% appreciation · 3.0% rent growth · sell at horizon
- IRR
- -2.5%
- Equity multiple
- 0.90×
- Total profit
- $-5,904
- Equity at exit
- $32,788
- IRR
- 7.1%
- Equity multiple
- 1.53×
- Total profit
- $32,877
- Equity at exit
- $19,013
Cash invested: $61,572 (down + closing). Projections, not guarantees.
Landlord ↔ Tenant lean methodology
- Overall (STATE)
- 62 Landlord-Friendly
- State Michigan
- 62 Landlord-Friendly · EVEN
- County
- — inherits STATE
- City
- — inherits STATE
ZIP-level market 49065
- Active inventory
- 32
- Price-to-rent
- 8.1×
Monthly cashflow live
- Estimated rent
- $2,251 medium interval (Pro) →
- Mortgage (P&I)
- −$1,153
- Tax from tax record
- −$65 /mo · $785/yr
- Insurance
- −$92
- HOA
- −$0
- Vacancy / Maint / Mgmt
- −$473
- Net cashflow
- $468
Break-even live
UW: 25.0% down · 7.5% · 30yr · 1.5% tax · 5.0% vac · 8.0% maint · 8.0% mgmt
Financing live
Cash to close
- Down payment
- $54,975
- Closing costs
- $6,597
- Reserves months
- —
- Total cash needed
- —
Loan-product check · same deal, 3 products live
Conventional
25% down · 7.5% · 30yr
- Down + closing
- —
- Monthly P&I
- —
- Monthly cashflow
- —
- DSCR
- —
- Eligible?
- —
Personal DTI + credit; lowest rate.
DSCR
20% down · 8.5% · 30yr
- Down + closing
- —
- Monthly P&I
- —
- Monthly cashflow
- —
- DSCR
- —
- Eligible?
- —
No personal income docs; deal must DSCR.
Hard money
10% down · 12.0% · 12mo
- Down + closing
- —
- Monthly P&I
- —
- Monthly cashflow
- —
- DSCR
- —
- Eligible?
- —
Short-term bridge; refi at stabilization.
Listing history 40 events
-
2026-06-18days on market $219,900 Active 70 DOM
-
2026-06-17days on market $219,900 Active 69 DOM
-
2026-06-16days on market $219,900 Active 68 DOM
-
2026-06-15days on market $219,900 Active 67 DOM
-
2026-06-13days on market $219,900 Active 65 DOM
-
2026-06-12pricedays on market $219,900 Active 64 DOM
-
2026-06-09days on market $225,000 Active 61 DOM
-
2026-06-08days on market $225,000 Active 60 DOM
-
2026-06-07days on market $225,000 Active 59 DOM
-
2026-06-05days on market $225,000 Active 57 DOM
-
2026-06-04days on market $225,000 Active 55 DOM
-
2026-06-02days on market $225,000 Active 54 DOM
-
2026-06-01days on market $225,000 Active 53 DOM
-
2026-05-31days on market $225,000 Active 52 DOM
-
2026-05-31days on market $225,000 Active 51 DOM
-
2026-04-09$225,000 Active 698-char remark
Show marketing remark (696 chars)
Village location Ranch layout Detached 2-car garage3-bedroom, 2-bath ranch offering 1,188 sq ft of single-level living on a 0.21-acre corner lot in Lawton. Main level includes all bedrooms, including a primary suite, plus a functional layout with living space and kitchen area. Exterior features vinyl siding, composition roof, new front porch, and a detached 2-car garage for parking and storage. Situated on a corner lot with public water and sewer, paved road frontage, and access to high-speed internet. Natural gas forced-air heat and central air conditioning provide year-round comfort. Located near Lawton village amenities with convenient access to M-40, local shops, parks, and services.
-
2026-04-09$225,000 Active 696-char remark
Show marketing remark (696 chars)
Village location Ranch layout Detached 2-car garage3-bedroom, 2-bath ranch offering 1,188 sq ft of single-level living on a 0.21-acre corner lot in Lawton. Main level includes all bedrooms, including a primary suite, plus a functional layout with living space and kitchen area. Exterior features vinyl siding, composition roof, new front porch, and a detached 2-car garage for parking and storage. Situated on a corner lot with public water and sewer, paved road frontage, and access to high-speed internet. Natural gas forced-air heat and central air conditioning provide year-round comfort. Located near Lawton village amenities with convenient access to M-40, local shops, parks, and services.
-
2026-04-09$225,000 Active
Show marketing remark (696 chars)
Village location Ranch layout Detached 2-car garage3-bedroom, 2-bath ranch offering 1,188 sq ft of single-level living on a 0.21-acre corner lot in Lawton. Main level includes all bedrooms, including a primary suite, plus a functional layout with living space and kitchen area. Exterior features vinyl siding, composition roof, new front porch, and a detached 2-car garage for parking and storage. Situated on a corner lot with public water and sewer, paved road frontage, and access to high-speed internet. Natural gas forced-air heat and central air conditioning provide year-round comfort. Located near Lawton village amenities with convenient access to M-40, local shops, parks, and services.
-
2014-09-27historical
-
2013-01-31soldstatus $34,500
-
2013-01-31soldstatus $34,500
-
2012-11-16$34,900
-
2012-11-16$34,900
-
2007-07-02soldstatus $89,000
-
2007-06-22soldstatus $89,000
-
2007-06-22soldstatus $89,000
-
2006-11-29$89,900
-
2006-11-29$89,900
-
2005-04-13$79,900
-
2005-04-13$79,900
-
2004-03-30soldstatus $19,000
-
2003-12-01$24,900
-
2003-06-01$24,900
-
2003-06-01$24,900
-
2003-03-27$18,750
-
2003-03-27$18,750
-
1995-04-10soldstatus $30,000
-
1995-04-10soldstatus $30,000
-
1995-03-14$39,500
-
1995-03-14$39,500
ⓘ Source: listings_history table (triggers on properties + properties_extension) + one-shot
backfill from property_details.listing_events for pre-trigger history.
Tax reassessment forecast MI · Partial reset (capped growth)
- Current annual tax
- $785 · $65/mo
- Projected year-2 tax
- $2,086 · $174/mo
- Expected delta
- +$1,301/yr (+$108/mo · 165.6%)
ⓘ Screening estimate from a state-policy table — verify with the county assessor before closing.
Climate risk First Street
- Flood 1/10 Low FEMA zone X (unshaded) · 0% chance over 30 yrs
- Wildfire 1/10 Low
- Heat 2/10 Low 7 d/yr ≥99°F today · 16 d/yr by 30 yrs out
- Wind 2/10 Low
- Air quality 3/10 Moderate 2 unhealthy d/yr today · 4 by 30 yrs out
Nearby sold comps map
Loading sold comps map…
Walkable amenities ~0.75 mi
Loading nearby amenities…
Taxation est. · year 1
- Rental income
- $27,015
- − Mortgage interest
- −$12,318
- − Property taxes
- −$785
- − Insurance
- −$1,100
- − Repairs & maintenance
- −$2,161
- − Management
- −$2,161
- − Depreciation
- −$6,397
- Taxable income
- $2,093
- Est. tax owed @ 24.0%
- −$502
- After-tax cash flow
- $5,117/yr
For passive investors: Depreciation is non-cash, so a rental often shows a tax loss while cash-flowing — sheltering income. Rental losses are passive: they offset passive income freely, and up to $25,000/yr can offset ordinary (W-2) income if you actively participate and your MAGI is under $100k (phasing out to $0 by $150k); unused losses carry forward. On sale, claimed depreciation is recaptured at up to 25%, and gains may owe capital-gains tax (a 1031 exchange can defer both). Figures are a year-1 estimate at your 24.0% rate — not tax advice; consult a CPA.
Schools (NCES district)
- District
- Lawton Community School District
- NCES district ID
- 2621240
- Math proficiency
- 27% ▼ -9.00%
- Reading proficiency
- 45% ▼ -3.00%
- Median HH income
- $49,315
- Composite
- 31.04/100
- National rank
- #6084
- State rank
- #263 of 540 in MI
Livability — Antwerp
No livability data for this city. (Only ~50 U.S. cities are tracked.)
Census & demographics
- Census place
- Lawton, MI
- Population (ZIP)
- 7,283
Population outlook (Van Buren County) Hauer SSP2
- Today (2025)
- 71,479 people
- By 2030
- 68,693 · -3.9%
- By 2040
- 62,093 · -13.1%
- By 2050
- 55,232 · -22.7%
- By 2075
- 40,786 · -42.9%
- By 2100
- 27,785 · -61.1%
Race, ethnicity, and origin ACS 2023
- Neighborhood character
- Predominantly White (90%)
- Race & ethnicity
- White 90% Two or more races 6% Hispanic / Latino 4%
- Common ancestry
- Romanian 8% Iranian 6% Lithuanian 2%
- Foreign-born
- 1% · Canada, South Korea
- Languages at home
- 98% English-only · Spanish 2%
Political lean MEDSL · Van Buren
- 2024 margin
- R (+15.1) · D 41.7% · R 56.9% · Other 1.4%
- 2008→2024 swing
- -23.9pp toward R · 2008: 8.8pp · 2024: -15.1pp
- All cycles
- 2024: R+15.1 2020: R+12.3 2016: R+13.9 2012: D+0.5 2008: D+8.8
Not yet ingested
- Civics
- —
Market trends
- HPI YoY
- ▼ -162.97%
- Current HPI
- 165.0761
- Rent YoY
- —
- Metro
- —
- State GDP YoY
- ▲ 1.37%
- F500 in state
- 28
Industry mix (Fortune 500 HQ in MI)
| Industry | F500 HQs | Revenue |
|---|---|---|
| Automotive Parts | 3 | $48B |
|
||
| Automotive | 2 | $372B |
|
||
| Chemicals | 1 | $45B |
|
||
| Automotive Retail | 1 | $29B |
|
||
| Healthcare / Medical Devices | 1 | $23B |
|
||
| Automotive Technology | 1 | $20B |
|
||
Price history
+469.6% since first listed25 events — show timeline
- 2026-04-09 Listed $225,000 REALCOMP
- 2026-04-09 Listed $225,000 SW Michigan MLS
- 2026-04-09 Listed $225,000 MiRealSource-MiMLS
- 2014-09-27 Listing Removed — SW Michigan MLS
- 2013-01-31 Sold (MLS) $34,500 REALCOMP
- 2013-01-31 Sold (MLS) $34,500 SW Michigan MLS
- 2012-11-16 Listed $34,900 REALCOMP
- 2012-11-16 Listed $34,900 SW Michigan MLS
- 2007-07-02 Sold (Public Records) $89,000 Public Records
- 2007-06-22 Sold (MLS) $89,000 REALCOMP
- 2007-06-22 Sold (MLS) $89,000 SW Michigan MLS
- 2006-11-29 Listed $89,900 REALCOMP
- 2006-11-29 Listed $89,900 SW Michigan MLS
- 2005-04-13 Listed $79,900 REALCOMP
- 2005-04-13 Listed $79,900 SW Michigan MLS
- 2004-03-30 Sold (MLS) $19,000 SW Michigan MLS
- 2003-12-01 Listed $24,900 SW Michigan MLS
- 2003-06-01 Listed $24,900 REALCOMP
- 2003-06-01 Listed $24,900 SW Michigan MLS
- 2003-03-27 Listed $18,750 REALCOMP
- 2003-03-27 Listed $18,750 SW Michigan MLS
- 1995-04-10 Sold (MLS) $30,000 REALCOMP
- 1995-04-10 Sold (MLS) $30,000 SW Michigan MLS
- 1995-03-14 Listed $39,500 REALCOMP
- 1995-03-14 Listed $39,500 SW Michigan MLS
Property tax history
-5.4%/yrLatest (2025): $785 · -61.0% YoY. Source: county tax records.
Cash-flow waterfall
monthlySold comps — $/sqft
last 12 mo · ≤1 miLoading sold comps…