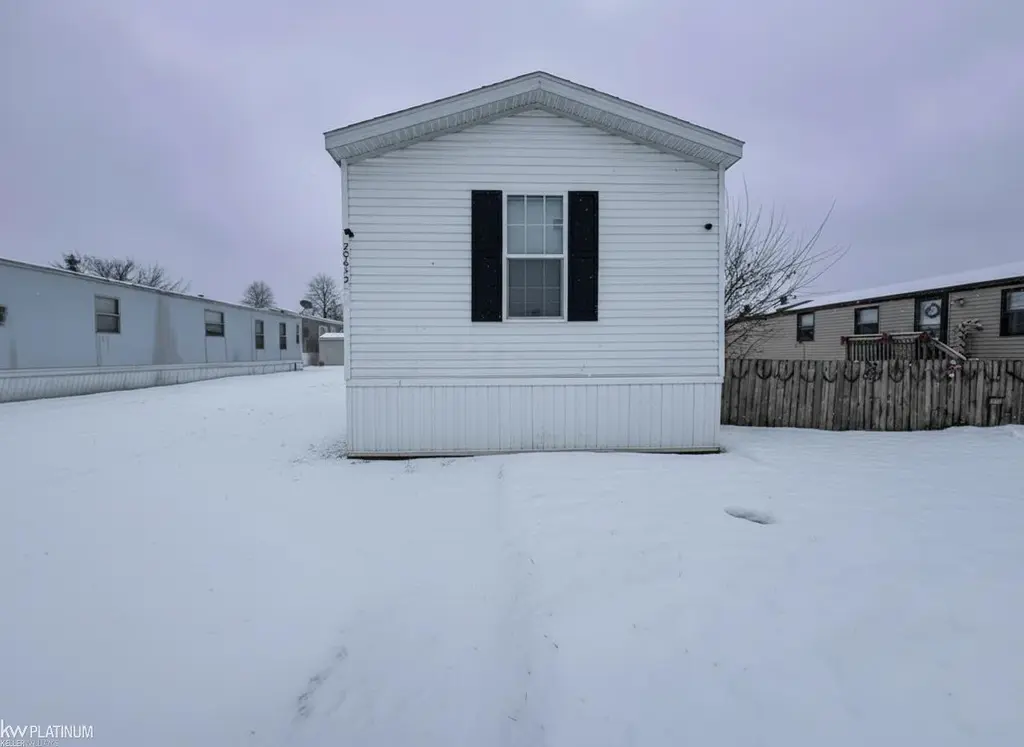
20642 Raleigh Dr · Clinton, MI
Flood risk No data
- FEMA flood zone
- —
- Chance of flooding over 30 yrs
- —
- Est. flood insurance / yr
- —
Fire risk No data
- Est. fire insurance / yr
- —
Heat risk No data
- Hot days now (above threshold)
- —
- Hot days in 30 yrs
- —
Wind risk No data
- Chance of severe wind over 30 yrs
- —
Air-quality risk No data
- Unhealthy air days now
- —
- Unhealthy air days in 30 yrs
- —
Risk factors via First Street. Map © Google.
Why this score? — see what drove the B grade
The composite is a weighted blend of 9 inputs, each scored 0–100. Each bar is that input's sub-score; the figure is the points it added to the 100-point composite (weight × sub-score).
- Cash flow +30.0/30.0
- 1% rule +10.0/10.0
- DSCR +10.0/10.0
- ARV discount +7.5/15.0
- Schools +4.0/10.0
- Condition / age +3.8/5.0
- Livability +3.5/5.0
- Rent growth +3.3/5.0
- Appreciation +0.0/10.0
$40,000
🖨 Deal sheet 📄 Offer letter ✓ Due diligence
Listing remarks MLS
Welcome to your new home! This meticulously maintained three-bedroom, two-bathroom manufactured home offers a perfect blend of comfort and style. Featuring newer flooring throughout, the inviting atmosphere sets the stage for relaxation. The well-equipped kitchen includes a fridge, stove, and dishwasher; complemented by ample cabinetry and a convenient bar area for casual dining. Located in a vibrant community, you'll enjoy fantastic amenities such as a refreshing pool, playground, and clubhouse—ideal for hosting gatherings and spending quality time with neighbors. Don’t miss this wonderful opportunity to make this house your home!
Key facts
- Newer flooring
- Ample cabinetry
- Refreshing pool
Tags
Neighborhood map
What this means for you Summary
Snapshot
- This is a 3-bed/2.0-bath manufactured listed at $40k. Condition is rated good.
Deal economics
- At list price, monthly cash flow is $815 ($10k/yr) — positive.
- The deal already cash-flows at list — no discount required.
- Meets the 1% rule at list price ($1k rent vs $40k).
- Recommended offer: $35k (12.0% below list) — sets the bar for market timing.
- Cap rate 30.7% vs local median 3.3% in Clinton — top-decile yield for the area; either an underpriced asset or a hidden risk that comps aren't pricing in. Stress-test before assuming the spread holds.
Location & tenants
- Location reads 70/100 on livability (#315 in MI) — a middle-class / working-renter tenant base. Strengths: cost of living A+, housing A+, health & safety A+; Watch: amenities F, commute F.
- Chippewa Valley Schools (suburban): math 39% / reading 50% proficiency, ranked #133 of 540 in MI (top 25%) — families likely to look elsewhere, expect single-tenant / working-renter base with shorter leases.
- Market conditions: Rents rising (+3.1%/yr); 116 active listings in the ZIP; 8 comparable units currently listed for rent nearby; rentals at typical pace (median 24d on market — plan ~3-4 weeks tenant-placement turnaround); 1,321 units permitted in Macomb County in 2024 (86 in 5+ unit buildings).
Forward outlook
- Local home prices are declining (-3.0%/yr); year-one equity from $277 of loan paydown is wiped out by about $1k of value loss. Plan a longer hold.
- Macomb County population projected at +9% by 2050 — modest demand growth; plan on rents tracking national, not racing it.
- At projected returns (-3.0% appreciation + 3.1% rent growth), your $11k cash investment doubles in ~2 years — after that, you're playing with house money.
Negotiation context
- It's been on market 180 days — a 12% lower offer ($35k) is reasonable based on typical stale-listing flexibility.
- 2 sale attempts with the ask held roughly flat each time — persistent listings suggest the price (not the market) is what's stuck; bring a comps-based counter.
Questions for the listing agent
- It's been on market 180 days. Have you received any prior offers? Is the seller open to a 12% concession, seller financing, or rate buy-down credit?
- Why hasn't it sold? Are there any deal-killer items the seller is aware of (foundation, flood, title, zoning, code violations)?
- Is there a deadline driving the sale (1031 exchange, divorce, estate, relocation)? That informs how much negotiation room exists.
- Schools are B-rated — typically a magnet for longer-tenancy family renters. What's the average tenant stay here, and is there a school-zone premium baked into asking?
- What's the average days-on-market for RENTAL listings here right now (not sales)? A rising rental-DOM trend means longer vacancies and softer asking-rent achievability than the comps imply.
- What's the recent tenant-quality profile in this submarket — average credit score on applications, eviction rate, late-payment / NSF rate, and stable-employment percentage? A property-management company in the area should have these aggregated.
- How much new for-sale + rental construction is in the pipeline within 1–3 miles? Heavy new supply typically softens prices + rents 12–24 months out; constrained supply supports both.
Investment metrics
- 1% rule
- 3.45% ✓
- Cap rate
- 30.75%
- Cash-on-cash
- 87.33%
- DSCR
- 4.89
- GRM
- 2.4
CMA / ARV
- ARV (median comp)
- $21,199
- List price
- $40,000
- Delta
- 88.69%
- Verdict
- OVERPRICED
- Comps
- 2 within 1.0 mi
Show comp detail 1 sale within ~0.75 mi
| Address | Dist | Beds/Ba | Sqft | Sold | Price | $/sf | Match |
|---|---|---|---|---|---|---|---|
| 20456 Harmony Dr | 0.33mi | 3/2.0 | 1,072 (+2%) | 10mo | $20,500 | $19 | 74 |
Match score weights: distance 35% · size 25% · config 20% · recency 20%. Top-matched comps best support the ARV.
Projected returns pro-forma
-3.0% appreciation · 3.12% rent growth · sell at horizon
- IRR
- 88.0%
- Equity multiple
- 5.07×
- Total profit
- $45,619
- Equity at exit
- $5,964
- IRR
- 91.1%
- Equity multiple
- 10.58×
- Total profit
- $107,342
- Equity at exit
- $3,458
Cash invested: $11,200 (down + closing). Projections, not guarantees.
Landlord ↔ Tenant lean methodology
- Overall (STATE)
- 62 Landlord-Friendly
- State Michigan
- 62 Landlord-Friendly · EVEN
- County
- — inherits STATE
- City
- — inherits STATE
ZIP-level market 48036
- Home prices YoY
- -29.2%
- Rents YoY
- 3.1%
- Active inventory
- 116
- Price-to-rent
- 2.4×
Monthly cashflow live
- Estimated rent
- $1,382 high interval (Pro) →
- Mortgage (P&I)
- −$210
- Tax est. 1.5%
- −$50 /mo · $600/yr
- Insurance
- −$17
- HOA
- −$0
- Vacancy / Maint / Mgmt
- −$290
- Net cashflow
- $815
Break-even live
UW: 25.0% down · 7.5% · 30yr · 1.5% tax · 5.0% vac · 8.0% maint · 8.0% mgmt
Financing live
Cash to close
- Down payment
- $10,000
- Closing costs
- $1,200
- Reserves months
- —
- Total cash needed
- —
Loan-product check · same deal, 3 products live
Conventional
25% down · 7.5% · 30yr
- Down + closing
- —
- Monthly P&I
- —
- Monthly cashflow
- —
- DSCR
- —
- Eligible?
- —
Personal DTI + credit; lowest rate.
DSCR
20% down · 8.5% · 30yr
- Down + closing
- —
- Monthly P&I
- —
- Monthly cashflow
- —
- DSCR
- —
- Eligible?
- —
No personal income docs; deal must DSCR.
Hard money
10% down · 12.0% · 12mo
- Down + closing
- —
- Monthly P&I
- —
- Monthly cashflow
- —
- DSCR
- —
- Eligible?
- —
Short-term bridge; refi at stabilization.
Rent comps 8 comps
| Address | Beds | Baths | Sqft | Rent | $/sqft | DOM | Units | Dist |
|---|---|---|---|---|---|---|---|---|
| 20475 Foster Dr Clinton Twp, MI | 3.0 | 2.0 | 1056 | $1,229 | $1.16 | 21d | 1 | 0.20mi |
| 37545 Charter Oaks Blvd Clinton Twp, MI | 2.0 | 1.5 | 1110 | $1,400 | $1.26 | 43d | 1 | 0.51mi |
| 36760 Farmbrook Dr Clinton Twp, MI | 2.0–3.0 | 1.0–1.5 | 1000 | $1,296 | $1.30 | 1d | 6 | 0.92mi |
| 35 S Groesbeck Hwy Mt Clemens, MI | 1.0–2.0 | 1.0–1.5 | 1125 | $2,050 | $1.82 | 1d | 1 | 1.37mi |
| 21613 Sunnyview St #14 Clinton Twp, MI | 2.0 | 2.5 | 1209 | $1,700 | $1.41 | 1d | 1 | 1.42mi |
| 21641 Hillside Clinton Twp, MI | 1.0–2.0 | 1.0 | 850 | $1,250 | $1.47 | 43d | 3 | 1.47mi |
| 21620 Hillside Dr Unit 1B Clinton Twp, MI | 2.0 | 1.0 | 900 | $1,225 | $1.36 | 43d | 1 | 1.48mi |
| 21640 Hillside Dr Unit 2C Clinton Twp, MI | 2.0 | 1.0 | 850 | $950 | $1.12 | 24d | 1 | 1.49mi |
Listing history 10 events
-
2026-06-09days on market $40,000 Active 180 DOM
-
2026-06-08days on market $40,000 Active 179 DOM
-
2026-06-07days on market $40,000 Active 178 DOM
-
2026-06-04days on market $40,000 Active 175 DOM
-
2026-06-03days on market $40,000 Active 174 DOM
-
2026-06-02days on market $40,000 Active 173 DOM
-
2026-06-01days on market $40,000 Active 172 DOM
-
2026-05-31days on market $40,000 Active 171 DOM
-
2025-12-11$40,000 Active 652-char remark
Show marketing remark (640 chars)
Welcome to your new home! This meticulously maintained three-bedroom, two-bathroom manufactured home offers a perfect blend of comfort and style. Featuring newer flooring throughout, the inviting atmosphere sets the stage for relaxation. The well-equipped kitchen includes a fridge, stove, and dishwasher; complemented by ample cabinetry and a convenient bar area for casual dining. Located in a vibrant community, you'll enjoy fantastic amenities such as a refreshing pool, playground, and clubhouse-ideal for hosting gatherings and spending quality time with neighbors. Don't miss this wonderful opportunity to make this house your home!
-
2025-12-11$40,000 Active 640-char remark
Show marketing remark (640 chars)
Welcome to your new home! This meticulously maintained three-bedroom, two-bathroom manufactured home offers a perfect blend of comfort and style. Featuring newer flooring throughout, the inviting atmosphere sets the stage for relaxation. The well-equipped kitchen includes a fridge, stove, and dishwasher; complemented by ample cabinetry and a convenient bar area for casual dining. Located in a vibrant community, you'll enjoy fantastic amenities such as a refreshing pool, playground, and clubhouse-ideal for hosting gatherings and spending quality time with neighbors. Don't miss this wonderful opportunity to make this house your home!
ⓘ Source: listings_history table (triggers on properties + properties_extension) + one-shot
backfill from property_details.listing_events for pre-trigger history.
Nearby sold comps map
Loading sold comps map…
Walkable amenities ~0.75 mi
Loading nearby amenities…
Taxation est. · year 1
- Rental income
- $16,580
- − Mortgage interest
- −$2,241
- − Property taxes
- −$600
- − Insurance
- −$200
- − Repairs & maintenance
- −$1,326
- − Management
- −$1,326
- − Depreciation
- −$1,164
- Taxable income
- $9,723
- Est. tax owed @ 24.0%
- −$2,333
- After-tax cash flow
- $7,447/yr
For passive investors: Depreciation is non-cash, so a rental often shows a tax loss while cash-flowing — sheltering income. Rental losses are passive: they offset passive income freely, and up to $25,000/yr can offset ordinary (W-2) income if you actively participate and your MAGI is under $100k (phasing out to $0 by $150k); unused losses carry forward. On sale, claimed depreciation is recaptured at up to 25%, and gains may owe capital-gains tax (a 1031 exchange can defer both). Figures are a year-1 estimate at your 24.0% rate — not tax advice; consult a CPA.
Condition & rehab AI · 12 photos
This well-maintained manufactured home is in good condition with minor cosmetic updates needed to enhance its curb appeal and functionality.
Value-add opportunities
- Both Paint interior walls — Fresh paint can enhance the home's curb appeal and interior aesthetics.
- Both Replace worn-out light fixtures — Upgrading light fixtures can improve the home's curb appeal and functionality.
- Both Install new flooring in bathrooms — New flooring can significantly improve the home's appearance and functionality.
- Both Upgrade kitchen appliances — Modern appliances can increase the home's appeal and functionality.
- Both Landscaping and curb appeal improvements — Enhancing the landscaping can improve the home's curb appeal and overall value.
Renovation cost estimate screening
Value-add ROI direction
- Both Paint interior walls — Fresh paint can enhance the home's curb appeal and interior aesthetics. ↑
- Both Replace worn-out light fixtures — Upgrading light fixtures can improve the home's curb appeal and functionality. ↑
- Both Install new flooring in bathrooms — New flooring can significantly improve the home's appearance and functionality. ↑
- Both Upgrade kitchen appliances — Modern appliances can increase the home's appeal and functionality. ↑
- Both Landscaping and curb appeal improvements — Enhancing the landscaping can improve the home's curb appeal and overall value. ↑
ⓘ Cost ranges are severity-bucket heuristics (US national rule-of-thumb). Get contractor quotes + a written scope before underwriting a rehab budget.
Schools (NCES district)
- District
- Chippewa Valley Schools
- NCES district ID
- 2609570
- Math proficiency
- 39% ▼ -10.00%
- Reading proficiency
- 50% ▼ -4.00%
- Median HH income
- $64,964
- Composite
- 39.61/100
- National rank
- #3922
- State rank
- #133 of 540 in MI
Livability — Clinton
- Score
- 70/100
- State rank
- #315
- US rank
- #7703
Category grades
Schools grade is shown separately in the Schools card above.
Census & demographics
- County
- Macomb County · 638,552 people
- Metro
- Detroit-Warren-Dearborn, MI
- Population (ZIP)
- 22,538
- Household income
- $70,071
- Rent vs Own
- Severe rent burden
- 514.0
Population outlook (Macomb County) Hauer SSP2
- Today (2025)
- 925,296 people
- By 2030
- 948,226 · +2.5%
- By 2040
- 983,961 · +6.3%
- By 2050
- 1,010,200 · +9.2%
- By 2075
- 1,076,222 · +16.3%
- By 2100
- 1,077,065 · +16.4%
Race, ethnicity, and origin ACS 2023
- Neighborhood character
- Predominantly White (65%)
- Race & ethnicity
- White 65% Black 21% Two or more races 8% Hispanic / Latino 5% Asian 3%
- Hispanic origin (detail)
- Mexican 3%
- Common ancestry
- Romanian 13% Lithuanian 3% English 2%
- Foreign-born
- 4% · Canada, China, Jamaica
- Languages at home
- 94% English-only · Spanish 3% Chinese 1% Other Indo-European 1%
Political lean MEDSL · Macomb
- 2024 margin
- R (+13.7) · D 42.2% · R 55.9% · Other 1.9%
- 2008→2024 swing
- -22.3pp toward R · 2008: 8.6pp · 2024: -13.7pp
- All cycles
- 2024: R+13.7 2020: R+8.1 2016: R+11.6 2012: D+4.0 2008: D+8.6
Not yet ingested
- Civics
- —
Market trends
- HPI YoY
- ▼ -111.99%
- Current HPI
- 270.9126
- Rent YoY
- ▲ 3.12%
- Metro
- Detroit-Warren-Dearborn, MI
- State GDP YoY
- ▲ 1.37%
- F500 in state
- 28
Industry mix (Fortune 500 HQ in MI)
| Industry | F500 HQs | Revenue |
|---|---|---|
| Automotive Parts | 3 | $48B |
|
||
| Automotive | 2 | $372B |
|
||
| Chemicals | 1 | $45B |
|
||
| Automotive Retail | 1 | $29B |
|
||
| Healthcare / Medical Devices | 1 | $23B |
|
||
| Automotive Technology | 1 | $20B |
|
||
Price history
+0.0% since first listed2 events — show timeline
- 2025-12-11 Listed $40,000 REALCOMP
- 2025-12-11 Listed $40,000 MiRealSource-MiMLS
Cash-flow waterfall
monthlySold comps — $/sqft
last 12 mo · ≤1 miLoading sold comps…