1310 Neva St · Jacksonville, FL
Flood risk 1/10 · Minimal
- FEMA flood zone
- X (unshaded)
- Chance of flooding over 30 yrs
- 0.0%
- Est. flood insurance / yr
- $507 – $1,088
Fire risk 1/10 · Minimal
- Est. fire insurance / yr
- $947 – $1,759
Heat risk 8/10 · Major
- Hot days now (above 107°F)
- 7 days/yr
- Hot days in 30 yrs
- 19 days/yr
Wind risk 9/10 · Severe
- Chance of severe wind over 30 yrs
- 99.0%
Air-quality risk 5/10 · Moderate
- Unhealthy air days now
- 7 days/yr
- Unhealthy air days in 30 yrs
- 7 days/yr
Risk factors via First Street. Map © Google.
Why this score? — see what drove the B grade
The composite is a weighted blend of 9 inputs, each scored 0–100. Each bar is that input's sub-score; the figure is the points it added to the 100-point composite (weight × sub-score).
- Cash flow +30.0/30.0
- 1% rule +10.0/10.0
- DSCR +10.0/10.0
- ARV discount +7.5/15.0
- Livability +4.2/5.0
- Schools +3.9/10.0
- Rent growth +2.9/5.0
- Condition / age +2.5/5.0
- Appreciation +0.0/10.0
$79,900
🖨 Deal sheet 📄 Offer letter ✓ Due diligence
Listing remarks MLS
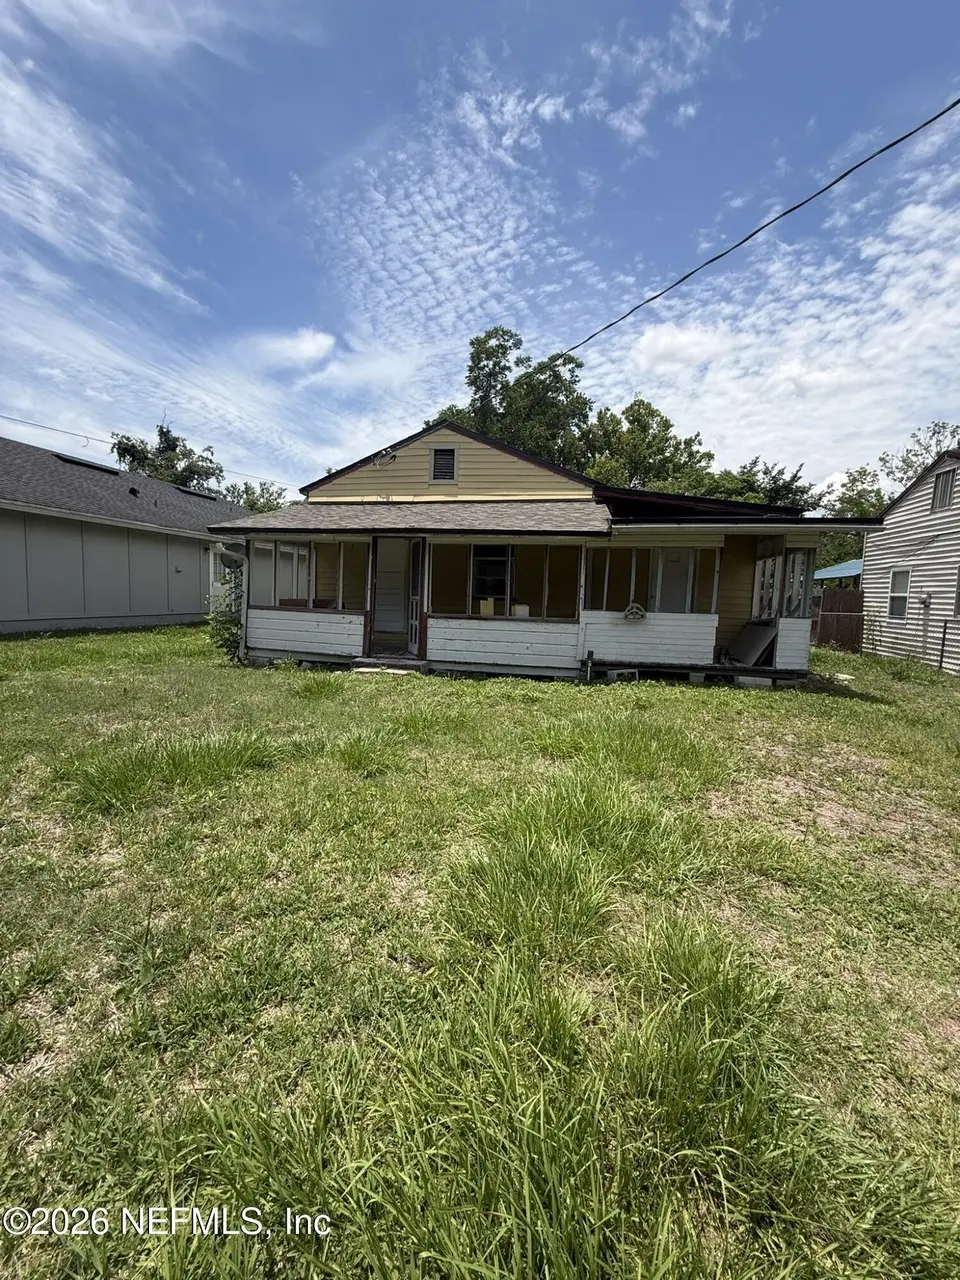
Here's a property located in the Lakeshore area of the Westside that's in need of a new owner. This particular property sits in the Cedarhurst neighborhood where much development has been happening over the years and in an area full of high comps for the savvy investor or first time homeowner. It sits on a nice sized lot where a new owner could rehab it and turn it into a 4/2. For the prospective buyer, feel free to explore using a 203K loan to rehab this property as well. This property is being sold AS-IS and is in need of a complete rehab from the foundation up. This property has so much potential, so don't miss the chance to turn this home into a prime investment opportunity!
Key facts
- Generously sized lot
- Major roadways
- 5,227 sq ft lot
Tags
Property features AI
Finance
- HOA & community: Not a senior community
Exterior
- Parking: Other parking (unspecified)
- Utilities: Utilities: other/unspecified; Has heating and cooling
- Home design: Single Family Residence
- Exterior features: Residential single-family property; Lot approximately 0.12 acres; No private pool
Interior
- Kitchen: No kitchen appliances listed
- Bedrooms: 3 bedrooms
- Bathrooms: 1 full bathroom
- Heating & cooling: Central heating; Cooling system present (other/unspecified)
- Interior features: No built-in appliances listed
- Laundry & utility: No laundry appliances listed
Neighborhood map
What this means for you Summary
Snapshot
- This is a 3-bed/1.0-bath single-family listed at $80k.
Deal economics
- At list price, monthly cash flow is $610 ($7k/yr) — positive.
- The deal already cash-flows at list — no discount required.
- Meets the 1% rule at list price ($2k rent vs $80k).
- Cap rate 15.4% vs local median 4.0% in Jacksonville — top-decile yield for the area; either an underpriced asset or a hidden risk that comps aren't pricing in. Stress-test before assuming the spread holds.
Location & tenants
- Location reads 83/100 on livability (#50 in FL, #911 nationally) — a professional / high-income tenant draw. Strengths: amenities A+, commute A+, housing A+.
- Duval (urban): math 46% / reading 45% proficiency, ranked #48 of 73 in FL (top 66%) — families likely to look elsewhere, expect single-tenant / working-renter base with shorter leases.
- Market conditions: Rents rising (+1.7%/yr); 320 active listings in the ZIP; 38 comparable units currently listed for rent nearby; rentals at typical pace (median 21d on market — plan ~3-4 weeks tenant-placement turnaround); 6,503 units permitted in Duval County in 2024 (1,131 in 5+ unit buildings).
Forward outlook
- Local home prices are declining (-3.0%/yr); year-one equity from $552 of loan paydown is wiped out by about $2k of value loss. Plan a longer hold.
- Duval County population projected at +19% by 2050 — long-run rental-demand tailwind backs the buy-and-hold thesis.
- At projected returns (-3.0% appreciation + 1.7% rent growth), your $22k cash investment doubles in ~4 years — after that, you're playing with house money.
Negotiation context
- Only 7 days on market — expect competitive offers; lowballing is unlikely to land.
- 7 sale attempts since 3y ago with the ask held roughly flat each time — persistent listings suggest the price (not the market) is what's stuck; bring a comps-based counter.
Risks & watch-outs
- Watch-outs: built in 1945 — expect roof / HVAC / electrical / plumbing capex.
- Climate carrying-cost: severe wind risk, 99% chance of damaging wind over 30y; extreme-heat days projected 7→19/yr by 2055 (HVAC capex compounding) — expect insurance premiums to compound above CPI over the hold.
Questions for the listing agent
- Built in 1945 — when were the roof, HVAC, electrical panel, plumbing, and water heater last replaced?
- Is there a deadline driving the sale (1031 exchange, divorce, estate, relocation)? That informs how much negotiation room exists.
- Schools are B-rated — typically a magnet for longer-tenancy family renters. What's the average tenant stay here, and is there a school-zone premium baked into asking?
- What's the average days-on-market for RENTAL listings here right now (not sales)? A rising rental-DOM trend means longer vacancies and softer asking-rent achievability than the comps imply.
- What's the recent tenant-quality profile in this submarket — average credit score on applications, eviction rate, late-payment / NSF rate, and stable-employment percentage? A property-management company in the area should have these aggregated.
- How much new for-sale + rental construction is in the pipeline within 1–3 miles? Heavy new supply typically softens prices + rents 12–24 months out; constrained supply supports both.
Investment metrics
- 1% rule
- 1.88% ✓
- Cap rate
- 15.45%
- Cash-on-cash
- 32.70%
- DSCR
- 2.45
- GRM
- 4.4
CMA / ARV
- ARV (on-the-fly)
- $192,060
- Comps found
- 12
Show comp detail 12 sales within ~0.75 mi
| Address | Dist | Beds/Ba | Sqft | Sold | Price | $/sf | Match |
|---|---|---|---|---|---|---|---|
| 1424 Eola Ct | 0.28mi | 3/1.0 | 981 (-1%) | 14mo | $180,000 | $183 | 74 |
| 5371 Royce Ave | 0.25mi | 3/1.0 | 1,040 (+5%) | 10mo | $220,000 | $212 | 72 |
| 5245 Royce Ave | 0.44mi | 3/1.0 | 975 (-2%) | 6mo | $200,000 | $205 | 72 |
| 1169 Orton St | 0.38mi | 2/1.0 (-1) | 968 (-2%) | 6mo | $184,000 | $190 | 69 |
| 5558 Plymouth St | 0.29mi | 2/2.0 (-1) | 999 (+1%) | 9mo | $98,000 | $98 | 69 |
| 5256 Royce Ave | 0.43mi | 3/1.0 | 1,040 (+5%) | 7mo | $169,250 | $163 | 66 |
| 1305 Ellis Trace Dr W | 0.26mi | 2/2.0 (-1) | 1,020 (+3%) | 14mo | $198,000 | $194 | 62 |
| 5407 Carder St | 0.23mi | 3/1.0 | 864 (-13%) | 8mo | $200,000 | $231 | 62 |
| 5319 Kingsbury St | 0.61mi | 3/1.0 | 910 (-8%) | 0mo | $201,000 | $221 | 58 |
| 1134 Pangola Dr | 0.46mi | 2/1.0 (-1) | 1,068 (+8%) | 13mo | $121,000 | $113 | 49 |
| 1173 Denaud St | 0.55mi | 3/2.0 | 1,056 (+7%) | 12mo | $227,000 | $215 | 49 |
| 4842 Louisa Ter | 0.75mi | 3/1.0 | 884 (-11%) | 4mo | $122,500 | $139 | 44 |
Match score weights: distance 35% · size 25% · config 20% · recency 20%. Top-matched comps best support the ARV.
Projected returns pro-forma
-3.0% appreciation · 1.73% rent growth · sell at horizon
- IRR
- 26.4%
- Equity multiple
- 2.07×
- Total profit
- $24,020
- Equity at exit
- $11,913
- IRR
- 33.2%
- Equity multiple
- 3.84×
- Total profit
- $63,483
- Equity at exit
- $6,908
Cash invested: $22,372 (down + closing). Projections, not guarantees.
Landlord ↔ Tenant lean methodology
- Overall (STATE)
- 87 Strongly Landlord-Friendly
- State Florida
- 87 Strongly Landlord-Friendly · R+3
- County
- — inherits STATE
- City
- — inherits STATE
ZIP-level market 32205
- Rents YoY
- 1.7%
- Active inventory
- 320
- Price-to-rent
- 4.4×
Monthly cashflow live
- Estimated rent
- $1,502 high interval (Pro) →
- Mortgage (P&I)
- −$419
- Tax from tax record
- −$125 /mo · $1,497/yr
- Insurance
- −$33
- HOA
- −$0
- Vacancy / Maint / Mgmt
- −$315
- Net cashflow
- $610
Break-even live
UW: 25.0% down · 7.5% · 30yr · 1.5% tax · 5.0% vac · 8.0% maint · 8.0% mgmt
Financing live
Cash to close
- Down payment
- $19,975
- Closing costs
- $2,397
- Reserves months
- —
- Total cash needed
- —
Loan-product check · same deal, 3 products live
Conventional
25% down · 7.5% · 30yr
- Down + closing
- —
- Monthly P&I
- —
- Monthly cashflow
- —
- DSCR
- —
- Eligible?
- —
Personal DTI + credit; lowest rate.
DSCR
20% down · 8.5% · 30yr
- Down + closing
- —
- Monthly P&I
- —
- Monthly cashflow
- —
- DSCR
- —
- Eligible?
- —
No personal income docs; deal must DSCR.
Hard money
10% down · 12.0% · 12mo
- Down + closing
- —
- Monthly P&I
- —
- Monthly cashflow
- —
- DSCR
- —
- Eligible?
- —
Short-term bridge; refi at stabilization.
Rent comps 38 comps
| Address | Beds | Baths | Sqft | Rent | $/sqft | DOM | Units | Dist |
|---|---|---|---|---|---|---|---|---|
| 5710 Lenox Ave Jacksonville, FL | 1.0–4.0 | 1.0–2.0 | 988 | $1,299 | $1.31 | 23d | 1 | 0.24mi |
| 5363 Poppy Dr Jacksonville, FL | 3.0 | 1.0 | 1040 | $1,445 | $1.39 | 20d | 1 | 0.25mi |
| 5377 Royce Ave Jacksonville, FL | 3.0 | 1.0 | 1040 | $1,800 | $1.73 | 17d | 1 | 0.25mi |
| 5351 Royce Ave Jacksonville, FL | 3.0 | 1.0 | 1040 | $1,600 | $1.54 | 23d | 1 | 0.30mi |
| 6117 Hollow Ct Key Hollow Jacksonville, FL | 3.0 | 2.0 | 1044 | $1,449 | $1.39 | 7d | 1 | 0.31mi |
| 1406 Ellis Trace Dr W Jacksonville, FL | 2.0 | 1.5 | 1028 | $1,200 | $1.17 | 16d | 1 | 0.31mi |
| 1159 Pangola Dr Jacksonville, FL | 2.0 | 1.0 | 676 | $896 | $1.33 | 23d | 1 | 0.40mi |
| 1160 Comanche St Jacksonville, FL | 2.0 | 1.0 | 625 | $1,095 | $1.75 | 21d | 1 | 0.42mi |
| 1131 Lake Shore Blvd Unit 1131 Jacksonville, FL | 2.0 | 1.0 | 696 | $995 | $1.43 | 19d | 1 | 0.48mi |
| 1130 Comanche St Unit 402 Jacksonville, FL | 2.0 | 1.0 | 763 | $1,090 | $1.43 | 23d | 1 | 0.52mi |
| 5616 Atlee Ave Jacksonville, FL | 3.0 | 1.0 | 800 | $1,150 | $1.44 | 23d | 1 | 0.93mi |
| 5614 Atlee Ave Jacksonville, FL | 3.0 | 1.0 | 750 | $1,350 | $1.80 | 23d | 1 | 0.94mi |
| 1465 Manotak Point Dr #105 Jacksonville, FL | 2.0 | 2.0 | 940 | $1,295 | $1.38 | 17d | 1 | 0.95mi |
| 4844 Merrimac Ave Jacksonville, FL | 2.0 | 1.0 | 820 | $1,325 | $1.62 | 23d | 1 | 0.97mi |
| 1570 Lane Ave S Jacksonville, FL | 1.0–2.0 | 1.0–1.5 | 862 | $1,425 | $1.65 | 2d | 10 | 0.97mi |
| 5139 Camille Ave Jacksonville, FL | 3.0 | 2.0 | 1100 | $1,625 | $1.48 | 1d | 1 | 0.99mi |
| 740 Ernona St Jacksonville, FL | 2.0 | 1.0 | 800 | $1,200 | $1.50 | 7d | 1 | 1.00mi |
| 1443 Winnebago Ave #1 Jacksonville, FL | 2.0 | 1.0 | 800 | $1,025 | $1.28 | 23d | 1 | 1.01mi |
| 979 Mikael Ave Jacksonville, FL | 2.0 | 1.0 | 1002 | $1,510 | $1.51 | 23d | 1 | 1.01mi |
| 1591 Lane Ave S Jacksonville, FL | 1.0–3.0 | 1.0–2.0 | 954 | $1,485 | $1.56 | 23d | 1 | 1.05mi |
| 4813 Post St Jacksonville, FL | 2.0 | 1.0 | 930 | $1,150 | $1.24 | 14d | 1 | 1.05mi |
| 4752 Post St Jacksonville, FL | 2.0 | 1.0 | 936 | $1,400 | $1.50 | 23d | 1 | 1.08mi |
| 5615 San Juan Ave #208 Jacksonville, FL | 2.0 | 2.0 | 1115 | $1,200 | $1.08 | 23d | 1 | 1.10mi |
| 5821 San Juan Ave Jacksonville, FL | 1.0–3.0 | 1.0–2.0 | 1056 | $1,330 | $1.26 | 3d | 7 | 1.12mi |
| 853 Mikael Ave Jacksonville, FL | 3.0 | 2.0 | 1025 | $1,600 | $1.56 | 23d | 1 | 1.14mi |
| 4623 Hercules Ave Jacksonville, FL | 2.0 | 1.0 | 1014 | $1,221 | $1.20 | 4d | 1 | 1.14mi |
| 4620 Attleboro St Jacksonville, FL | 3.0 | 2.0 | 1032 | $2,195 | $2.13 | 12d | 1 | 1.17mi |
| 4776 Cardinal Blvd Jacksonville, FL | 3.0 | 1.0 | 959 | $1,550 | $1.62 | 23d | 1 | 1.18mi |
| 4608 Wheeler Ave Jacksonville, FL | 3.0 | 1.0 | 1025 | $2,000 | $1.95 | 23d | 1 | 1.19mi |
| 2039 Niblick Dr Jacksonville, FL | 1.0–2.0 | 1.0–2.0 | 847 | $1,275 | $1.51 | 3d | 10 | 1.22mi |
| 5215 San Juan Ave Jacksonville, FL | 2.0 | 1.0 | 750 | $1,075 | $1.43 | 7d | 1 | 1.22mi |
| 6511 San Juan Ave Jacksonville, FL | 2.0 | 2.0 | 740 | $1,200 | $1.62 | 4d | 1 | 1.23mi |
| 4530 Astral St Jacksonville, FL | 2.0 | 1.0 | 800 | $1,925 | $2.41 | 23d | 1 | 1.29mi |
| 6595 San Juan Ave Jacksonville, FL | 1.0–2.0 | 1.0 | 846 | $1,250 | $1.48 | 19d | 4 | 1.29mi |
| 5433 Leaming Ave Jacksonville, FL | 2.0 | 1.0 | 548 | $1,099 | $2.01 | 20d | 1 | 1.36mi |
| 5405 Leaming Ave Jacksonville, FL | 3.0 | 1.0 | 924 | $1,199 | $1.30 | 17d | 1 | 1.37mi |
| 4718 Ramona Blvd Jacksonville, FL | 3.0 | 1.0 | 1085 | $1,595 | $1.47 | 23d | 1 | 1.38mi |
| 4315 Antisdale St Jacksonville, FL | 4.0 | 1.0 | 1100 | $1,600 | $1.45 | 23d | 1 | 1.41mi |
Listing history 5 events
-
2026-06-13statusdays on market $79,900 Pending 7 DOM
-
2026-06-09days on market $79,900 Active 4 DOM
-
2026-06-08days on market $79,900 Active 3 DOM
-
2026-06-07remarks 699-char remark
-
2026-06-07$79,900 Active 2 DOM
ⓘ Source: listings_history table (triggers on properties + properties_extension) + one-shot
backfill from property_details.listing_events for pre-trigger history.
Tax reassessment forecast FL · Resets to sale price
- Current annual tax
- $1,497 · $125/mo
- Projected year-2 tax
- $1,497 · $125/mo
- Expected delta
- $0/yr ($0/mo · 0.0%)
ⓘ Screening estimate from a state-policy table — verify with the county assessor before closing.
Climate risk First Street
- Flood 1/10 Low FEMA zone X (unshaded) · 0% chance over 30 yrs
- Wildfire 1/10 Low
- Heat 8/10 Severe 7 d/yr ≥107°F today · 19 d/yr by 30 yrs out
- Wind 9/10 Extreme 99% chance of damaging wind over 30 yrs
- Air quality 5/10 Major 7 unhealthy d/yr today · 7 by 30 yrs out
Nearby sold comps map
Loading sold comps map…
Walkable amenities ~0.75 mi
Loading nearby amenities…
Taxation est. · year 1
- Rental income
- $18,024
- − Mortgage interest
- −$4,476
- − Property taxes
- −$1,497
- − Insurance
- −$400
- − Repairs & maintenance
- −$1,442
- − Management
- −$1,442
- − Depreciation
- −$2,324
- Taxable income
- $6,444
- Est. tax owed @ 24.0%
- −$1,547
- After-tax cash flow
- $5,768/yr
For passive investors: Depreciation is non-cash, so a rental often shows a tax loss while cash-flowing — sheltering income. Rental losses are passive: they offset passive income freely, and up to $25,000/yr can offset ordinary (W-2) income if you actively participate and your MAGI is under $100k (phasing out to $0 by $150k); unused losses carry forward. On sale, claimed depreciation is recaptured at up to 25%, and gains may owe capital-gains tax (a 1031 exchange can defer both). Figures are a year-1 estimate at your 24.0% rate — not tax advice; consult a CPA.
Schools (NCES district)
- District
- Duval
- NCES district ID
- 1200480
- Math proficiency
- 46% ▼ -11.00%
- Reading proficiency
- 45% ▼ -4.00%
- Median HH income
- $48,987
- Composite
- 38.97/100
- National rank
- #4076
- State rank
- #48 of 73 in FL
Livability — Jacksonville
- Score
- 83/100
- State rank
- #50
- US rank
- #911
Category grades
Schools grade is shown separately in the Schools card above.
Census & demographics
- Census place
- Jacksonville, FL
- County
- Duval County · 1,015,274 people
- City population
- 979,034
- Metro
- Jacksonville, FL
- Population (ZIP)
- 29,148
- Household income
- $64,789
- Rent vs Own
- Severe rent burden
- 1398.0
Population outlook (Duval County) Hauer SSP2
- Today (2025)
- 1,013,010 people
- By 2030
- 1,059,228 · +4.6%
- By 2040
- 1,141,439 · +12.7%
- By 2050
- 1,205,258 · +19.0%
- By 2075
- 1,324,282 · +30.7%
- By 2100
- 1,319,620 · +30.3%
Race, ethnicity, and origin ACS 2023
- Neighborhood character
- Diverse neighborhood (Simpson 0.59)
- Race & ethnicity
- White 59% Black 21% Hispanic / Latino 11% Two or more races 7% Asian 3%
- Hispanic origin (detail)
- Mexican 3% Puerto Rican 4% Cuban 1%
- Common ancestry
- Slovak 3% Lithuanian 2% Romanian 2%
- Foreign-born
- 8% · Canada, Vietnam, Dominican Republic
- Languages at home
- 88% English-only · Spanish 8% Vietnamese 1% French/Haitian/Cajun 1%
Political lean MEDSL · Duval
- 2024 margin
- Toss-up / Even · D 48.7% · R 50.1% · Other 1.2%
- 2008→2024 swing
- +0.4pp no change · 2008: -1.9pp · 2024: -1.5pp
- All cycles
- 2024: R+1.5 2020: D+3.8 2016: R+1.5 2012: R+3.6 2008: R+1.9
Not yet ingested
- Civics
- —
Market trends
- HPI YoY
- ▼ -386.70%
- Current HPI
- 310.4566
- Rent YoY
- ▲ 1.73%
- Metro
- Jacksonville, FL
- State GDP YoY
- ▲ 3.28%
- F500 in state
- 36
Industry mix (Fortune 500 HQ in FL)
| Industry | F500 HQs | Revenue |
|---|---|---|
| Industrial Technology | 2 | $29B |
|
||
| Insurance | 2 | $17B |
|
||
| Retail | 1 | $60B |
|
||
| Technology Distribution | 1 | $58B |
|
||
| Homebuilding | 1 | $35B |
|
||
| Technology Manufacturing | 1 | $35B |
|
||
Price history
+539.2% since first listed18 events — show timeline
- 2026-06-05 Listed $79,900 realMLS
- 2025-02-11 Listing Removed — realMLS
- 2024-10-27 Listed $150,000 realMLS
- 2024-03-22 Sold (MLS) $75,000 realMLS
- 2024-01-30 Pending — realMLS
- 2024-01-24 Listed $65,000 realMLS
- 2023-12-22 Sold (MLS) $50,500 realMLS
- 2023-09-14 Pending — realMLS
- 2023-09-12 Relisted — realMLS
- 2023-09-06 Pending — realMLS
- 2023-09-03 Relisted — realMLS
- 2023-08-29 Pending — realMLS
- 2023-08-23 Pending — realMLS
- 2023-08-17 Relisted — realMLS
- 2023-07-05 Listing Removed — realMLS
- 2023-07-03 Listed $99,900 realMLS
- 1996-12-17 Sold (Public Records) $15,000 Public Records
- 1993-07-30 Sold (Public Records) $12,500 Public Records
Property tax history
+17.0%/yrLatest (2025): $1,497 · +36.3% YoY. Source: county tax records.
Cash-flow waterfall
monthlySold comps — $/sqft
last 12 mo · ≤1 miLoading sold comps…