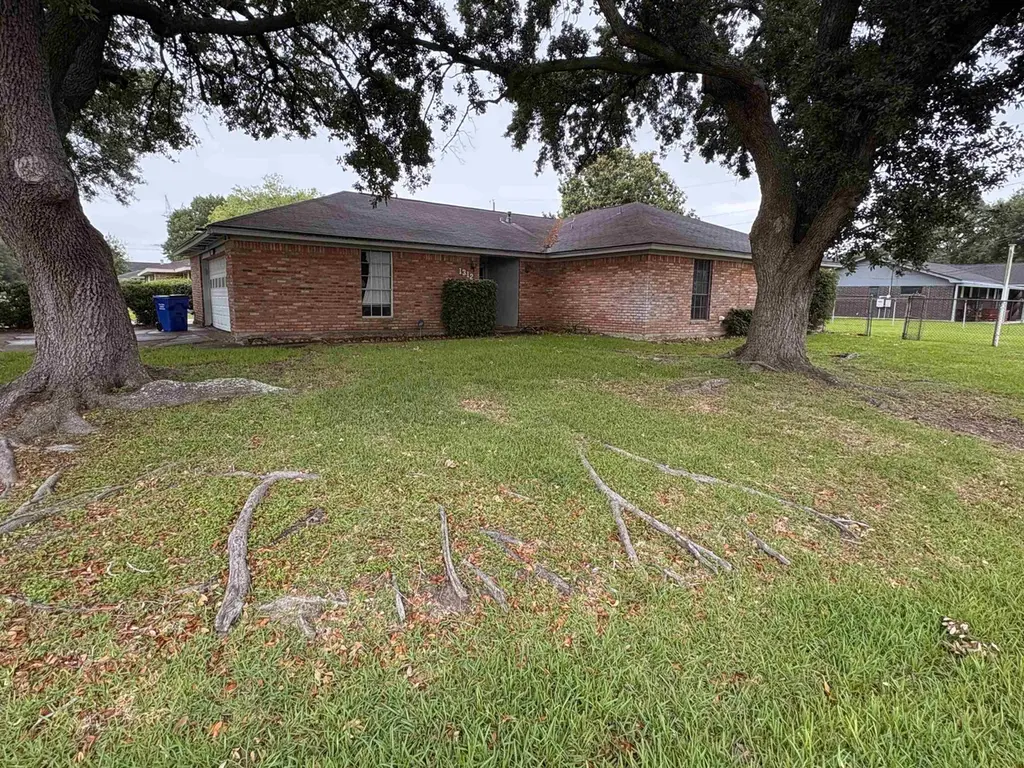
1312 Travis St · Central Gardens, TX
Flood risk 7/10 · Major
- FEMA flood zone
- X
- Chance of flooding over 30 yrs
- 0.99%
- Est. flood insurance / yr
- $507 – $1,088
Fire risk 4/10 · Minor
- Est. fire insurance / yr
- $1,222 – $2,270
Heat risk 9/10 · Severe
- Hot days now (above 109°F)
- 7 days/yr
- Hot days in 30 yrs
- 24 days/yr
Wind risk 9/10 · Severe
- Chance of severe wind over 30 yrs
- 99.0%
Air-quality risk 2/10 · Minimal
- Unhealthy air days now
- 1 days/yr
- Unhealthy air days in 30 yrs
- 1 days/yr
Risk factors via First Street. Map © Google.
Why this score? — see what drove the B- grade
The composite is a weighted blend of 9 inputs, each scored 0–100. Each bar is that input's sub-score; the figure is the points it added to the 100-point composite (weight × sub-score).
- Cash flow +27.8/30.0
- DSCR +9.8/10.0
- 1% rule +9.1/10.0
- ARV discount +7.5/15.0
- Rent growth +4.8/5.0
- Schools +4.5/10.0
- Livability +3.5/5.0
- Condition / age +2.5/5.0
- Appreciation +0.0/10.0
$139,900
🖨 Deal sheet 📄 Offer letter ✓ Due diligence
Listing remarks
Estate sale being sold strictly as-is. Seller will make no repairs. Cash buyers preferred. Great investment property with tons of potential featuring a spacious layout, oversized garage/workshop space, covered patio, brick fireplace, and mature oak trees on a corner lot. Property will require repairs and updating and is priced accordingly. Foundation movement and plumbing concerns reported. Front door currently inoperable. Buyer to independently verify all information important to them.
Key facts
- Mature oak trees
- Brick fireplace
- Covered patio
Tags
Property features AI
Exterior
- Parking: Attached 2-car garage
- Utilities: Public water; Public sewer
- Home design: Single-family residence (Residential property); Located in the Central Heights subdivision
- Construction: Brick veneer exterior; Slab foundation
- Exterior features: Composition roof; Public-maintained road access
Interior
- Bathrooms: 2 full bathrooms
- Interior features: Central air conditioning; Electric central heating
Neighborhood map
What this means for you Summary
Snapshot
- This is a 3-bed/2.0-bath single-family listed at $140k.
Deal economics
- At list price, monthly cash flow is $359 ($4k/yr) — positive.
- The deal already cash-flows at list — no discount required.
- Meets the 1% rule at list price ($2k rent vs $140k).
Location & tenants
- Location reads 70/100 on livability (#337 in TX) — a middle-class / working-renter tenant base. Strengths: crime A+, employment A+, cost of living A+; Watch: amenities F, commute F, health & safety F.
- Nederland ISD (suburban): math 51% / reading 52% proficiency, ranked #138 of 826 in TX (top 17%) — acceptable for families but not a draw, mixed tenant base, ~2y average lease.
- Market conditions: Rents rising fast (+9.3%/yr); 111 active listings in the ZIP; 4 comparable units currently listed for rent nearby; rentals at typical pace (median 24d on market — plan ~3-4 weeks tenant-placement turnaround); solid renter incomes; 343 units permitted in Jefferson County in 2024 (0 in 5+ unit buildings).
- This rent runs 30% of the median local income ($78k/yr) — at the standard rent-burdened threshold; future hikes will face affordability resistance.
Forward outlook
- Local home prices are declining (-3.0%/yr); year-one equity from $967 of loan paydown is wiped out by about $4k of value loss. Plan a longer hold.
- At projected returns (-3.0% appreciation + 8.0% rent growth), your $39k cash investment doubles in ~7 years — after that, you're playing with house money.
Negotiation context
- Only 5 days on market — expect competitive offers; lowballing is unlikely to land.
Risks & watch-outs
- Watch-outs: property tax is 2.9% of price; flood insurance adds $66/mo.
- Climate carrying-cost: major flood risk; severe wind risk, 99% chance of damaging wind over 30y; extreme-heat days projected 7→24/yr by 2055 (HVAC capex compounding) — expect insurance premiums to compound above CPI over the hold.
Questions for the listing agent
- Built in 1978 — when were the roof, HVAC, electrical panel, plumbing, and water heater last replaced?
- Property tax is high relative to price — has the assessment been appealed recently, and will the sale trigger a re-assessment?
- What's the actual annual flood-insurance premium (NFIP or private), and is the property in a SFHA with mandatory coverage?
- Is there a deadline driving the sale (1031 exchange, divorce, estate, relocation)? That informs how much negotiation room exists.
- What's the average days-on-market for RENTAL listings here right now (not sales)? A rising rental-DOM trend means longer vacancies and softer asking-rent achievability than the comps imply.
- What's the recent tenant-quality profile in this submarket — average credit score on applications, eviction rate, late-payment / NSF rate, and stable-employment percentage? A property-management company in the area should have these aggregated.
- How much new for-sale + rental construction is in the pipeline within 1–3 miles? Heavy new supply typically softens prices + rents 12–24 months out; constrained supply supports both.
Investment metrics
- 1% rule
- 1.41% ✓
- Cap rate
- 9.94%
- Cash-on-cash
- 13.03%
- DSCR
- 1.58
- GRM
- 5.9
CMA / ARV
- ARV (on-the-fly)
- $320,250
- Comps found
- 2
Show comp detail 2 sales within ~0.75 mi
| Address | Dist | Beds/Ba | Sqft | Sold | Price | $/sf | Match |
|---|---|---|---|---|---|---|---|
| 2912 Madison St | 0.02mi | 3/2.0 | 1,476 (-3%) | 23mo | $309,900 | $210 | 74 |
| 3012 Washington St | 0.14mi | 3/2.0 | 1,557 (+2%) | 21mo | $265,000 | $170 | 72 |
Match score weights: distance 35% · size 25% · config 20% · recency 20%. Top-matched comps best support the ARV.
Projected returns pro-forma
-3.0% appreciation · 8.0% rent growth · sell at horizon
- IRR
- 6.6%
- Equity multiple
- 1.27×
- Total profit
- $10,755
- Equity at exit
- $20,860
- IRR
- 20.5%
- Equity multiple
- 3.22×
- Total profit
- $86,797
- Equity at exit
- $12,096
Cash invested: $39,172 (down + closing). Projections, not guarantees.
Landlord ↔ Tenant lean methodology
- Overall (STATE)
- 87 Strongly Landlord-Friendly
- State Texas
- 87 Strongly Landlord-Friendly · R+5
- County
- — inherits STATE
- City
- — inherits STATE
ZIP-level market 77627
- Rents YoY
- 9.3%
- Active inventory
- 111
- Price-to-rent
- 5.9×
Monthly cashflow live
- Estimated rent
- $1,967 medium interval (Pro) →
- Mortgage (P&I)
- −$734
- Tax from tax record
- −$336 /mo · $4,036/yr
- Insurance
- −$58
- Flood insurance flood zone
- −$66 /mo · $798/yr
- HOA
- −$0
- Vacancy / Maint / Mgmt
- −$413
- Net cashflow
- $359
Break-even live
UW: 25.0% down · 7.5% · 30yr · 1.5% tax · 5.0% vac · 8.0% maint · 8.0% mgmt
Financing live
Cash to close
- Down payment
- $34,975
- Closing costs
- $4,197
- Reserves months
- —
- Total cash needed
- —
Loan-product check · same deal, 3 products live
Conventional
25% down · 7.5% · 30yr
- Down + closing
- —
- Monthly P&I
- —
- Monthly cashflow
- —
- DSCR
- —
- Eligible?
- —
Personal DTI + credit; lowest rate.
DSCR
20% down · 8.5% · 30yr
- Down + closing
- —
- Monthly P&I
- —
- Monthly cashflow
- —
- DSCR
- —
- Eligible?
- —
No personal income docs; deal must DSCR.
Hard money
10% down · 12.0% · 12mo
- Down + closing
- —
- Monthly P&I
- —
- Monthly cashflow
- —
- DSCR
- —
- Eligible?
- —
Short-term bridge; refi at stabilization.
Rent comps 4 comps
| Address | Beds | Baths | Sqft | Rent | $/sqft | DOM | Units | Dist |
|---|---|---|---|---|---|---|---|---|
| 1903 N 19th St Nederland, TX | 3.0 | 2.0 | 2154 | $2,950 | $1.37 | 44d | 1 | 0.81mi |
| 2707 Seattle St Nederland, TX | 3.0 | 2.5 | 2077 | $1,850 | $0.89 | 23d | 1 | 1.09mi |
| 3405 Landrey Ct Nederland, TX | 3.0 | 2.0 | 1456 | $1,746 | $1.20 | 14d | 1 | 1.22mi |
| 1815 Helena Ave Nederland, TX | 3.0 | 2.0 | 1248 | $1,750 | $1.40 | 23d | 1 | 1.37mi |
Listing history 2 events
-
2026-05-13status Pending
-
2026-05-08$139,900 Active
ⓘ Source: listings_history table (triggers on properties + properties_extension) + one-shot
backfill from property_details.listing_events for pre-trigger history.
Tax reassessment forecast TX · Resets to sale price
- Current annual tax
- $4,036 · $336/mo
- Projected year-2 tax
- $4,036 · $336/mo
- Expected delta
- $0/yr ($0/mo · 0.0%)
ⓘ Screening estimate from a state-policy table — verify with the county assessor before closing.
Climate risk First Street
- Flood 7/10 Severe FEMA zone X · 99% chance over 30 yrs
- Wildfire 4/10 Moderate
- Heat 9/10 Extreme 7 d/yr ≥109°F today · 24 d/yr by 30 yrs out
- Wind 9/10 Extreme 99% chance of damaging wind over 30 yrs
- Air quality 2/10 Low 1 unhealthy d/yr today · 1 by 30 yrs out
Nearby sold comps map
Loading sold comps map…
Walkable amenities ~0.75 mi
Loading nearby amenities…
Taxation est. · year 1
- Rental income
- $23,600
- − Mortgage interest
- −$7,837
- − Property taxes
- −$4,036
- − Insurance
- −$1,497
- − Repairs & maintenance
- −$1,888
- − Management
- −$1,888
- − Depreciation
- −$4,070
- Taxable income
- $2,385
- Est. tax owed @ 24.0%
- −$572
- After-tax cash flow
- $3,735/yr
For passive investors: Depreciation is non-cash, so a rental often shows a tax loss while cash-flowing — sheltering income. Rental losses are passive: they offset passive income freely, and up to $25,000/yr can offset ordinary (W-2) income if you actively participate and your MAGI is under $100k (phasing out to $0 by $150k); unused losses carry forward. On sale, claimed depreciation is recaptured at up to 25%, and gains may owe capital-gains tax (a 1031 exchange can defer both). Figures are a year-1 estimate at your 24.0% rate — not tax advice; consult a CPA.
Schools (NCES district)
- District
- Nederland ISD
- NCES district ID
- 4832280
- Math proficiency
- 51% ▼ -3.00%
- Reading proficiency
- 52% ▼ -3.00%
- Median HH income
- $59,647
- Composite
- 44.95/100
- National rank
- #2709
- State rank
- #138 of 826 in TX
Livability — Central Gardens
- Score
- 70/100
- State rank
- #337
- US rank
- #7335
Category grades
Schools grade is shown separately in the Schools card above.
Census & demographics
- Census place
- Central Gardens, TX
- County
- Jefferson County · 203,592 people
- Metro
- Beaumont-Port Arthur, TX
- Population (ZIP)
- 22,357
- Household income
- $78,001
- Rent vs Own
- Severe rent burden
- 572.0
Population outlook (Jefferson County) Hauer SSP2
- Today (2025)
- 259,015 people
- By 2030
- 260,685 · +0.6%
- By 2040
- 263,309 · +1.7%
- By 2050
- 265,237 · +2.4%
- By 2075
- 270,193 · +4.3%
- By 2100
- 255,628 · -1.3%
Race, ethnicity, and origin ACS 2023
- Neighborhood character
- Predominantly White (78%)
- Race & ethnicity
- White 78% Hispanic / Latino 12% Two or more races 8% Black 4% Asian 3%
- Hispanic origin (detail)
- Mexican 8%
- Common ancestry
- Lithuanian 10% Slovak 3% Italian 2%
- Foreign-born
- 5% · Canada, Vietnam
- Languages at home
- 87% English-only · Spanish 8% Other Indo-European 1% Vietnamese 1%
Political lean MEDSL · Jefferson
- 2024 margin
- Lean R (+8.9) · D 45.1% · R 54.0%
- 2008→2024 swing
- -11.1pp toward R · 2008: 2.2pp · 2024: -8.9pp
- All cycles
- 2024: R+8.9 2020: R+1.6 2016: R+0.5 2012: D+1.6 2008: D+2.2
Not yet ingested
- Civics
- —
Market trends
- HPI YoY
- ▼ -228.91%
- Current HPI
- 176.2132
- Rent YoY
- ▲ 9.27%
- Metro
- Beaumont-Port Arthur, TX
- State GDP YoY
- ▲ 3.95%
- F500 in state
- 110
Industry mix (Fortune 500 HQ in TX)
| Industry | F500 HQs | Revenue |
|---|---|---|
| Energy | 16 | $1,198B |
|
||
| Technology | 5 | $198B |
|
||
| Engineering / Construction | 4 | $72B |
|
||
| Energy Services | 3 | $60B |
|
||
| Utilities | 3 | $41B |
|
||
| Healthcare | 2 | $330B |
|
||
Price history
2 events — show timeline
- 2026-05-13 Pending — BBOR
- 2026-05-08 Listed $139,900 BBOR
Property tax history
+4.6%/yrLatest (2025): $4,036 · -0.7% YoY. Source: county tax records.
Cash-flow waterfall
monthlySold comps — $/sqft
last 12 mo · ≤1 miLoading sold comps…