 🔨 Auction
4118 Taylorsville Rd · Louisville/Jefferson County metro government (balance), KY
Flood risk 1/10 · Minimal
- FEMA flood zone
- X (unshaded)
- Chance of flooding over 30 yrs
- 0.0%
- Est. flood insurance / yr
- $473 – $860
Fire risk 1/10 · Minimal
- Est. fire insurance / yr
- $839 – $1,559
Heat risk 5/10 · Moderate
- Hot days now (above 103°F)
- 7 days/yr
- Hot days in 30 yrs
- 19 days/yr
Wind risk 2/10 · Minimal
- Chance of severe wind over 30 yrs
- 3.0%
Air-quality risk 3/10 · Minor
- Unhealthy air days now
- 2 days/yr
- Unhealthy air days in 30 yrs
- 5 days/yr
Risk factors via First Street. Map © Google.
Why this score? — see what drove the D grade
The composite is a weighted blend of 9 inputs, each scored 0–100. Each bar is that input's sub-score; the figure is the points it added to the 100-point composite (weight × sub-score).
- Cash flow +15.0/30.0
- ARV discount +7.5/15.0
- 1% rule +5.0/10.0
- DSCR +5.0/10.0
- Rent growth +3.1/5.0
- Livability +2.5/5.0
- Condition / age +2.5/5.0
- Schools +2.3/10.0
- Appreciation +0.0/10.0
$1
🖨 Deal sheet 📄 Offer letter ✓ Due diligence
Listing remarks
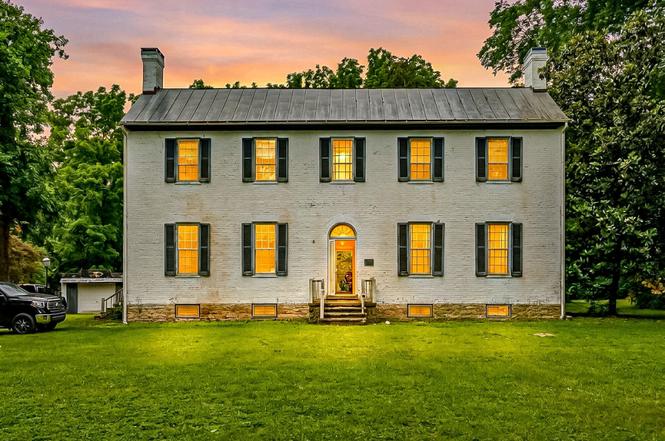
REAL ESTATE ONLINE AUCTION CEDAR GROVE HISTORIC HOME ON 1.4 ACRES OF DEVELOPMENT LAND LOUISVILLE, KY BIDDING WILL START TO END SATURDAY JUNE 27TH 11AM EASTERN TIME CEDAR GROVE ESTATE This early 1800's home sits on 1.4 acres of prime real estate in a great location. It has a total of eight rooms, over 5000 sq ft, with 4-5 bedrooms, 3 baths, two parlors, a summer kitchen, fireplaces and a basement. The house is of all brick construction, has roomy staircase landings, and an attic. This home was built by the Hikes family who located from Pennsylvania to Kentucky and built this home in the area still know as Hikes Point. Construction began in 1824 and took six years to finish according to l
Key facts
- Fireplaces
- Development land
- Brick construction
Tags
Property features AI
Finance
- Other: Directions: Take Hurstbourne Lane to Taylorsville Road to the property
- HOA & community: No association fee
Exterior
- Parking: Detached 1-car garage
- Utilities: Electricity connected
- Home design: Colonial-style residential property; 2 stories; Auction property
- Construction: Brick construction; Poured concrete foundation; Other roof type; Built in 1824; Approximately 5,500 total living area with 4,200 above grade finished space and finished/unfinished below grade areas
- Exterior features: 1.4-acre lot
Interior
- Kitchen: Kitchen on the first floor; First-floor dining room adjacent to the kitchen
- Bedrooms: 5 bedrooms (4 located on the second floor)
- Bathrooms: 2 full bathrooms
- Heating & cooling: Forced air heating; Cooling present
- Interior features: Partially finished basement; Total of 10 rooms
- Laundry & utility: Laundry located in the basement; Basement utility space
Neighborhood map
What this means for you Summary
Snapshot
- This is a 5-bed/2.0-bath single-family listed at $1.
Deal economics
- At list price, monthly cash flow is $2k ($21k/yr) — positive.
- The deal already cash-flows at list — no discount required.
- Meets the 1% rule at list price ($2k rent vs $1).
- Cap rate 2101865.7% vs local median 4.0% in Louisville/Jefferson County metro government (balance) — top-decile yield for the area; either an underpriced asset or a hidden risk that comps aren't pricing in. Stress-test before assuming the spread holds.
Location & tenants
- Location reads: area grade D — affects rentability + tenant quality, not the cash-flow math above.
- Jefferson County (urban): math 19% / reading 35% proficiency, ranked #121 of 165 in KY (top 73%) — low school quality limits family demand, transient renter base, plan for 1-2y turnover.
- Market conditions: Rents rising (+2.4%/yr); 114 active listings in the ZIP; solid renter incomes; 2,836 units permitted in Jefferson County in 2024 (1,558 in 5+ unit buildings).
- This rent runs 34% of the median local income ($78k/yr) — at the standard rent-burdened threshold; future hikes will face affordability resistance.
Forward outlook
- Local home prices are declining (-3.0%/yr); year-one equity from $0 of loan paydown is wiped out by about $0 of value loss. Plan a longer hold.
- Jefferson County population projected at +13% by 2050 — modest demand growth; plan on rents tracking national, not racing it.
- At projected returns (-3.0% appreciation + 2.4% rent growth), your $0 cash investment doubles in ~1 year — after that, you're playing with house money.
Negotiation context
- Only 1 days on market — expect competitive offers; lowballing is unlikely to land.
Risks & watch-outs
- Watch-outs: built in 1824 — expect roof / HVAC / electrical / plumbing capex.
- Climate carrying-cost: extreme-heat days projected 7→19/yr by 2055 (HVAC capex compounding) — expect insurance premiums to compound above CPI over the hold.
Questions for the listing agent
- Built in 1824 — when were the roof, HVAC, electrical panel, plumbing, and water heater last replaced?
- Is there a deadline driving the sale (1031 exchange, divorce, estate, relocation)? That informs how much negotiation room exists.
- The area grade is low — what's the realistic commute time and amenity access for the typical tenant pool here? Any planned neighborhood developments (good or bad) we should know about?
- What's the average days-on-market for RENTAL listings here right now (not sales)? A rising rental-DOM trend means longer vacancies and softer asking-rent achievability than the comps imply.
- What's the recent tenant-quality profile in this submarket — average credit score on applications, eviction rate, late-payment / NSF rate, and stable-employment percentage? A property-management company in the area should have these aggregated.
- How much new for-sale + rental construction is in the pipeline within 1–3 miles? Heavy new supply typically softens prices + rents 12–24 months out; constrained supply supports both.
Investment metrics
- 1% rule
- 221716.00% ✓
- Cap rate
- 2101865.68%
- Cash-on-cash
- 7506640.67%
- DSCR
- 334004.27
- GRM
- 0.0
CMA / ARV
No comps found within radius.
Projected returns pro-forma
-3.0% appreciation · 2.4% rent growth · sell at horizon
- IRR
- —
- Equity multiple
- 393785.97×
- Total profit
- $110,260
- Equity at exit
- $0
- IRR
- —
- Equity multiple
- 837149.11×
- Total profit
- $234,401
- Equity at exit
- $0
Cash invested: $0 (down + closing). Projections, not guarantees.
Landlord ↔ Tenant lean methodology
- Overall (STATE)
- 83 Strongly Landlord-Friendly
- State Kentucky
- 83 Strongly Landlord-Friendly · R+16
- County
- — inherits STATE
- City
- — inherits STATE
ZIP-level market 40220
- Rents YoY
- 2.4%
- Active inventory
- 114
Monthly cashflow live
- Estimated rent
- $2,217 medium interval (Pro) →
- Mortgage (P&I)
- −$0
- Tax est. 1.5%
- −$0 /mo · $0/yr
- Insurance
- −$0
- HOA
- −$0
- Vacancy / Maint / Mgmt
- −$466
- Net cashflow
- $1,752
Break-even live
UW: 25.0% down · 7.5% · 30yr · 1.5% tax · 5.0% vac · 8.0% maint · 8.0% mgmt
Financing live
Cash to close
- Down payment
- $0
- Closing costs
- $0
- Reserves months
- —
- Total cash needed
- —
Loan-product check · same deal, 3 products live
Conventional
25% down · 7.5% · 30yr
- Down + closing
- —
- Monthly P&I
- —
- Monthly cashflow
- —
- DSCR
- —
- Eligible?
- —
Personal DTI + credit; lowest rate.
DSCR
20% down · 8.5% · 30yr
- Down + closing
- —
- Monthly P&I
- —
- Monthly cashflow
- —
- DSCR
- —
- Eligible?
- —
No personal income docs; deal must DSCR.
Hard money
10% down · 12.0% · 12mo
- Down + closing
- —
- Monthly P&I
- —
- Monthly cashflow
- —
- DSCR
- —
- Eligible?
- —
Short-term bridge; refi at stabilization.
Listing history 2 events
-
2026-06-17remarks 699-char remark
-
2026-06-17$1 Active 1 DOM
ⓘ Source: listings_history table (triggers on properties + properties_extension) + one-shot
backfill from property_details.listing_events for pre-trigger history.
Climate risk First Street
- Flood 1/10 Low FEMA zone X (unshaded) · 0% chance over 30 yrs
- Wildfire 1/10 Low
- Heat 5/10 Major 7 d/yr ≥103°F today · 19 d/yr by 30 yrs out
- Wind 2/10 Low 3% chance of damaging wind over 30 yrs
- Air quality 3/10 Moderate 2 unhealthy d/yr today · 5 by 30 yrs out
Nearby sold comps map
Loading sold comps map…
Walkable amenities ~0.75 mi
Loading nearby amenities…
Taxation est. · year 1
- Rental income
- $26,606
- − Mortgage interest
- −$0
- − Property taxes
- −$0
- − Insurance
- −$0
- − Repairs & maintenance
- −$2,128
- − Management
- −$2,128
- − Depreciation
- −$0
- Taxable income
- $22,349
- Est. tax owed @ 24.0%
- −$5,364
- After-tax cash flow
- $15,655/yr
For passive investors: Depreciation is non-cash, so a rental often shows a tax loss while cash-flowing — sheltering income. Rental losses are passive: they offset passive income freely, and up to $25,000/yr can offset ordinary (W-2) income if you actively participate and your MAGI is under $100k (phasing out to $0 by $150k); unused losses carry forward. On sale, claimed depreciation is recaptured at up to 25%, and gains may owe capital-gains tax (a 1031 exchange can defer both). Figures are a year-1 estimate at your 24.0% rate — not tax advice; consult a CPA.
Schools (NCES district)
- District
- Jefferson County
- NCES district ID
- 2102990
- Math proficiency
- 19% ▼ -17.00%
- Reading proficiency
- 35% ▼ -11.00%
- Median HH income
- $47,885
- Composite
- 23.45/100
- National rank
- #7884
- State rank
- #121 of 165 in KY
Livability — Louisville/Jefferson County metro government (balance)
No livability data for this city. (Only ~50 U.S. cities are tracked.)
Census & demographics
- Census place
- Louisville/Jefferson County metro government (balance), KY
- County
- Jefferson County · 790,184 people
- City population
- 419,741
- Metro
- Louisville/Jefferson County, KY-IN
- Population (ZIP)
- 35,078
- Household income
- $78,434
- Rent vs Own
- Severe rent burden
- 1012.0
Population outlook (Jefferson County) Hauer SSP2
- Today (2025)
- 823,112 people
- By 2030
- 849,343 · +3.2%
- By 2040
- 895,696 · +8.8%
- By 2050
- 933,630 · +13.4%
- By 2075
- 1,028,262 · +24.9%
- By 2100
- 1,072,675 · +30.3%
Race, ethnicity, and origin ACS 2023
- Neighborhood character
- Predominantly White (72%)
- Race & ethnicity
- White 72% Black 14% Two or more races 6% Asian 5% Hispanic / Latino 5%
- Common ancestry
- Lithuanian 2% Slovak 2% Italian 2%
- Foreign-born
- 10% · Canada, South Korea
- Languages at home
- 88% English-only · Spanish 3% Other Asian/Pacific 2% Other Indo-European 2%
Political lean MEDSL · Jefferson
- 2024 margin
- D (+16.6) · D 57.4% · R 40.9% · Other 1.7%
- 2008→2024 swing
- +4.5pp toward D · 2008: 12.0pp · 2024: 16.6pp
- All cycles
- 2024: D+16.6 2020: D+20.1 2016: D+13.3 2012: D+11.1 2008: D+12.0
Not yet ingested
- Civics
- —
Market trends
- HPI YoY
- ▼ -297.08%
- Current HPI
- 226.4036
- Rent YoY
- ▲ 2.40%
- Metro
- Louisville/Jefferson County, KY-IN
- State GDP YoY
- ▲ 1.81%
- F500 in state
- 4
Industry mix (Fortune 500 HQ in KY)
| Industry | F500 HQs | Revenue |
|---|---|---|
| Healthcare | 1 | $118B |
|
||
| Food / Beverage | 1 | $7B |
|
||
Property tax history
+4.9%/yrLatest (2025): $4,051 · -0.2% YoY. Source: county tax records.
Cash-flow waterfall
monthlySold comps — $/sqft
last 12 mo · ≤1 miLoading sold comps…