1516 Olympia Rd · South Venice, FL
Flood risk 5/10 · Moderate
- FEMA flood zone
- X (shaded)
- Chance of flooding over 30 yrs
- 0.23%
- Est. flood insurance / yr
- $507 – $1,088
Fire risk 2/10 · Minimal
- Est. fire insurance / yr
- $947 – $1,759
Heat risk 10/10 · Severe
- Hot days now (above 107°F)
- 7 days/yr
- Hot days in 30 yrs
- 27 days/yr
Wind risk 10/10 · Severe
- Chance of severe wind over 30 yrs
- 99.0%
Air-quality risk 2/10 · Minimal
- Unhealthy air days now
- 1 days/yr
- Unhealthy air days in 30 yrs
- 1 days/yr
Risk factors via First Street. Map © Google.
Why this score? — see what drove the D- grade
The composite is a weighted blend of 9 inputs, each scored 0–100. Each bar is that input's sub-score; the figure is the points it added to the 100-point composite (weight × sub-score).
- Cash flow +10.7/30.0
- ARV discount +7.5/15.0
- Schools +5.4/10.0
- Livability +3.4/5.0
- DSCR +3.1/10.0
- Rent growth +2.7/5.0
- 1% rule +2.6/10.0
- Condition / age +2.5/5.0
- Appreciation +0.0/10.0
$285,000
🖨 Deal sheet 📄 Offer letter ✓ Due diligence
Listing remarks MLS
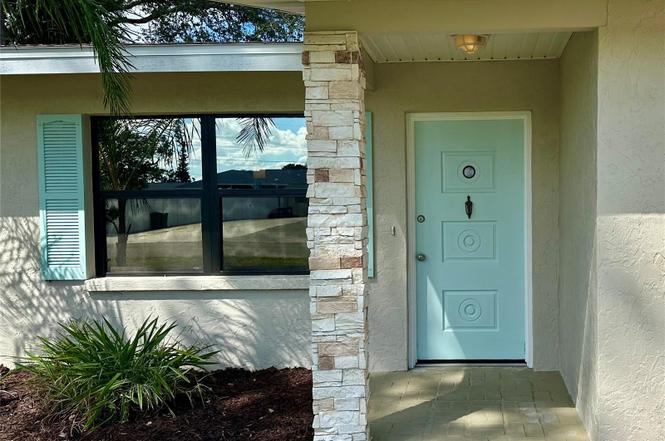
What a great value! This home is located close to the Gulf, Tamiami Trail and State Parks. 2 carpeted bedrooms, 2 full baths featuring glass block, and spacious backyard. This is a Fannie Mae HomePath property and subject to First Look Program. Purchase this property for as little as 3% down! This property is approved for HomePath Mortgage and Homepath Renovation Financing.
Key facts
- 200 sq ft wood shed
- Split floor plan
- Built in fire pit
Tags
Property features AI
Finance
- Other: Living area approximately 1,267 (estimated); Lot roughly 0.18 acres (approx. 80 x 100); No homestead indicated; Zoning: RSF3; Property ID available
- Financial info: Lease restrictions apply
- HOA & community: No homeowners association indicated; Pets allowed
Exterior
- Parking: Driveway; Garage door opener; Attached garage with 1 garage space
- Utilities: Well water; Septic tank; Cable connected; Electricity connected
- Home design: Single family residence; Residential property; One story; Southwest facing; Entry level: One
- Construction: Block construction; Shingle roof; Slab foundation; Built area (public records): 1,694 total building area
- Exterior features: Private mailbox; Sliding doors; Storage; Shed(s); Private paved lot; Public maintained paved road; Street lights (community)
Interior
- Kitchen: Dishwasher; Range; Refrigerator; Disposal
- Bedrooms: 2 bedrooms
- Flooring: Carpet; Tile
- Bathrooms: 2 full bathrooms
- Heating & cooling: Electric heating; Central air conditioning
- Interior features: Ceiling fans; Living room/dining room combo; Thermostat; Florida room
- Laundry & utility: Washer hookup; Electric dryer hookup; Washer; Dryer
Neighborhood map
What this means for you Summary
Snapshot
- This is a 2-bed/2.0-bath single-family listed at $285k.
Deal economics
- At list price, monthly cash flow is $-134 ($-2k/yr) — negative.
- To cash-flow at today's rent, offer at most $261k (8.3% below list).
- To meet the 1% rule (rent ≥ 1% of price), the offer needs to be $216k (24.2% below list).
- Recommended offer: $216k (24.2% below list) — sets the bar for 1% rule.
Location & tenants
- Location reads 67/100 on livability (#549 in FL) — a middle-class / working-renter tenant base. Strengths: housing A+, crime A-, cost of living A-; Watch: schools F, amenities F, commute F.
- Sarasota (urban): math 63% / reading 63% proficiency, ranked #7 of 73 in FL (top 10%) — acceptable for families but not a draw, mixed tenant base, ~2y average lease.
- Market conditions: Rents flat; 1247 active listings in the ZIP; solid renter incomes; 7,466 units permitted in Sarasota County in 2024 (2,138 in 5+ unit buildings).
Forward outlook
- Local home prices are declining (-3.0%/yr); year-one equity from $2k of loan paydown is wiped out by about $9k of value loss. Plan a longer hold.
- Sarasota County population projected at +20% by 2050 — long-run rental-demand tailwind backs the buy-and-hold thesis.
Negotiation context
- It's been on market 194 days — a 12% lower offer ($251k) is reasonable based on typical stale-listing flexibility.
- 3 sale attempts since 13y ago; this cycle's ask has dropped $34k (11%) from the opening price — seller is motivated, your offer sets the floor, not the list.
- Current owner paid $110k; list at $285k implies a 159% gain — meaningful room to come down on a strong offer.
Risks & watch-outs
- Climate carrying-cost: moderate flood risk; severe wind risk, 99% chance of damaging wind over 30y; extreme-heat days projected 7→27/yr by 2055 (HVAC capex compounding) — expect insurance premiums to compound above CPI over the hold.
Questions for the listing agent
- What do current leases actually rent for vs. the listed asking? Can we see a recent rent roll and the last 12 months of T-12 income?
- It's been on market 194 days. Have you received any prior offers? Is the seller open to a 24% concession, seller financing, or rate buy-down credit?
- Built in 1975 — when were the roof, HVAC, electrical panel, plumbing, and water heater last replaced?
- Why hasn't it sold? Are there any deal-killer items the seller is aware of (foundation, flood, title, zoning, code violations)?
- Is there a deadline driving the sale (1031 exchange, divorce, estate, relocation)? That informs how much negotiation room exists.
- Schools are F-rated, which usually means shorter tenancies and higher turnover. Who's the typical renter profile here, and what's been the actual vacancy rate?
- The area grade is low — what's the realistic commute time and amenity access for the typical tenant pool here? Any planned neighborhood developments (good or bad) we should know about?
- What's the average days-on-market for RENTAL listings here right now (not sales)? A rising rental-DOM trend means longer vacancies and softer asking-rent achievability than the comps imply.
- What's the recent tenant-quality profile in this submarket — average credit score on applications, eviction rate, late-payment / NSF rate, and stable-employment percentage? A property-management company in the area should have these aggregated.
- How much new for-sale + rental construction is in the pipeline within 1–3 miles? Heavy new supply typically softens prices + rents 12–24 months out; constrained supply supports both.
Investment metrics
- 1% rule
- 0.76% ✗
- Cap rate
- 5.73%
- Cash-on-cash
- -2.01%
- DSCR
- 0.91
- GRM
- 11.0
CMA / ARV
No comps found within radius.
Projected returns pro-forma
-3.0% appreciation · 0.7% rent growth · sell at horizon
- IRR
- -22.1%
- Equity multiple
- 0.25×
- Total profit
- $-59,646
- Equity at exit
- $42,494
- IRR
- -22.4%
- Equity multiple
- -0.03×
- Total profit
- $-82,270
- Equity at exit
- $24,642
Cash invested: $79,800 (down + closing). Projections, not guarantees.
Landlord ↔ Tenant lean methodology
- Overall (STATE)
- 87 Strongly Landlord-Friendly
- State Florida
- 87 Strongly Landlord-Friendly · R+3
- County
- — inherits STATE
- City
- — inherits STATE
ZIP-level market 34293
- Rents YoY
- 0.7%
- Active inventory
- 1247
- Price-to-rent
- 11.0×
Monthly cashflow live
- Estimated rent
- $2,162 medium interval (Pro) →
- Mortgage (P&I)
- −$1,495
- Tax from tax record
- −$228 /mo · $2,740/yr
- Insurance
- −$119
- HOA
- −$0
- Vacancy / Maint / Mgmt
- −$454
- Net cashflow
- $-134
Break-even live
UW: 25.0% down · 7.5% · 30yr · 1.5% tax · 5.0% vac · 8.0% maint · 8.0% mgmt
Financing live
Cash to close
- Down payment
- $71,250
- Closing costs
- $8,550
- Reserves months
- —
- Total cash needed
- —
Loan-product check · same deal, 3 products live
Conventional
25% down · 7.5% · 30yr
- Down + closing
- —
- Monthly P&I
- —
- Monthly cashflow
- —
- DSCR
- —
- Eligible?
- —
Personal DTI + credit; lowest rate.
DSCR
20% down · 8.5% · 30yr
- Down + closing
- —
- Monthly P&I
- —
- Monthly cashflow
- —
- DSCR
- —
- Eligible?
- —
No personal income docs; deal must DSCR.
Hard money
10% down · 12.0% · 12mo
- Down + closing
- —
- Monthly P&I
- —
- Monthly cashflow
- —
- DSCR
- —
- Eligible?
- —
Short-term bridge; refi at stabilization.
Listing history 14 events
-
2026-05-01status Pending
-
2026-04-23price $285,000
-
2026-04-19status Active
-
2026-04-17historical
-
2026-03-11price $294,000
-
2025-12-29price $299,000
-
2025-12-13price $308,900
-
2025-10-17$319,000 Active
-
2022-02-11price $2,400
-
2013-08-22soldstatus $110,112 377-char remark
Show marketing remark (377 chars)
What a great value! This home is located close to the Gulf, Tamiami Trail and State Parks. 2 carpeted bedrooms, 2 full baths featuring glass block, and spacious backyard. This is a Fannie Mae HomePath property and subject to First Look Program. Purchase this property for as little as 3% down! This property is approved for HomePath Mortgage and Homepath Renovation Financing.
-
2013-03-07$104,900 377-char remark
Show marketing remark (377 chars)
What a great value! This home is located close to the Gulf, Tamiami Trail and State Parks. 2 carpeted bedrooms, 2 full baths featuring glass block, and spacious backyard. This is a Fannie Mae HomePath property and subject to First Look Program. Purchase this property for as little as 3% down! This property is approved for HomePath Mortgage and Homepath Renovation Financing.
-
2005-11-18soldstatus $249,500
-
1994-03-11soldstatus $65,000
-
1992-09-21soldstatus $57,700
ⓘ Source: listings_history table (triggers on properties + properties_extension) + one-shot
backfill from property_details.listing_events for pre-trigger history.
Tax reassessment forecast FL · Resets to sale price
- Current annual tax
- $2,740 · $228/mo
- Projected year-2 tax
- $2,740 · $228/mo
- Expected delta
- $0/yr ($0/mo · 0.0%)
ⓘ Screening estimate from a state-policy table — verify with the county assessor before closing.
Climate risk First Street
- Flood 5/10 Major FEMA zone X (shaded) · 23% chance over 30 yrs
- Wildfire 2/10 Low
- Heat 10/10 Extreme 7 d/yr ≥107°F today · 27 d/yr by 30 yrs out
- Wind 10/10 Extreme 99% chance of damaging wind over 30 yrs
- Air quality 2/10 Low 1 unhealthy d/yr today · 1 by 30 yrs out
Nearby sold comps map
Loading sold comps map…
Walkable amenities ~0.75 mi
Loading nearby amenities…
Taxation est. · year 1
- Rental income
- $25,941
- − Mortgage interest
- −$15,964
- − Property taxes
- −$2,740
- − Insurance
- −$1,425
- − Repairs & maintenance
- −$2,075
- − Management
- −$2,075
- − Depreciation
- −$8,291
- Taxable loss
- −$6,630
- Est. tax savings @ 24.0%
- +$1,591
- After-tax cash flow
- $-15/yr
For passive investors: Depreciation is non-cash, so a rental often shows a tax loss while cash-flowing — sheltering income. Rental losses are passive: they offset passive income freely, and up to $25,000/yr can offset ordinary (W-2) income if you actively participate and your MAGI is under $100k (phasing out to $0 by $150k); unused losses carry forward. On sale, claimed depreciation is recaptured at up to 25%, and gains may owe capital-gains tax (a 1031 exchange can defer both). Figures are a year-1 estimate at your 24.0% rate — not tax advice; consult a CPA.
Schools (NCES district)
- District
- Sarasota
- NCES district ID
- 1201680
- Math proficiency
- 63% ▼ -8.00%
- Reading proficiency
- 63% ▼ -3.00%
- Median HH income
- $51,167
- Composite
- 53.68/100
- National rank
- #1428
- State rank
- #7 of 73 in FL
Livability — South Venice
- Score
- 67/100
- State rank
- #549
- US rank
- #10377
Category grades
Schools grade is shown separately in the Schools card above.
Census & demographics
- Census place
- South Venice, FL
- County
- Sarasota County · 448,376 people
- Metro
- North Port-Sarasota-Bradenton, FL
- Population (ZIP)
- 50,278
- Household income
- $90,038
- Rent vs Own
- Severe rent burden
- 548.0
Population outlook (Sarasota County) Hauer SSP2
- Today (2025)
- 452,380 people
- By 2030
- 474,175 · +4.8%
- By 2040
- 511,577 · +13.1%
- By 2050
- 541,467 · +19.7%
- By 2075
- 604,947 · +33.7%
- By 2100
- 621,965 · +37.5%
Race, ethnicity, and origin ACS 2023
- Neighborhood character
- Predominantly White (90%)
- Race & ethnicity
- White 90% Hispanic / Latino 5% Two or more races 4% Asian 2%
- Hispanic origin (detail)
- Mexican 1% Puerto Rican 2%
- Common ancestry
- Romanian 7% Lithuanian 4% Slovak 3%
- Foreign-born
- 9% · Canada, China, Dominican Republic
- Languages at home
- 90% English-only · Spanish 3% Russian/Polish/Slavic 2% French/Haitian/Cajun 1%
Political lean MEDSL · Sarasota
- 2024 margin
- R (+18.2) · D 40.5% · R 58.7%
- 2008→2024 swing
- -18.1pp toward R · 2008: -0.1pp · 2024: -18.2pp
- All cycles
- 2024: R+18.2 2020: R+10.4 2016: R+11.6 2012: R+7.4 2008: R+0.1
Not yet ingested
- Civics
- —
Market trends
- HPI YoY
- ▼ -355.64%
- Current HPI
- 270.5242
- Rent YoY
- ▲ 0.70%
- Metro
- North Port-Sarasota-Bradenton, FL
- State GDP YoY
- ▲ 3.28%
- F500 in state
- 36
Industry mix (Fortune 500 HQ in FL)
| Industry | F500 HQs | Revenue |
|---|---|---|
| Industrial Technology | 2 | $29B |
|
||
| Insurance | 2 | $17B |
|
||
| Retail | 1 | $60B |
|
||
| Technology Distribution | 1 | $58B |
|
||
| Homebuilding | 1 | $35B |
|
||
| Technology Manufacturing | 1 | $35B |
|
||
Price history
+393.9% since first listed14 events — show timeline
- 2026-05-01 Pending — Stellar MLS as Distributed by MLS Grid
- 2026-04-23 Price Changed $285,000 Stellar MLS as Distributed by MLS Grid
- 2026-04-19 Relisted — Stellar MLS as Distributed by MLS Grid
- 2026-04-17 Listing Removed — Stellar MLS as Distributed by MLS Grid
- 2026-03-11 Price Changed $294,000 Stellar MLS as Distributed by MLS Grid
- 2025-12-29 Price Changed $299,000 Stellar MLS as Distributed by MLS Grid
- 2025-12-13 Price Changed $308,900 Stellar MLS as Distributed by MLS Grid
- 2025-10-17 Listed $319,000 Stellar MLS as Distributed by MLS Grid
- 2022-02-11 Price Changed $2,400 RENT.
- 2013-08-22 Sold (MLS) $110,112 Stellar MLS as Distributed by MLS Grid
- 2013-03-07 Listed $104,900 Stellar MLS as Distributed by MLS Grid
- 2005-11-18 Sold (Public Records) $249,500 Public Records
- 1994-03-11 Sold (Public Records) $65,000 Public Records
- 1992-09-21 Sold (Public Records) $57,700 Public Records
Property tax history
+10.9%/yrLatest (2025): $2,740 · +2.2% YoY. Source: county tax records.
Cash-flow waterfall
monthlySold comps — $/sqft
last 12 mo · ≤1 miLoading sold comps…