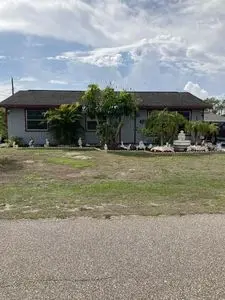
18071 Clanton Ave · Port Charlotte, FL
Flood risk 8/10 · Major
- FEMA flood zone
- X (shaded)
- Chance of flooding over 30 yrs
- 0.97%
- Est. flood insurance / yr
- $507 – $1,088
Fire risk 1/10 · Minimal
- Est. fire insurance / yr
- $947 – $1,759
Heat risk 10/10 · Severe
- Hot days now (above 107°F)
- 7 days/yr
- Hot days in 30 yrs
- 28 days/yr
Wind risk 10/10 · Severe
- Chance of severe wind over 30 yrs
- 99.0%
Air-quality risk 3/10 · Minor
- Unhealthy air days now
- 2 days/yr
- Unhealthy air days in 30 yrs
- 3 days/yr
Risk factors via First Street. Map © Google.
Why this score? — see what drove the B grade
The composite is a weighted blend of 9 inputs, each scored 0–100. Each bar is that input's sub-score; the figure is the points it added to the 100-point composite (weight × sub-score).
- Cash flow +28.6/30.0
- ARV discount +15.0/15.0
- DSCR +10.0/10.0
- 1% rule +7.0/10.0
- Schools +4.6/10.0
- Livability +3.2/5.0
- Condition / age +2.5/5.0
- Rent growth +2.1/5.0
- Appreciation +0.0/10.0
$150,000
🖨 Deal sheet 📄 Offer letter ✓ Due diligence
Listing remarks
Charming Port Charlotte Home. Don’t miss this well-kept 3-bedroom, 1-bath home offering 1,120 square feet of living space on a 10,000 sq. ft. lot in a quiet, established neighborhood of Port Charlotte. Built in 1981, this property is packed with value and is conveniently located just minutes from elementary, middle, and high schools, shopping, restaurants, and hospitals. This home comes with all appliances included, featuring a black refrigerator, stove, microwave, washer, and dryer, plus the convenience of an inside laundry room. Step outside and enjoy your own private backyard retreat with a spacious 12x16 back deck, complete with a Softub hot tub and tool closet on the deck. The fu
Key facts
- 9,999 sq ft lot
- Pool
- Built 1981
Property features AI
Finance
- HOA & community: No association
Exterior
- Utilities: Public water; Septic sewer; Electricity connected
- Home design: Single-family residence; One story; North-facing entry
- Construction: Frame construction; Shingle roof; Slab foundation; Built on site (year not provided)
- Exterior features: Above-ground private pool; Paved road access
Interior
- Kitchen: Range; Refrigerator
- Bedrooms: 3 bedrooms
- Flooring: Carpet; Vinyl
- Bathrooms: 1 full bathroom
- Heating & cooling: Central heating; Central air
- Interior features: Walk-in closet(s)
- Laundry & utility: Laundry closet; Washer; Dryer; Electric water heater
Neighborhood map
What this means for you Summary
Snapshot
- This is a 2-bed/1.0-bath single-family listed at $150k.
Deal economics
- At list price, monthly cash flow is $428 ($5k/yr) — positive.
- The deal already cash-flows at list — no discount required.
- Meets the 1% rule at list price ($2k rent vs $150k).
- Cap rate 10.2% vs local median 4.4% in Port Charlotte — top-decile yield for the area; either an underpriced asset or a hidden risk that comps aren't pricing in. Stress-test before assuming the spread holds.
Location & tenants
- Location reads 65/100 on livability (#655 in FL) — a middle-class / working-renter tenant base. Strengths: cost of living A+, housing A+; Watch: schools D+, employment D, amenities F.
- Charlotte (suburban): math 54% / reading 54% proficiency, ranked #22 of 73 in FL (top 30%) — acceptable for families but not a draw, mixed tenant base, ~2y average lease.
- Market conditions: Rents soft (-1.6%/yr); 953 active listings in the ZIP; 17 comparable units currently listed for rent nearby; rentals at typical pace (median 21d on market — plan ~3-4 weeks tenant-placement turnaround); 4,585 units permitted in Charlotte County in 2024 (703 in 5+ unit buildings).
- This rent runs 34% of the median local income ($63k/yr) — at the standard rent-burdened threshold; future hikes will face affordability resistance.
Forward outlook
- Local home prices are declining (-3.0%/yr); year-one equity from $1k of loan paydown is wiped out by about $4k of value loss. Plan a longer hold.
- Charlotte County population projected at +24% by 2050 — long-run rental-demand tailwind backs the buy-and-hold thesis.
Negotiation context
- Only 14 days on market — expect competitive offers; lowballing is unlikely to land.
- Current owner paid $46k; list at $150k implies a 230% gain — meaningful room to come down on a strong offer.
Risks & watch-outs
- Watch-outs: flood insurance adds $66/mo.
- Climate carrying-cost: severe flood risk; severe wind risk, 99% chance of damaging wind over 30y; extreme-heat days projected 7→28/yr by 2055 (HVAC capex compounding) — expect insurance premiums to compound above CPI over the hold.
Questions for the listing agent
- What's the actual annual flood-insurance premium (NFIP or private), and is the property in a SFHA with mandatory coverage?
- Is there a deadline driving the sale (1031 exchange, divorce, estate, relocation)? That informs how much negotiation room exists.
- Schools are D-rated, which usually means shorter tenancies and higher turnover. Who's the typical renter profile here, and what's been the actual vacancy rate?
- What's the average days-on-market for RENTAL listings here right now (not sales)? A rising rental-DOM trend means longer vacancies and softer asking-rent achievability than the comps imply.
- What's the recent tenant-quality profile in this submarket — average credit score on applications, eviction rate, late-payment / NSF rate, and stable-employment percentage? A property-management company in the area should have these aggregated.
- How much new for-sale + rental construction is in the pipeline within 1–3 miles? Heavy new supply typically softens prices + rents 12–24 months out; constrained supply supports both.
Investment metrics
- 1% rule
- 1.20% ✓
- Cap rate
- 10.25%
- Cash-on-cash
- 14.13%
- DSCR
- 1.63
- GRM
- 6.9
CMA / ARV
- ARV (on-the-fly)
- $192,640
- Comps found
- 9
Show comp detail 9 sales within ~0.75 mi
| Address | Dist | Beds/Ba | Sqft | Sold | Price | $/sf | Match |
|---|---|---|---|---|---|---|---|
| 18103 Clanton Ave | 0.06mi | 2/1.0 | 1,148 (+2%) | 12mo | $197,500 | $172 | 83 |
| 2318 Summit St | 0.04mi | 2/2.0 | 968 (-14%) | 2mo | $224,000 | $231 | 70 |
| 18104 Windingvail Ave | 0.28mi | 2/2.0 | 1,263 (+13%) | 2mo | $223,000 | $177 | 60 |
| 18033 Cochran Blvd | 0.63mi | 2/1.5 | 1,090 (-3%) | 7mo | $185,000 | $170 | 58 |
| 2341 Granadeer St | 0.51mi | 3/2.0 (+1) | 1,183 (+6%) | 5mo | $223,000 | $189 | 54 |
| 18130 Steele Ave | 0.33mi | 2/2.0 | 1,241 (+11%) | 14mo | $212,500 | $171 | 51 |
| 2174 Taunt St | 0.64mi | 3/2.0 (+1) | 1,050 (-6%) | 5mo | $192,000 | $183 | 47 |
| 2394 Box St | 0.63mi | 3/2.0 (+1) | 1,012 (-10%) | 7mo | $156,000 | $154 | 40 |
| 18275 Cortland Ave | 0.54mi | 3/2.0 (+1) | 1,273 (+14%) | 22mo | $170,000 | $134 | 25 |
Match score weights: distance 35% · size 25% · config 20% · recency 20%. Top-matched comps best support the ARV.
Projected returns pro-forma
-3.0% appreciation · 0.0% rent growth · sell at horizon
- IRR
- -1.5%
- Equity multiple
- 0.94×
- Total profit
- $-2,314
- Equity at exit
- $22,365
- IRR
- 4.7%
- Equity multiple
- 1.30×
- Total profit
- $12,710
- Equity at exit
- $12,969
Cash invested: $42,000 (down + closing). Projections, not guarantees.
Landlord ↔ Tenant lean methodology
- Overall (STATE)
- 87 Strongly Landlord-Friendly
- State Florida
- 87 Strongly Landlord-Friendly · R+3
- County
- — inherits STATE
- City
- — inherits STATE
ZIP-level market 33948
- Home prices YoY
- -14.9%
- Rents YoY
- -1.6%
- Active inventory
- 953
- Price-to-rent
- 6.9×
Monthly cashflow live
- Estimated rent
- $1,800 high interval (Pro) →
- Mortgage (P&I)
- −$787
- Tax from tax record
- −$79 /mo · $943/yr
- Insurance
- −$62
- Flood insurance flood zone
- −$66 /mo · $798/yr
- HOA
- −$0
- Vacancy / Maint / Mgmt
- −$378
- Net cashflow
- $428
Break-even live
UW: 25.0% down · 7.5% · 30yr · 1.5% tax · 5.0% vac · 8.0% maint · 8.0% mgmt
Financing live
Cash to close
- Down payment
- $37,500
- Closing costs
- $4,500
- Reserves months
- —
- Total cash needed
- —
Loan-product check · same deal, 3 products live
Conventional
25% down · 7.5% · 30yr
- Down + closing
- —
- Monthly P&I
- —
- Monthly cashflow
- —
- DSCR
- —
- Eligible?
- —
Personal DTI + credit; lowest rate.
DSCR
20% down · 8.5% · 30yr
- Down + closing
- —
- Monthly P&I
- —
- Monthly cashflow
- —
- DSCR
- —
- Eligible?
- —
No personal income docs; deal must DSCR.
Hard money
10% down · 12.0% · 12mo
- Down + closing
- —
- Monthly P&I
- —
- Monthly cashflow
- —
- DSCR
- —
- Eligible?
- —
Short-term bridge; refi at stabilization.
Rent comps 17 comps
| Address | Beds | Baths | Sqft | Rent | $/sqft | DOM | Units | Dist |
|---|---|---|---|---|---|---|---|---|
| 2457 Haven St Port Charlotte, FL | 3.0 | 2.0 | 1150 | $1,775 | $1.54 | 21d | 1 | 0.46mi |
| 2586 Auburn Blvd Port Charlotte, FL | 2.0 | 2.0 | 1028 | $1,850 | $1.80 | 13d | 1 | 0.47mi |
| 17319 Terry Ave Port Charlotte, FL | 3.0 | 2.0 | 1478 | $2,095 | $1.42 | 21d | 1 | 0.56mi |
| 2223 Tinker St Port Charlotte, FL | 3.0 | 2.0 | 1337 | $2,400 | $1.80 | 21d | 1 | 0.64mi |
| 2113 Como St Port Charlotte, FL | 3.0 | 2.0 | 1162 | $1,500 | $1.29 | 21d | 1 | 0.81mi |
| 17230 Belmont Ave Port Charlotte, FL | 2.0 | 2.0 | 1052 | $1,375 | $1.31 | 21d | 1 | 0.92mi |
| 2022 Dorion St Port Charlotte, FL | 3.0 | 2.0 | 1200 | $1,695 | $1.41 | 13d | 1 | 0.99mi |
| 2233 Fraser St Unit 2235 Port Charlotte, FL | 3.0 | 2.0 | 1162 | $1,647 | $1.42 | 21d | 1 | 1.05mi |
| 17107 Thompson Ave Unit 17107 Port Charlotte, FL | 3.0 | 2.0 | 1190 | $1,900 | $1.60 | 21d | 1 | 1.06mi |
| 1261 Joplin Ave NW Port Charlotte, FL | 2.0 | 2.0 | 1200 | $1,950 | $1.62 | 21d | 1 | 1.09mi |
| 2084 Hilton St Port Charlotte, FL | 2.0 | 2.0 | 1052 | $1,395 | $1.33 | 13d | 1 | 1.16mi |
| 2023 Fraser St Port Charlotte, FL | 2.0 | 2.0 | 935 | $1,450 | $1.55 | 13d | 1 | 1.19mi |
| 1225 Armsdale Ave Port Charlotte, FL | 3.0 | 2.0 | 1140 | $1,525 | $1.34 | 21d | 1 | 1.19mi |
| 2046 Hilton St Port Charlotte, FL | 2.0 | 2.0 | 1052 | $1,375 | $1.31 | 21d | 1 | 1.19mi |
| 2021 Fraser St Port Charlotte, FL | 2.0 | 2.0 | 935 | $1,450 | $1.55 | 13d | 1 | 1.20mi |
| 1174 Victoria Ave Port Charlotte, FL | 2.0 | 2.0 | 1092 | $1,650 | $1.51 | 21d | 1 | 1.31mi |
| 2172 Peasley St Port Charlotte, FL | 3.0 | 2.0 | 1287 | $2,100 | $1.63 | 21d | 1 | 1.41mi |
Listing history 3 events
-
2026-05-19status Pending
-
2026-05-04$150,000 Active
-
1995-04-25soldstatus $45,500
ⓘ Source: listings_history table (triggers on properties + properties_extension) + one-shot
backfill from property_details.listing_events for pre-trigger history.
Tax reassessment forecast FL · Resets to sale price
- Current annual tax
- $943 · $79/mo
- Projected year-2 tax
- $1,245 · $104/mo
- Expected delta
- +$302/yr (+$25/mo · 32.1%)
ⓘ Screening estimate from a state-policy table — verify with the county assessor before closing.
Climate risk First Street
- Flood 8/10 Severe FEMA zone X (shaded) · 97% chance over 30 yrs
- Wildfire 1/10 Low
- Heat 10/10 Extreme 7 d/yr ≥107°F today · 28 d/yr by 30 yrs out
- Wind 10/10 Extreme 99% chance of damaging wind over 30 yrs
- Air quality 3/10 Moderate 2 unhealthy d/yr today · 3 by 30 yrs out
Nearby sold comps map
Loading sold comps map…
Walkable amenities ~0.75 mi
Loading nearby amenities…
Taxation est. · year 1
- Rental income
- $21,604
- − Mortgage interest
- −$8,402
- − Property taxes
- −$943
- − Insurance
- −$1,547
- − Repairs & maintenance
- −$1,728
- − Management
- −$1,728
- − Depreciation
- −$4,364
- Taxable income
- $2,891
- Est. tax owed @ 24.0%
- −$694
- After-tax cash flow
- $4,444/yr
For passive investors: Depreciation is non-cash, so a rental often shows a tax loss while cash-flowing — sheltering income. Rental losses are passive: they offset passive income freely, and up to $25,000/yr can offset ordinary (W-2) income if you actively participate and your MAGI is under $100k (phasing out to $0 by $150k); unused losses carry forward. On sale, claimed depreciation is recaptured at up to 25%, and gains may owe capital-gains tax (a 1031 exchange can defer both). Figures are a year-1 estimate at your 24.0% rate — not tax advice; consult a CPA.
Schools (NCES district)
- District
- Charlotte
- NCES district ID
- 1200240
- Math proficiency
- 54% ▼ -6.00%
- Reading proficiency
- 54% ▼ -1.00%
- Median HH income
- $44,864
- Composite
- 45.62/100
- National rank
- #2586
- State rank
- #22 of 73 in FL
Livability — Port Charlotte
- Score
- 65/100
- State rank
- #655
- US rank
- #13081
Category grades
Schools grade is shown separately in the Schools card above.
Census & demographics
- Census place
- Port Charlotte, FL
- County
- Charlotte County · 196,994 people
- City population
- 102,180
- Metro
- Punta Gorda, FL
- Population (ZIP)
- 18,696
- Household income
- $62,744
- Rent vs Own
- Severe rent burden
- 501.0
Population outlook (Charlotte County) Hauer SSP2
- Today (2025)
- 198,646 people
- By 2030
- 210,507 · +6.0%
- By 2040
- 230,857 · +16.2%
- By 2050
- 247,148 · +24.4%
- By 2075
- 281,777 · +41.8%
- By 2100
- 293,609 · +47.8%
Race, ethnicity, and origin ACS 2023
- Neighborhood character
- Predominantly White (79%)
- Race & ethnicity
- White 79% Two or more races 8% Black 7% Hispanic / Latino 7% Asian 2%
- Hispanic origin (detail)
- Mexican 2% Puerto Rican 1%
- Common ancestry
- Lithuanian 5% Romanian 4% Iranian 2%
- Foreign-born
- 11% · Canada
- Languages at home
- 88% English-only · Spanish 5% Russian/Polish/Slavic 2% Other Indo-European 1%
Political lean MEDSL · Charlotte
- 2024 margin
- Solid R (+34.0) · D 32.7% · R 66.7%
- 2008→2024 swing
- -26.7pp toward R · 2008: -7.2pp · 2024: -34.0pp
- All cycles
- 2024: R+34.0 2020: R+26.6 2016: R+27.8 2012: R+14.3 2008: R+7.2
Not yet ingested
- Civics
- —
Market trends
- HPI YoY
- ▼ -55.31%
- Current HPI
- 315.0548
- Rent YoY
- ▼ -1.63%
- Metro
- Punta Gorda, FL
- State GDP YoY
- ▲ 3.28%
- F500 in state
- 36
Industry mix (Fortune 500 HQ in FL)
| Industry | F500 HQs | Revenue |
|---|---|---|
| Industrial Technology | 2 | $29B |
|
||
| Insurance | 2 | $17B |
|
||
| Retail | 1 | $60B |
|
||
| Technology Distribution | 1 | $58B |
|
||
| Homebuilding | 1 | $35B |
|
||
| Technology Manufacturing | 1 | $35B |
|
||
Price history
+229.7% since first listed3 events — show timeline
- 2026-05-19 Pending — Stellar MLS as Distributed by MLS Grid
- 2026-05-04 Listed $150,000 Stellar MLS as Distributed by MLS Grid
- 1995-04-25 Sold (Public Records) $45,500 Public Records
Property tax history
+4.6%/yrLatest (2025): $943 · +2.3% YoY. Source: county tax records.
Cash-flow waterfall
monthlySold comps — $/sqft
last 12 mo · ≤1 miLoading sold comps…