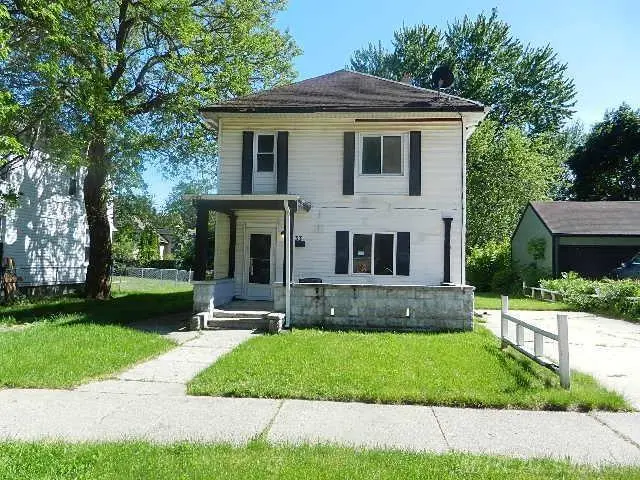
33 Parkview Ave · Mount Clemens, MI
Flood risk 1/10 · Minimal
- FEMA flood zone
- X (unshaded)
- Chance of flooding over 30 yrs
- 0.0%
- Est. flood insurance / yr
- $473 – $860
Fire risk 1/10 · Minimal
- Est. fire insurance / yr
- $784 – $1,456
Heat risk 3/10 · Minor
- Hot days now (above 96°F)
- 7 days/yr
- Hot days in 30 yrs
- 15 days/yr
Wind risk 1/10 · Minimal
- Chance of severe wind over 30 yrs
- —
Air-quality risk 4/10 · Minor
- Unhealthy air days now
- 4 days/yr
- Unhealthy air days in 30 yrs
- 6 days/yr
Risk factors via First Street. Map © Google.
Why this score? — see what drove the B- grade
The composite is a weighted blend of 9 inputs, each scored 0–100. Each bar is that input's sub-score; the figure is the points it added to the 100-point composite (weight × sub-score).
- Cash flow +30.0/30.0
- 1% rule +10.0/10.0
- DSCR +10.0/10.0
- ARV discount +7.5/15.0
- Rent growth +5.0/5.0
- Livability +3.9/5.0
- Condition / age +2.5/5.0
- Schools +0.6/10.0
- Appreciation +0.0/10.0
$83,700
🖨 Deal sheet 📄 Offer letter ✓ Due diligence
Listing remarks MLS
Investor Special or DIY Dream! This clean slate property offers outstanding potential in a prime location, just blocks from vibrant downtown Mt. Clemens, where you’ll find restaurants, bars, and shopping all within walking distance. Featuring 4 bedrooms, 2 baths, and 1,720 sq. ft. , this classic single-family home has separate meters in place for an easy multi family co-habitation. It needs a full rehab, making it ideal for investors or skilled renovators ready to bring their vision to life—whether as a beautifully restored residence or an income-producing rental. Recent city improvements include new water and sewer pipes installed in 2025, providing peace of mind and boosting long-term value. Highlights: • Prime location near downtown and riverfront (revitalization in progress) • Updated city infrastructure throughout downtown (2025) • Flexible layout would make great potential for shared living space• Strong potential for resale or rental income Bring your tools and creativity—this one’s ready for transformation!
Key facts
- Flexible layout
- Prime location
- Separate meters
Tags
Property features AI
Finance
- HOA & community: Homeowners association present
Exterior
- Parking: On-street parking; Assigned parking
- Utilities: Public water; Public sewer
- Home design: Single-family residence; Two-story
- Construction: Vinyl siding; Stone foundation
- Exterior features: Front porch; City lot; Paved public road access; Lot approximately 61 x 120 (0.12 acre); Residential zoning
Interior
- Kitchen: Gas water heater
- Bedrooms: Total of 7 rooms (bedroom count not specified)
- Bathrooms: 2 full bathrooms
- Heating & cooling: Hot water heating; Natural gas heating; Radiant heating; Steam heating; No central cooling
- Interior features: Entrance foyer; Basement
Neighborhood map
What this means for you Summary
Snapshot
- This is a 3-bed/2.0-bath single-family listed at $84k.
Deal economics
- At list price, monthly cash flow is $741 ($9k/yr) — positive.
- The deal already cash-flows at list — no discount required.
- Meets the 1% rule at list price ($2k rent vs $84k).
- Recommended offer: $79k (6.0% below list) — sets the bar for market timing.
- Cap rate 16.9% vs local median 3.5% in Mount Clemens — top-decile yield for the area; either an underpriced asset or a hidden risk that comps aren't pricing in. Stress-test before assuming the spread holds.
Location & tenants
- Location reads 77/100 on livability (#120 in MI, #2,918 nationally) — a middle-class / working-renter tenant base. Strengths: commute A+, cost of living A+, housing A+; Watch: schools D+, crime D+, amenities D+.
- Mount Clemens Community School District (suburban): math 4% / reading 11% proficiency, ranked #532 of 540 in MI (top 98%) — low school quality limits family demand, transient renter base, plan for 1-2y turnover; 80% free/reduced lunch — lower-income household profile, screen leases tightly.
- Market conditions: Rents rising fast (+10.8%/yr); 66 active listings in the ZIP; 6 comparable units currently listed for rent nearby; rentals leasing fast (median 2d on market — plan ~1-2 weeks tenant-placement turnaround); 1,321 units permitted in Macomb County in 2024 (86 in 5+ unit buildings).
- This rent runs 38% of the median local income ($52k/yr) — at the standard rent-burdened threshold; future hikes will face affordability resistance.
Forward outlook
- Local home prices are declining (-3.0%/yr); year-one equity from $579 of loan paydown is wiped out by about $3k of value loss. Plan a longer hold.
- Macomb County population projected at +9% by 2050 — modest demand growth; plan on rents tracking national, not racing it.
- At projected returns (-3.0% appreciation + 8.0% rent growth), your $23k cash investment doubles in ~3 years — after that, you're playing with house money.
Negotiation context
- It's been on market 70 days — a 6% lower offer ($79k) is reasonable based on typical stale-listing flexibility.
- 10 sale attempts since 17y ago; this cycle's ask has dropped $14k (15%) from the opening price — seller is motivated, your offer sets the floor, not the list.
- Current owner paid $70k; 20% above their basis — modest negotiation headroom, anchor on the comps not their cost.
Risks & watch-outs
- Watch-outs: built in 1910 — expect roof / HVAC / electrical / plumbing capex.
Questions for the listing agent
- It's been on market 70 days. Have you received any prior offers? Is the seller open to a 6% concession, seller financing, or rate buy-down credit?
- Built in 1910 — when were the roof, HVAC, electrical panel, plumbing, and water heater last replaced?
- Why hasn't it sold? Are there any deal-killer items the seller is aware of (foundation, flood, title, zoning, code violations)?
- Is there a deadline driving the sale (1031 exchange, divorce, estate, relocation)? That informs how much negotiation room exists.
- Schools are D-rated, which usually means shorter tenancies and higher turnover. Who's the typical renter profile here, and what's been the actual vacancy rate?
- Crime grade is D in this area — have there been break-ins, vandalism, or insurance claims at this property in the last 3 years? What carrier currently insures it and at what premium?
- What's the average days-on-market for RENTAL listings here right now (not sales)? A rising rental-DOM trend means longer vacancies and softer asking-rent achievability than the comps imply.
- What's the recent tenant-quality profile in this submarket — average credit score on applications, eviction rate, late-payment / NSF rate, and stable-employment percentage? A property-management company in the area should have these aggregated.
- How much new for-sale + rental construction is in the pipeline within 1–3 miles? Heavy new supply typically softens prices + rents 12–24 months out; constrained supply supports both.
Investment metrics
- 1% rule
- 2.00% ✓
- Cap rate
- 16.92%
- Cash-on-cash
- 37.95%
- DSCR
- 2.69
- GRM
- 4.2
CMA / ARV
- ARV (on-the-fly)
- $209,840
- Comps found
- 12
Show comp detail 12 sales within ~0.75 mi
| Address | Dist | Beds/Ba | Sqft | Sold | Price | $/sf | Match |
|---|---|---|---|---|---|---|---|
| 130 Gallup St | 0.03mi | 4/1.5 (+1) | 1,728 (+0%) | 5mo | $90,000 | $52 | 87 |
| 165 Washington St | 0.23mi | 3/2.0 | 1,732 (+1%) | 2mo | $212,000 | $122 | 86 |
| 111 Scott Blvd | 0.22mi | 4/2.0 (+1) | 1,612 (-6%) | 1mo | $265,000 | $164 | 74 |
| 40 Moser Pl | 0.30mi | 4/2.0 (+1) | 1,593 (-7%) | 1mo | $200,000 | $126 | 68 |
| 43529 Medea Drive Dr | 0.67mi | 3/2.0 | 1,728 (+0%) | 5mo | $30,000 | $17 | 63 |
| 33 Ferrin Pl | 0.28mi | 3/1.0 | 1,525 (-11%) | 2mo | $125,000 | $82 | 62 |
| 59 Canfield Dr | 0.57mi | 3/2.0 | 1,826 (+6%) | 2mo | $245,000 | $134 | 62 |
| 95 High St | 0.32mi | 3/2.0 | 1,906 (+11%) | 7mo | $260,000 | $136 | 61 |
| 24 Eldredge St | 0.59mi | 3/2.0 | 1,800 (+5%) | 8mo | $120,000 | $67 | 58 |
| 193 Euclid St | 0.47mi | 2/1.5 (-1) | 1,557 (-10%) | 7mo | $181,000 | $116 | 49 |
| 225 Euclid St | 0.39mi | 4/2.5 (+1) | 1,949 (+13%) | 8mo | $285,000 | $146 | 46 |
| 220 Cass Ave | 0.63mi | 3/1.0 | 1,462 (-15%) | 0mo | $165,000 | $113 | 41 |
Match score weights: distance 35% · size 25% · config 20% · recency 20%. Top-matched comps best support the ARV.
Projected returns pro-forma
-3.0% appreciation · 8.0% rent growth · sell at horizon
- IRR
- 39.6%
- Equity multiple
- 2.81×
- Total profit
- $42,499
- Equity at exit
- $12,480
- IRR
- 48.3%
- Equity multiple
- 6.89×
- Total profit
- $138,077
- Equity at exit
- $7,237
Cash invested: $23,436 (down + closing). Projections, not guarantees.
Landlord ↔ Tenant lean methodology
- Overall (STATE)
- 62 Landlord-Friendly
- State Michigan
- 62 Landlord-Friendly · EVEN
- County
- — inherits STATE
- City
- — inherits STATE
ZIP-level market 48043
- Rents YoY
- 10.8%
- Active inventory
- 66
- Price-to-rent
- 4.2×
Monthly cashflow live
- Estimated rent
- $1,670 high interval (Pro) →
- Mortgage (P&I)
- −$439
- Tax est. 1.5%
- −$105 /mo · $1,256/yr
- Insurance
- −$35
- HOA
- −$0
- Vacancy / Maint / Mgmt
- −$351
- Net cashflow
- $741
Break-even live
UW: 25.0% down · 7.5% · 30yr · 1.5% tax · 5.0% vac · 8.0% maint · 8.0% mgmt
Financing live
Cash to close
- Down payment
- $20,925
- Closing costs
- $2,511
- Reserves months
- —
- Total cash needed
- —
Loan-product check · same deal, 3 products live
Conventional
25% down · 7.5% · 30yr
- Down + closing
- —
- Monthly P&I
- —
- Monthly cashflow
- —
- DSCR
- —
- Eligible?
- —
Personal DTI + credit; lowest rate.
DSCR
20% down · 8.5% · 30yr
- Down + closing
- —
- Monthly P&I
- —
- Monthly cashflow
- —
- DSCR
- —
- Eligible?
- —
No personal income docs; deal must DSCR.
Hard money
10% down · 12.0% · 12mo
- Down + closing
- —
- Monthly P&I
- —
- Monthly cashflow
- —
- DSCR
- —
- Eligible?
- —
Short-term bridge; refi at stabilization.
Rent comps 6 comps
| Address | Beds | Baths | Sqft | Rent | $/sqft | DOM | Units | Dist |
|---|---|---|---|---|---|---|---|---|
| 40 Ferrin Pl Mount Clemens, MI | 3.0 | 1.0 | 1400 | $1,700 | $1.21 | 1d | 1 | 0.28mi |
| 121 Jones St Unit 1 Mt Clemens, MI | 2.0 | 1.0 | 1080 | $1,400 | $1.30 | 1d | 1 | 0.43mi |
| 121 Jones St Unit 2 Mt Clemens, MI | 2.0 | 1.0 | 1050 | $1,600 | $1.52 | 2d | 1 | 0.43mi |
| 15 Washington St Unit 2 Mt Clemens, MI | 3.0 | 1.0 | 1396 | $1,400 | $1.00 | 43d | 1 | 0.59mi |
| 35 S Groesbeck Hwy Mt Clemens, MI | 1.0–2.0 | 1.0–1.5 | 1125 | $2,050 | $1.82 | 1d | 1 | 1.10mi |
| 42510 Pinehurst Dr Clinton Twp, MI | 3.0 | 2.5 | 1845 | $2,600 | $1.41 | 4d | 1 | 1.14mi |
Listing history 43 events
-
2026-06-18days on market $83,700 Active 70 DOM
-
2026-06-17days on market $83,700 Active 69 DOM
-
2026-06-16days on market $83,700 Active 68 DOM
-
2026-06-15days on market $83,700 Active 67 DOM
-
2026-06-13days on market $83,700 Active 65 DOM
-
2026-06-13days on market $83,700 Active 64 DOM
-
2026-06-09days on market $83,700 Active 61 DOM
-
2026-06-08days on market $83,700 Active 60 DOM
-
2026-06-07days on market $83,700 Active 59 DOM
-
2026-06-04days on market $83,700 Active 56 DOM
-
2026-06-03days on market $83,700 Active 55 DOM
-
2026-06-02days on market $83,700 Active 54 DOM
-
2026-06-01days on market $83,700 Active 53 DOM
-
2026-06-01pricestatus $83,700 Active 52 DOM
-
2026-05-31days on market $87,900 Active Under Contract 52 DOM
-
2026-05-01historical Active Under Contract
Show marketing remark (1074 chars)
Investor Special or DIY Dream! This clean slate property offers outstanding potential in a prime location, just blocks from vibrant downtown Mt. Clemens, where you’ll find restaurants, bars, and shopping all within walking distance. Featuring 4 bedrooms, 2 baths, and 1,720 sq. ft. , this classic single-family home has separate meters in place for an easy multi family co-habitation. It needs a full rehab, making it ideal for investors or skilled renovators ready to bring their vision to life—whether as a beautifully restored residence or an income-producing rental. Recent city improvements include new water and sewer pipes installed in 2025, providing peace of mind and boosting long-term value. Highlights: • Prime location near downtown and riverfront (revitalization in progress) • Updated city infrastructure throughout downtown (2025) • Flexible layout would make great potential for shared living space• Strong potential for resale or rental income Bring your tools and creativity—this one’s ready for transformation!
-
2026-05-01historical Accepting Backup Offers 1074-char remark
Show marketing remark (1074 chars)
Investor Special or DIY Dream! This clean slate property offers outstanding potential in a prime location, just blocks from vibrant downtown Mt. Clemens, where you’ll find restaurants, bars, and shopping all within walking distance. Featuring 4 bedrooms, 2 baths, and 1,720 sq. ft. , this classic single-family home has separate meters in place for an easy multi family co-habitation. It needs a full rehab, making it ideal for investors or skilled renovators ready to bring their vision to life—whether as a beautifully restored residence or an income-producing rental. Recent city improvements include new water and sewer pipes installed in 2025, providing peace of mind and boosting long-term value. Highlights: • Prime location near downtown and riverfront (revitalization in progress) • Updated city infrastructure throughout downtown (2025) • Flexible layout would make great potential for shared living space• Strong potential for resale or rental income Bring your tools and creativity—this one’s ready for transformation!
-
2026-04-21price $87,900 1074-char remark
Show marketing remark (1074 chars)
Investor Special or DIY Dream! This clean slate property offers outstanding potential in a prime location, just blocks from vibrant downtown Mt. Clemens, where you’ll find restaurants, bars, and shopping all within walking distance. Featuring 4 bedrooms, 2 baths, and 1,720 sq. ft. , this classic single-family home has separate meters in place for an easy multi family co-habitation. It needs a full rehab, making it ideal for investors or skilled renovators ready to bring their vision to life—whether as a beautifully restored residence or an income-producing rental. Recent city improvements include new water and sewer pipes installed in 2025, providing peace of mind and boosting long-term value. Highlights: • Prime location near downtown and riverfront (revitalization in progress) • Updated city infrastructure throughout downtown (2025) • Flexible layout would make great potential for shared living space• Strong potential for resale or rental income Bring your tools and creativity—this one’s ready for transformation!
-
2026-04-20price $87,900
-
2026-04-09$97,900 Active
Show marketing remark (1074 chars)
Investor Special or DIY Dream! This clean slate property offers outstanding potential in a prime location, just blocks from vibrant downtown Mt. Clemens, where you’ll find restaurants, bars, and shopping all within walking distance. Featuring 4 bedrooms, 2 baths, and 1,720 sq. ft. , this classic single-family home has separate meters in place for an easy multi family co-habitation. It needs a full rehab, making it ideal for investors or skilled renovators ready to bring their vision to life—whether as a beautifully restored residence or an income-producing rental. Recent city improvements include new water and sewer pipes installed in 2025, providing peace of mind and boosting long-term value. Highlights: • Prime location near downtown and riverfront (revitalization in progress) • Updated city infrastructure throughout downtown (2025) • Flexible layout would make great potential for shared living space• Strong potential for resale or rental income Bring your tools and creativity—this one’s ready for transformation!
-
2026-04-09$97,900 Active 1074-char remark
Show marketing remark (1074 chars)
Investor Special or DIY Dream! This clean slate property offers outstanding potential in a prime location, just blocks from vibrant downtown Mt. Clemens, where you’ll find restaurants, bars, and shopping all within walking distance. Featuring 4 bedrooms, 2 baths, and 1,720 sq. ft. , this classic single-family home has separate meters in place for an easy multi family co-habitation. It needs a full rehab, making it ideal for investors or skilled renovators ready to bring their vision to life—whether as a beautifully restored residence or an income-producing rental. Recent city improvements include new water and sewer pipes installed in 2025, providing peace of mind and boosting long-term value. Highlights: • Prime location near downtown and riverfront (revitalization in progress) • Updated city infrastructure throughout downtown (2025) • Flexible layout would make great potential for shared living space• Strong potential for resale or rental income Bring your tools and creativity—this one’s ready for transformation!
-
2025-11-09status Pending
-
2025-11-09status Pending
-
2025-11-08historical
-
2025-11-06price $98,700
-
2025-11-05price $98,700
-
2025-11-03status Active
-
2025-11-03status Back on Market
-
2025-11-02historical Active Under Contract
-
2025-11-02historical Accepting Backup Offers
-
2025-10-15price $104,900
-
2025-10-14price $104,900
-
2025-10-04$109,900 Active
-
2025-10-04$109,900 Active
-
2019-12-06soldstatus $70,000 Closed
-
2019-12-06soldstatus $70,000
-
2019-11-26status Pending
-
2019-10-31$80,000 Active
-
2019-10-31$80,000
-
2011-06-25historical
-
2011-03-24$35,600
-
2010-07-08historical
-
2009-07-07$75,000
ⓘ Source: listings_history table (triggers on properties + properties_extension) + one-shot
backfill from property_details.listing_events for pre-trigger history.
Climate risk First Street
- Flood 1/10 Low FEMA zone X (unshaded) · 0% chance over 30 yrs
- Wildfire 1/10 Low
- Heat 3/10 Moderate 7 d/yr ≥96°F today · 15 d/yr by 30 yrs out
- Wind 1/10 Low
- Air quality 4/10 Moderate 4 unhealthy d/yr today · 6 by 30 yrs out
Nearby sold comps map
Loading sold comps map…
Walkable amenities ~0.75 mi
Loading nearby amenities…
Taxation est. · year 1
- Rental income
- $20,045
- − Mortgage interest
- −$4,689
- − Property taxes
- −$1,256
- − Insurance
- −$418
- − Repairs & maintenance
- −$1,604
- − Management
- −$1,604
- − Depreciation
- −$2,435
- Taxable income
- $8,041
- Est. tax owed @ 24.0%
- −$1,930
- After-tax cash flow
- $6,965/yr
For passive investors: Depreciation is non-cash, so a rental often shows a tax loss while cash-flowing — sheltering income. Rental losses are passive: they offset passive income freely, and up to $25,000/yr can offset ordinary (W-2) income if you actively participate and your MAGI is under $100k (phasing out to $0 by $150k); unused losses carry forward. On sale, claimed depreciation is recaptured at up to 25%, and gains may owe capital-gains tax (a 1031 exchange can defer both). Figures are a year-1 estimate at your 24.0% rate — not tax advice; consult a CPA.
Schools (NCES district)
- District
- Mount Clemens Community School District
- NCES district ID
- 2624690
- Math proficiency
- 4% ▼ -9.00%
- Reading proficiency
- 11% ▼ -7.00%
- Median HH income
- $36,632
- Composite
- 6.25/100
- National rank
- #10005
- State rank
- #532 of 540 in MI
Livability — Mount Clemens
- Score
- 77/100
- State rank
- #120
- US rank
- #2918
Category grades
Schools grade is shown separately in the Schools card above.
Census & demographics
- Census place
- Mount Clemens, MI
- County
- Macomb County · 638,552 people
- City population
- 15,429
- Metro
- Detroit-Warren-Dearborn, MI
- Population (ZIP)
- 15,429
- Household income
- $52,161
- Rent vs Own
- Severe rent burden
- 610.0
Population outlook (Macomb County) Hauer SSP2
- Today (2025)
- 925,296 people
- By 2030
- 948,226 · +2.5%
- By 2040
- 983,961 · +6.3%
- By 2050
- 1,010,200 · +9.2%
- By 2075
- 1,076,222 · +16.3%
- By 2100
- 1,077,065 · +16.4%
Race, ethnicity, and origin ACS 2023
- Neighborhood character
- Majority White (65%)
- Race & ethnicity
- White 65% Black 22% Two or more races 10% Hispanic / Latino 4%
- Common ancestry
- Romanian 10% Lithuanian 4% Slovak 2%
- Foreign-born
- 2% · Canada
- Languages at home
- 96% English-only · Spanish 2% Russian/Polish/Slavic 1%
Political lean MEDSL · Macomb
- 2024 margin
- R (+13.7) · D 42.2% · R 55.9% · Other 1.9%
- 2008→2024 swing
- -22.3pp toward R · 2008: 8.6pp · 2024: -13.7pp
- All cycles
- 2024: R+13.7 2020: R+8.1 2016: R+11.6 2012: D+4.0 2008: D+8.6
Not yet ingested
- Civics
- —
Market trends
- HPI YoY
- ▼ -194.74%
- Current HPI
- 260.7139
- Rent YoY
- ▲ 10.82%
- Metro
- Detroit-Warren-Dearborn, MI
- State GDP YoY
- ▲ 1.37%
- F500 in state
- 28
Industry mix (Fortune 500 HQ in MI)
| Industry | F500 HQs | Revenue |
|---|---|---|
| Automotive Parts | 3 | $48B |
|
||
| Automotive | 2 | $372B |
|
||
| Chemicals | 1 | $45B |
|
||
| Automotive Retail | 1 | $29B |
|
||
| Healthcare / Medical Devices | 1 | $23B |
|
||
| Automotive Technology | 1 | $20B |
|
||
Price history
+17.2% since first listed28 events — show timeline
- 2026-05-01 Contingent — REALCOMP
- 2026-05-01 Contingent — MiRealSource-MiMLS
- 2026-04-21 Price Changed $87,900 MiRealSource-MiMLS
- 2026-04-20 Price Changed $87,900 REALCOMP
- 2026-04-09 Listed $97,900 REALCOMP
- 2026-04-09 Listed $97,900 MiRealSource-MiMLS
- 2025-11-09 Pending — REALCOMP
- 2025-11-09 Pending — MiRealSource-MiMLS
- 2025-11-08 Listing Removed — MiRealSource-MiMLS
- 2025-11-06 Price Changed $98,700 MiRealSource-MiMLS
- 2025-11-05 Price Changed $98,700 REALCOMP
- 2025-11-03 Relisted — REALCOMP
- 2025-11-03 Relisted — MiRealSource-MiMLS
- 2025-11-02 Contingent — REALCOMP
- 2025-11-02 Contingent — MiRealSource-MiMLS
- 2025-10-15 Price Changed $104,900 MiRealSource-MiMLS
- 2025-10-14 Price Changed $104,900 REALCOMP
- 2025-10-04 Listed $109,900 MiRealSource-MiMLS
- 2025-10-04 Listed $109,900 REALCOMP
- 2019-12-06 Sold (MLS) $70,000 REALCOMP
- 2019-12-06 Sold (MLS) $70,000 MiRealSource-MiMLS
- 2019-11-26 Pending — MiRealSource-MiMLS
- 2019-10-31 Listed $80,000 REALCOMP
- 2019-10-31 Listed $80,000 MiRealSource-MiMLS
- 2011-06-25 Listing Removed — MiRealSource-MiMLS
- 2011-03-24 Listed $35,600 MiRealSource-MiMLS
- 2010-07-08 Listing Removed — MiRealSource-MiMLS
- 2009-07-07 Listed $75,000 MiRealSource-MiMLS
Property tax history
+7.2%/yrLatest (2025): $4,874 · +2.8% YoY. Source: county tax records.
Cash-flow waterfall
monthlySold comps — $/sqft
last 12 mo · ≤1 miLoading sold comps…