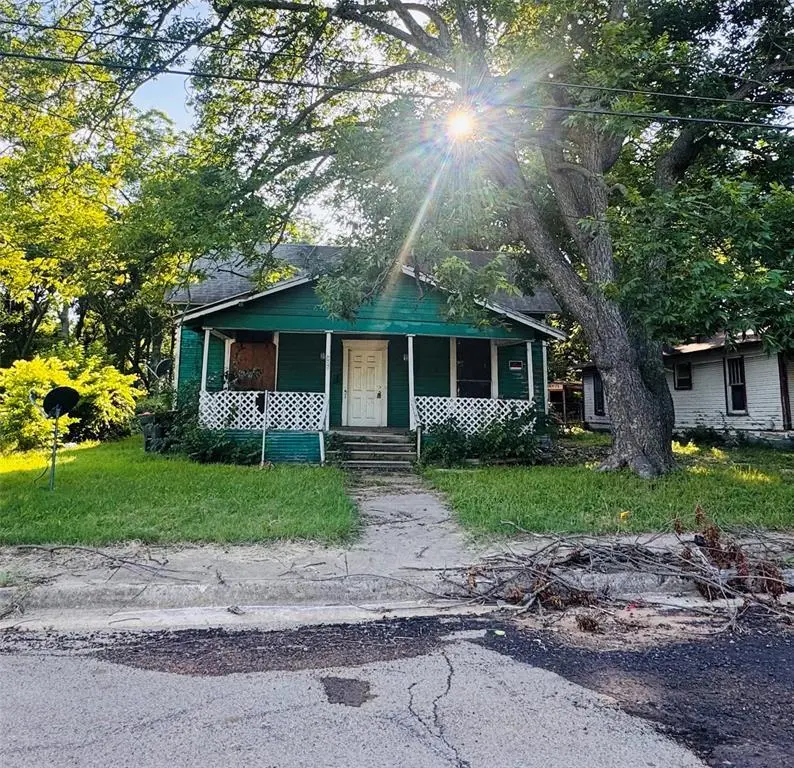
125 NE 11th St · Paris, TX
Flood risk 1/10 · Minimal
- FEMA flood zone
- X (unshaded)
- Chance of flooding over 30 yrs
- 0.0%
- Est. flood insurance / yr
- $507 – $1,088
Fire risk 6/10 · Moderate
- Est. fire insurance / yr
- $1,222 – $2,270
Heat risk 7/10 · Major
- Hot days now (above 110°F)
- 7 days/yr
- Hot days in 30 yrs
- 22 days/yr
Wind risk 4/10 · Minor
- Chance of severe wind over 30 yrs
- 20.0%
Air-quality risk 2/10 · Minimal
- Unhealthy air days now
- 0 days/yr
- Unhealthy air days in 30 yrs
- 1 days/yr
Risk factors via First Street. Map © Google.
Why this score? — see what drove the B- grade
The composite is a weighted blend of 9 inputs, each scored 0–100. Each bar is that input's sub-score; the figure is the points it added to the 100-point composite (weight × sub-score).
- Cash flow +30.0/30.0
- 1% rule +10.0/10.0
- DSCR +10.0/10.0
- ARV discount +7.5/15.0
- Livability +3.1/5.0
- Schools +3.0/10.0
- Rent growth +2.5/5.0
- Condition / age +2.5/5.0
- Appreciation +0.0/10.0
$40,000
🖨 Deal sheet (PDF) 📄 Offer letter ✓ Due diligence
Listing remarks
Looking for your next project? Ideal for investors, flippers, or buyers looping for a renovation project. Endless possibilities for transformation. This property is packed with potential and ready for someone to bring it back to life! 1,406 square feet, 10 foot ceilings throughout the entire house. Including two bedrooms, two bathrooms, formal dining and living area with a huge backyard. This property has tons of potential to add value. Great opportunity to renovate, customize and build equity. Plenty of space to reimagine and make your own. Property is being sold AS-IS and will require significant TLC.
Key facts
- Huge backyard
- 8,276 sq ft lot
- Built 1960
Tags
Property features AI
Finance
- Other: Property type: Single Family Residence; Subdivision: City of Paris; Lot is less than 0.5 acre (approx. 0.19 acre)
- Financial info: Listing terms: Cash; No second mortgage reported
- HOA & community: No homeowners association
Exterior
- Parking: Driveway and gravel parking; no garage or covered/carport spaces
- Utilities: City water with individual water meter; City sewer; Electricity available; Cable available
- Home design: Single-family residence; One story; Residential property; No known restrictions
- Construction: Built in 1960; Wood construction; Shingle roof; Pillar/post/pier foundation
- Exterior features: Covered front porch; Large backyard with grass; Concrete, curbs, and sidewalk on property
Interior
- Kitchen: Room for freezer; Kitchen on main level (15 x 11)
- Bedrooms: Two bedrooms on the main level (Primary: 14 x 12; Second primary-style bedroom: 13 x 15)
- Flooring: Wood flooring
- Bathrooms: Two full bathrooms; Features include jetted tub, separate shower, separate vanities, and linen closet
- Interior features: Cable TV available; One living area, one dining area; Total of 8 rooms
- Laundry & utility: Utility room on main level (15 x 14)
Neighborhood map
What this means for you Summary
Snapshot
- This is a 2-bed/1.0-bath single-family listed at $40k.
Deal economics
- At list price, monthly cash flow is $649 ($8k/yr) — positive.
- The deal already cash-flows at list — no discount required.
- Meets the 1% rule at list price ($1k rent vs $40k).
- Recommended offer: $39k (1.5% below list) — sets the bar for market timing.
- Cap rate 25.8% vs local median 3.7% in Paris — top-decile yield for the area; either an underpriced asset or a hidden risk that comps aren't pricing in. Stress-test before assuming the spread holds.
Location & tenants
- Location reads 61/100 on livability (#984 in TX) — a middle-class / working-renter tenant base. Strengths: cost of living A+, housing A+; Watch: crime F, amenities F, commute F.
- Paris ISD (town): math 36% / reading 37% proficiency, ranked #521 of 826 in TX (top 63%) — families likely to look elsewhere, expect single-tenant / working-renter base with shorter leases; 70% free/reduced lunch — lower-income household profile, screen leases tightly.
- Zoned schools: Aikin El (math 32% / reading 35%, grade F, #2,174 of 4,322 statewide, top 51%, 937 students, 74% FRL); Crockett Int (math 33% / reading 33%, grade F, #930 of 1,662 statewide, top 57%, 560 students, 79% FRL); Paris H S (math 60% / reading 51%, grade C, #364 of 1,632 statewide, top 23%, 934 students, 71% FRL) — zoned schools at 75% FRL track the district average.
- Market conditions: 275 active listings in the ZIP; 5 comparable units currently listed for rent nearby; rentals lingering (median 45d on market — plan ~5-8 weeks vacancy on turnover, expect pricing pressure); 100% of comp listings sitting > 30 days — soft ceiling on asking rent; 119 units permitted in Lamar County in 2024 (71 in 5+ unit buildings).
- This rent runs 31% of the median local income ($46k/yr) — at the standard rent-burdened threshold; future hikes will face affordability resistance.
Forward outlook
- Local home prices are declining (-3.0%/yr); year-one equity from $277 of loan paydown is wiped out by about $1k of value loss. Plan a longer hold.
- Lamar County population projected at -13% by 2050 — secular population decline; favor cash flow + early exit over multi-decade hold.
- At projected returns (-3.0% appreciation + 3.0% rent growth), your $11k cash investment doubles in ~2 years — after that, you're playing with house money.
Negotiation context
- It's been on market 20 days — a 2% lower offer ($39k) is reasonable based on typical stale-listing flexibility.
Risks & watch-outs
- Watch-outs: property tax is 2.5% of price.
- Climate carrying-cost: major wildfire risk; extreme-heat days projected 7→22/yr by 2055 (HVAC capex compounding) — expect insurance premiums to compound above CPI over the hold.
Questions for the listing agent
- Built in 1960 — when were the roof, HVAC, electrical panel, plumbing, and water heater last replaced?
- Property tax is high relative to price — has the assessment been appealed recently, and will the sale trigger a re-assessment?
- Is there a deadline driving the sale (1031 exchange, divorce, estate, relocation)? That informs how much negotiation room exists.
- Schools are D-rated, which usually means shorter tenancies and higher turnover. Who's the typical renter profile here, and what's been the actual vacancy rate?
- Crime grade is F in this area — have there been break-ins, vandalism, or insurance claims at this property in the last 3 years? What carrier currently insures it and at what premium?
- What's the average days-on-market for RENTAL listings here right now (not sales)? A rising rental-DOM trend means longer vacancies and softer asking-rent achievability than the comps imply.
- What's the recent tenant-quality profile in this submarket — average credit score on applications, eviction rate, late-payment / NSF rate, and stable-employment percentage? A property-management company in the area should have these aggregated.
- How much new for-sale + rental construction is in the pipeline within 1–3 miles? Heavy new supply typically softens prices + rents 12–24 months out; constrained supply supports both.
Investment metrics
- 1% rule
- 3.04% ✓
- Cap rate
- 25.76%
- Cash-on-cash
- 69.53%
- DSCR
- 4.09
- GRM
- 2.7
CMA / ARV
- ARV (on-the-fly)
- $126,720
- Comps found
- 12
Show comp detail 12 sales within ~0.75 mi
| Address | Dist | Beds/Ba | Sqft | Sold | Price | $/sf | Match |
|---|---|---|---|---|---|---|---|
| 1347 E Houston St | 0.19mi | 2/2.0 | 1,542 (+10%) | 2mo | $79,000 | $51 | 70 |
| 718 12th St SE | 0.51mi | 3/1.0 (+1) | 1,440 (+2%) | 3mo | $65,000 | $45 | 65 |
| 2131 Hubbard St | 0.69mi | 2/1.0 | 1,369 (-3%) | 4mo | $95,000 | $69 | 60 |
| 230 NE 20th | 0.55mi | 2/1.0 | 1,328 (-6%) | 8mo | $119,500 | $90 | 59 |
| 506 E Price St | 0.40mi | 3/2.0 (+1) | 1,349 (-4%) | 9mo | $205,000 | $152 | 58 |
| 910 Van Zandt St | 0.60mi | 3/2.0 (+1) | 1,352 (-4%) | 0mo | $174,500 | $129 | 56 |
| 380 3rd St NE | 0.53mi | 3/1.0 (+1) | 1,305 (-7%) | 2mo | $28,000 | $21 | 56 |
| 138 SE 20th St | 0.56mi | 2/1.0 | 1,328 (-6%) | 13mo | $160,000 | $120 | 54 |
| 1745 E Cherry | 0.43mi | 3/2.0 (+1) | 1,569 (+11%) | 2mo | $195,000 | $124 | 50 |
| 435 2nd St NE | 0.61mi | 3/1.0 (+1) | 1,300 (-8%) | 10mo | $50,000 | $38 | 46 |
| 740 10th St SE | 0.55mi | 1/1.0 (-1) | 1,200 (-15%) | 5mo | $114,000 | $95 | 41 |
| 641 E Washington St | 0.61mi | 1/1.0 (-1) | 1,200 (-15%) | 6mo | $79,900 | $67 | 37 |
Match score weights: distance 35% · size 25% · config 20% · recency 20%. Top-matched comps best support the ARV.
Projected returns pro-forma
-3.0% appreciation · 3.0% rent growth · sell at horizon
- IRR
- 69.1%
- Equity multiple
- 4.12×
- Total profit
- $34,888
- Equity at exit
- $5,964
- IRR
- 73.1%
- Equity multiple
- 8.48×
- Total profit
- $83,760
- Equity at exit
- $3,458
Cash invested: $11,200 (down + closing). Projections, not guarantees.
Landlord ↔ Tenant lean methodology
- Overall (STATE)
- 87 Strongly Landlord-Friendly
- State Texas
- 87 Strongly Landlord-Friendly · R+5
- County
- — inherits STATE
- City
- — inherits STATE
ZIP-level market 75460
- Active inventory
- 275
- Price-to-rent
- 2.7×
Monthly cashflow live
- Estimated rent
- $1,215 high interval (Pro) →
- Mortgage (P&I)
- −$210
- Tax from tax record
- −$85 /mo · $1,014/yr
- Insurance
- −$17
- HOA
- −$0
- Vacancy / Maint / Mgmt
- −$255
- Net cashflow
- $649
Break-even live
Sensitivity live
| Price | -10% $672 | -5% $660 | +0% $649 | +5% $638 | +10% $626 |
|---|---|---|---|---|---|
| Rent | -10% $553 | -5% $601 | +0% $649 | +5% $697 | +10% $745 |
| Rate | -1.0pp $669 | -0.5pp $659 | base $649 | +0.5pp $639 | +1.0pp $628 |
UW: 25.0% down · 7.5% · 30yr · 1.5% tax · 5.0% vac · 8.0% maint · 8.0% mgmt
Financing live
Cash to close
- Down payment
- $10,000
- Closing costs
- $1,200
- Reserves months
- —
- Total cash needed
- —
Loan-product check · same deal, 3 products live
Conventional
25% down · 7.5% · 30yr
- Down + closing
- —
- Monthly P&I
- —
- Monthly cashflow
- —
- DSCR
- —
- Eligible?
- —
Personal DTI + credit; lowest rate.
DSCR
20% down · 8.5% · 30yr
- Down + closing
- —
- Monthly P&I
- —
- Monthly cashflow
- —
- DSCR
- —
- Eligible?
- —
No personal income docs; deal must DSCR.
Hard money
10% down · 12.0% · 12mo
- Down + closing
- —
- Monthly P&I
- —
- Monthly cashflow
- —
- DSCR
- —
- Eligible?
- —
Short-term bridge; refi at stabilization.
Rent comps 5 comps
| Address | Beds | Baths | Sqft | Rent | $/sqft | DOM | Units | Dist |
|---|---|---|---|---|---|---|---|---|
| 649 E Price St Paris, TX | 2.0 | 1.0 | 900 | $1,100 | $1.22 | 45d | 1 | 0.26mi |
| 2246 Simpson St Paris, TX | 3.0 | 1.0 | 1508 | $1,250 | $0.83 | 45d | 1 | 0.87mi |
| 2121 Cedar St Paris, TX | 3.0 | 2.0 | 1394 | $2,000 | $1.43 | 45d | 1 | 1.01mi |
| 635 7th St SW Paris, TX | 1.0–4.0 | 1.0–2.0 | 903 | $1,200 | $1.33 | 45d | 16 | 1.11mi |
| 370 29th St NE Paris, TX | 3.0 | 1.0 | 1220 | $1,200 | $0.98 | 45d | 1 | 1.23mi |
Listing history 15 events
-
2026-06-21days on market $40,000 Active 20 DOM
-
2026-06-19days on market $40,000 Active 18 DOM
-
2026-06-18days on market $40,000 Active 17 DOM
-
2026-06-17days on market $40,000 Active 16 DOM
-
2026-06-16days on market $40,000 Active 15 DOM
-
2026-06-16status $40,000 Active 14 DOM
-
2026-06-15days on market $40,000 Active Option Contract 14 DOM
-
2026-06-14days on market $40,000 Active Option Contract 12 DOM
-
2026-06-12statusdays on market $40,000 Active Option Contract 11 DOM
-
2026-06-09days on market $40,000 Active 8 DOM
-
2026-06-08days on market $40,000 Active 7 DOM
-
2026-06-07days on market $40,000 Active 6 DOM
-
2026-06-03days on market $40,000 Active 2 DOM
-
2026-06-02remarks 610-char remark
-
2026-06-02$40,000 Active 1 DOM
ⓘ Source: listings_history table (triggers on properties + properties_extension) + one-shot
backfill from property_details.listing_events for pre-trigger history.
Tax reassessment forecast TX · Resets to sale price
- Current annual tax
- $1,014 · $85/mo
- Projected year-2 tax
- $1,014 · $85/mo
- Expected delta
- $0/yr ($0/mo · -0.0%)
ⓘ Screening estimate from a state-policy table — verify with the county assessor before closing.
Climate risk First Street
- Flood 1/10 Low FEMA zone X (unshaded) · 0% chance over 30 yrs
- Wildfire 6/10 Major
- Heat 7/10 Severe 7 d/yr ≥110°F today · 22 d/yr by 30 yrs out
- Wind 4/10 Moderate 20% chance of damaging wind over 30 yrs
- Air quality 2/10 Low 0 unhealthy d/yr today · 1 by 30 yrs out
Nearby sold comps map
Loading sold comps map…
Walkable amenities ~0.75 mi
Loading nearby amenities…
Taxation est. · year 1
- Rental income
- $14,580
- − Mortgage interest
- −$2,241
- − Property taxes
- −$1,014
- − Insurance
- −$200
- − Repairs & maintenance
- −$1,166
- − Management
- −$1,166
- − Depreciation
- −$1,164
- Taxable income
- $7,629
- Est. tax owed @ 24.0%
- −$1,831
- After-tax cash flow
- $5,956/yr
For passive investors: Depreciation is non-cash, so a rental often shows a tax loss while cash-flowing — sheltering income. Rental losses are passive: they offset passive income freely, and up to $25,000/yr can offset ordinary (W-2) income if you actively participate and your MAGI is under $100k (phasing out to $0 by $150k); unused losses carry forward. On sale, claimed depreciation is recaptured at up to 25%, and gains may owe capital-gains tax (a 1031 exchange can defer both). Figures are a year-1 estimate at your 24.0% rate — not tax advice; consult a CPA.
Schools (NCES district)
- District
- Paris ISD
- NCES district ID
- 4834290
- Math proficiency
- 36% ▼ -11.00%
- Reading proficiency
- 37% ▼ -1.00%
- Median HH income
- $31,515
- Composite
- 29.83/100
- National rank
- #6419
- State rank
- #521 of 826 in TX
Livability — Paris
- Score
- 61/100
- State rank
- #984
- US rank
- #17535
Category grades
Schools grade is shown separately in the Schools card above.
Census & demographics
- Census place
- Paris, TX
- County
- Lamar County · 23,426 people
- City population
- 23,426
- Metro
- Paris, TX
- Population (ZIP)
- 23,426
- Household income
- $46,473
- Rent vs Own
- Severe rent burden
- 1355.0
Population outlook (Lamar County) Hauer SSP2
- Today (2025)
- 48,319 people
- By 2030
- 47,160 · -2.4%
- By 2040
- 44,621 · -7.7%
- By 2050
- 42,024 · -13.0%
- By 2075
- 36,577 · -24.3%
- By 2100
- 30,580 · -36.7%
Race, ethnicity, and origin ACS 2023
- Neighborhood character
- Diverse neighborhood (Simpson 0.60)
- Race & ethnicity
- White 58% Black 22% Hispanic / Latino 13% Two or more races 8%
- Hispanic origin (detail)
- Mexican 12%
- Common ancestry
- Lithuanian 1% Slovak 1% Italian 1%
- Foreign-born
- 3% · Canada, China
- Languages at home
- 92% English-only · Spanish 7%
Political lean MEDSL · Lamar
- 2024 margin
- Solid R (+61.0) · D 19.2% · R 80.3%
- 2008→2024 swing
- -19.1pp toward R · 2008: -42.0pp · 2024: -61.0pp
- All cycles
- 2024: R+61.0 2020: R+57.4 2016: R+59.2 2012: R+50.3 2008: R+42.0
Not yet ingested
- Civics
- —
Market trends
- HPI YoY
- ▼ -201.50%
- Current HPI
- 145.3511
- Rent YoY
- —
- Metro
- Paris, TX
- State GDP YoY
- ▲ 3.95%
- F500 in state
- 110
Industry mix (Fortune 500 HQ in TX)
| Industry | F500 HQs | Revenue |
|---|---|---|
| Energy | 16 | $1,198B |
|
||
| Technology | 5 | $198B |
|
||
| Engineering / Construction | 4 | $72B |
|
||
| Energy Services | 3 | $60B |
|
||
| Utilities | 3 | $41B |
|
||
| Healthcare | 2 | $330B |
|
||
Price history
4 events — show timeline
- 2026-06-01 Listed $40,000 NTREIS
- 2013-07-22 Sold (Public Records) — Public Records
- 2009-04-23 Sold (Public Records) — Public Records
- 2001-08-20 Sold (Public Records) — Public Records
Property tax history
+8.7%/yrLatest (2025): $1,014 · +1.2% YoY. Source: county tax records.
Cash-flow waterfall
monthlySold comps — $/sqft
last 12 mo · ≤1 miLoading sold comps…