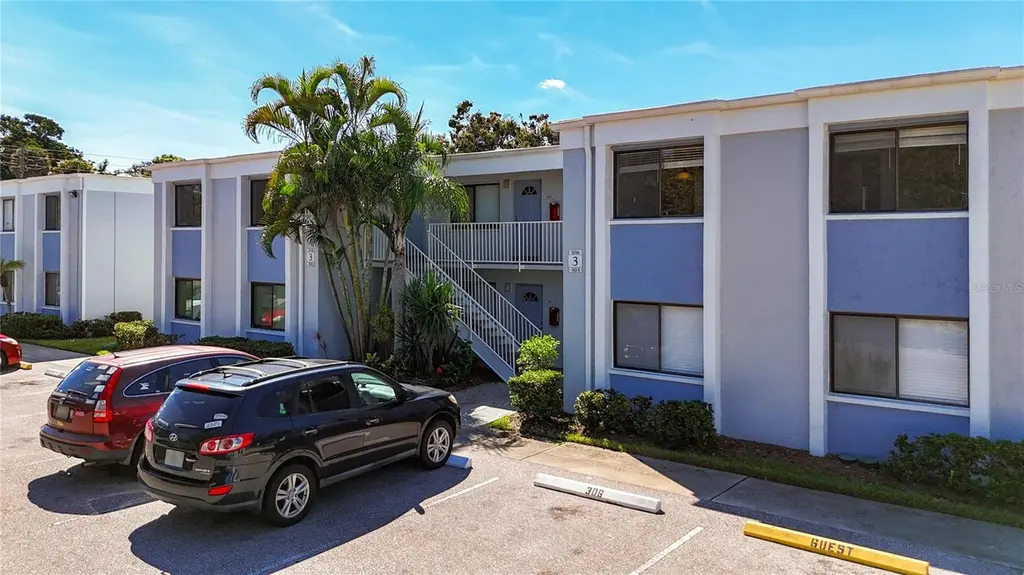
5310 26th St W #306 · Bayshore Gardens, FL
Flood risk 1/10 · Minimal
- FEMA flood zone
- X (unshaded)
- Chance of flooding over 30 yrs
- 0.0%
- Est. flood insurance / yr
- $507 – $1,088
Fire risk 1/10 · Minimal
- Est. fire insurance / yr
- $947 – $1,759
Heat risk 10/10 · Severe
- Hot days now (above 107°F)
- 7 days/yr
- Hot days in 30 yrs
- 28 days/yr
Wind risk 10/10 · Severe
- Chance of severe wind over 30 yrs
- 99.0%
Air-quality risk 2/10 · Minimal
- Unhealthy air days now
- 1 days/yr
- Unhealthy air days in 30 yrs
- 2 days/yr
Risk factors via First Street. Map © Google.
Why this score? — see what drove the D grade
The composite is a weighted blend of 9 inputs, each scored 0–100. Each bar is that input's sub-score; the figure is the points it added to the 100-point composite (weight × sub-score).
- Cash flow +11.5/30.0
- ARV discount +7.5/15.0
- 1% rule +5.9/10.0
- Schools +4.4/10.0
- Livability +4.1/5.0
- DSCR +3.4/10.0
- Condition / age +2.5/5.0
- Rent growth +1.1/5.0
- Appreciation +0.0/10.0
$159,000
🖨 Deal sheet (PDF) 📄 Offer letter ✓ Due diligence
Listing remarks
This move-in-ready, updated end-unit condo in West Bradenton features luxury vinyl floors, a 2025 kitchen with granite countertops, and a dual-entry bath. Located in the investor-friendly Garden Walk community in a no-flood zone. Interior highlights flooring & kitchen, sleek luxury vinyl plank flooring flows throughout the unit, leading into a bright kitchen equipped with brand-new appliances and granite countertops. Primary suite features an ensuite bath and two closets. Bathroom has a convenient dual-access layout, providing private entry from the primary suite and hallway access for guests. Laundry & Storage features in-unit washer/dryer hookups plus a generous storage closet
Key facts
- Community pool
- Dual-entry bath
- Granite countertops
Tags
Property features AI
Finance
- Other: Unit is unfurnished
- Financial info: Total monthly fees $385; Total annual fees $4,620; Lease restrictions apply
- HOA & community: Association name: James Ro; Monthly condo fee $385 (includes pool, sewer, trash, water, insurance, management, maintenance — grounds and structure, pest control, recreational facilities, escrow reserves, fidelity bond); Pool, clubhouse, fitness center, recreation facilities, community mailbox; Buyer/association approval required; Pets allowed (max ~35 lbs)
Exterior
- Parking: Paved parking
- Utilities: Public water; Public sewer; Electricity connected; Cable available; Water and sewer available/connected
- Home design: Residential condominium; 2 stories total; unit on second floor; Faces east
- Construction: Block and stucco construction; Built-up roof; Slab foundation; Completed condition; Built as part of a 3-building community
- Exterior features: Enclosed, screened rear porch; Balcony; Paved access, near public transit; Mature landscaping with trees; Storage
Interior
- Kitchen: Dishwasher; Freezer; Range; Refrigerator
- Bedrooms: 2 bedrooms
- Flooring: Tile
- Bathrooms: 1 full bathroom
- Heating & cooling: Central heating (electric); Central air conditioning
- Interior features: Solid surface counters; Thermostat; Window treatments; Sliding doors; Storage rooms
- Laundry & utility: Washer hookup; Electric dryer hookup; Laundry inside
Neighborhood map
What this means for you Summary
Snapshot
- This is a 2-bed/1.0-bath condo listed at $159k.
Deal economics
- At list price, monthly cash flow is $-53 ($-642/yr) — negative.
- To cash-flow at today's rent, offer at most $150k (5.9% below list).
- Meets the 1% rule at list price ($2k rent vs $159k).
- Recommended offer: $150k (5.9% below list) — sets the bar for cash-flow.
- Cap rate 5.9% vs local median 4.7% in Bayshore Gardens — meaningfully above typical; check what's discounted (condition, days-on-market, listing class) to confirm the premium yield is real.
Location & tenants
- Location reads 82/100 on livability (#72 in FL, #1,180 nationally) — a professional / high-income tenant draw. Strengths: cost of living A+, housing A+, health & safety A+; Watch: crime C-, commute C-, employment F.
- Manatee (suburban): math 54% / reading 50% proficiency, ranked #26 of 73 in FL (top 36%) — acceptable for families but not a draw, mixed tenant base, ~2y average lease.
- Zoned schools: Bayshore Elementary School (math 51% / reading 36%, grade F, #1,345 of 2,144 statewide, top 64%, 701 students, 72% FRL); Electa Lee Magnet Middle School (math 27% / reading 28%, grade F, #495 of 571 statewide, top 87%, 759 students, 68% FRL); Bayshore High School (math 17% / reading 26%, grade F, #546 of 667 statewide, top 82%, 1,435 students, 65% FRL) — zoned schools average 68% FRL vs 51% district-wide (18 pts higher); higher-poverty schools than district average — tighter screening recommended.
- Zoned-school proficiency averages 31% at this address vs 52% district-wide (-21 pts) — the specific schools serving this property underperform the Manatee average; the district grade overstates school quality for this exact location.
- Market conditions: Rents falling (-5.5%/yr); 362 active listings in the ZIP; 40 comparable units currently listed for rent nearby; rentals at typical pace (median 18d on market — plan ~3-4 weeks tenant-placement turnaround); 7,472 units permitted in Manatee County in 2024 (1,782 in 5+ unit buildings).
- At $1,732/mo this rent would consume 46% of the median local household income ($45k/yr) (locally 1474% of renters already pay >50% of income on rent) — very limited rent-growth headroom before tenants either downsize or default.
Forward outlook
- Local home prices are declining (-3.0%/yr); year-one equity from $1k of loan paydown is wiped out by about $5k of value loss. Plan a longer hold.
- Manatee County population projected at +43% by 2050 — long-run rental-demand tailwind backs the buy-and-hold thesis.
Negotiation context
- It's been on market 23 days — a 2% lower offer ($157k) is reasonable based on typical stale-listing flexibility.
- 2 sale attempts with the ask held roughly flat each time — persistent listings suggest the price (not the market) is what's stuck; bring a comps-based counter.
Risks & watch-outs
- Watch-outs: HOA is 22% of rent.
- Climate carrying-cost: severe wind risk, 99% chance of damaging wind over 30y; extreme-heat days projected 7→28/yr by 2055 (HVAC capex compounding) — expect insurance premiums to compound above CPI over the hold.
Questions for the listing agent
- What do current leases actually rent for vs. the listed asking? Can we see a recent rent roll and the last 12 months of T-12 income?
- Built in 1972 — when were the roof, HVAC, electrical panel, plumbing, and water heater last replaced?
- What does the HOA fee cover, when was the last increase, and are there any pending special assessments or reserve-fund shortfalls?
- Any open or pending special assessments — roof, HVAC, plumbing, elevator, façade? What's the per-unit balance and payoff schedule, and is the seller paying it off at close or rolling it to the buyer?
- Is there a deadline driving the sale (1031 exchange, divorce, estate, relocation)? That informs how much negotiation room exists.
- Schools are F-rated, which usually means shorter tenancies and higher turnover. Who's the typical renter profile here, and what's been the actual vacancy rate?
- The area grade is low — what's the realistic commute time and amenity access for the typical tenant pool here? Any planned neighborhood developments (good or bad) we should know about?
- What's the average days-on-market for RENTAL listings here right now (not sales)? A rising rental-DOM trend means longer vacancies and softer asking-rent achievability than the comps imply.
- What's the recent tenant-quality profile in this submarket — average credit score on applications, eviction rate, late-payment / NSF rate, and stable-employment percentage? A property-management company in the area should have these aggregated.
- How much new apartment / multifamily construction is in the pipeline within 1–3 miles? Heavy new supply (>2% of stock underway) typically softens rents 12–24 months out; light construction supports rent growth.
Investment metrics
- 1% rule
- 1.09% ✓
- Cap rate
- 5.89%
- Cash-on-cash
- -1.44%
- DSCR
- 0.94
- GRM
- 7.7
CMA / ARV
No comps found within radius.
Projected returns pro-forma
-3.0% appreciation · 0.0% rent growth · sell at horizon
- IRR
- -23.0%
- Equity multiple
- 0.24×
- Total profit
- $-34,021
- Equity at exit
- $23,707
- IRR
- -33.4%
- Equity multiple
- -0.18×
- Total profit
- $-52,711
- Equity at exit
- $13,747
Cash invested: $44,520 (down + closing). Projections, not guarantees.
Landlord ↔ Tenant lean methodology
- Overall (STATE)
- 87 Strongly Landlord-Friendly
- State Florida
- 87 Strongly Landlord-Friendly · R+3
- County
- — inherits STATE
- City
- — inherits STATE
ZIP-level market 34207
- Rents YoY
- -5.5%
- Active inventory
- 362
- Price-to-rent
- 7.7×
Monthly cashflow live
- Estimated rent
- $1,732 high interval (Pro) →
- Mortgage (P&I)
- −$834
- Tax from tax record
- −$136 /mo · $1,637/yr
- Insurance
- −$66
- HOA
- −$385
- Vacancy / Maint / Mgmt
- −$364
- Net cashflow
- $-53
Break-even live
Sensitivity live
| Price | -10% $37 | -5% $-8 | +0% $-53 | +5% $-98 | +10% $-143 |
|---|---|---|---|---|---|
| Rent | -10% $-190 | -5% $-122 | +0% $-53 | +5% $15 | +10% $83 |
| Rate | -1.0pp $27 | -0.5pp $-13 | base $-53 | +0.5pp $-95 | +1.0pp $-137 |
UW: 25.0% down · 7.5% · 30yr · 1.5% tax · 5.0% vac · 8.0% maint · 8.0% mgmt
Financing live
Cash to close
- Down payment
- $39,750
- Closing costs
- $4,770
- Reserves months
- —
- Total cash needed
- —
Loan-product check · same deal, 3 products live
Conventional
25% down · 7.5% · 30yr
- Down + closing
- —
- Monthly P&I
- —
- Monthly cashflow
- —
- DSCR
- —
- Eligible?
- —
Personal DTI + credit; lowest rate.
DSCR
20% down · 8.5% · 30yr
- Down + closing
- —
- Monthly P&I
- —
- Monthly cashflow
- —
- DSCR
- —
- Eligible?
- —
No personal income docs; deal must DSCR.
Hard money
10% down · 12.0% · 12mo
- Down + closing
- —
- Monthly P&I
- —
- Monthly cashflow
- —
- DSCR
- —
- Eligible?
- —
Short-term bridge; refi at stabilization.
Rent comps 40 comps
| Address | Beds | Baths | Sqft | Rent | $/sqft | DOM | Units | Dist |
|---|---|---|---|---|---|---|---|---|
| 5400 26th St W Bradenton, FL | 1.0–2.0 | 1.0–2.0 | 902 | $1,651 | $1.83 | 25d | 1 | 0.08mi |
| 5310 26th St W Bradenton, FL | 1.0–2.0 | 1.0 | 789 | $1,550 | $1.96 | 21d | 5 | 0.13mi |
| 5310 26th St W Bradenton, FL | 1.0–2.0 | 1.0 | 789 | $1,450 | $1.84 | 5d | 4 | 0.13mi |
| 5310 26th St W Bradenton, FL | 1.0–2.0 | 1.0 | 789 | $1,450 | $1.84 | 13d | 5 | 0.13mi |
| 2803 52nd Avenue Dr W Unit 2803 Bradenton, FL | 2.0 | 1.0 | 750 | $1,599 | $2.13 | 25d | 1 | 0.16mi |
| 5062 Live Oak Cir Unit 5026 Bradenton, FL | 2.0 | 2.0 | 896 | $1,545 | $1.72 | 17d | 1 | 0.33mi |
| 5026 Water Oak Dr #104 Bradenton, FL | 3.0 | 2.0 | 960 | $2,200 | $2.29 | 25d | 1 | 0.33mi |
| 5059 Live Oak Cir Unit 5059 Bradenton, FL | 2.0 | 2.0 | 896 | $1,900 | $2.12 | 17d | 1 | 0.35mi |
| 3278 51st Avenue Dr W Unit 1 Bradenton, FL | 2.0 | 1.0 | 850 | $1,600 | $1.88 | 25d | 1 | 0.39mi |
| 3401 54th Dr W Bradenton, FL | 2.0–3.0 | 2.0–3.0 | 1293 | $3,300 | $2.55 | 5d | 3 | 0.43mi |
| 3277 51st Avenue Dr W Bradenton, FL | 3.0 | 2.0 | 995 | $1,760 | $1.77 | 5d | 1 | 0.44mi |
| 5027 31st St W Bradenton, FL | 2.0 | 2.0 | 972 | $3,600 | $3.70 | 23d | 1 | 0.45mi |
| 2835 50th Ave W Bradenton, FL | 1.0–2.0 | 1.0–2.0 | 850 | $1,610 | $1.89 | 5d | 16 | 0.49mi |
| 3506 54th Dr W Bradenton, FL | 1.0–2.0 | 1.0–2.0 | 953 | $2,800 | $2.94 | 5d | 2 | 0.49mi |
| 4906 25th St W #101 Bradenton, FL | 2.0 | 1.5 | 1070 | $1,550 | $1.45 | 25d | 1 | 0.51mi |
| 3604 54th Dr W Bradenton, FL | 2.0 | 2.0 | 1114 | $4,050 | $3.64 | 5d | 3 | 0.54mi |
| 3605 54th Dr W Bradenton, FL | 2.0 | 2.0 | 1166 | $3,738 | $3.21 | 5d | 2 | 0.54mi |
| 4812 27th St W Unit 4812 Bradenton, FL | 2.0 | 2.0 | 912 | $1,545 | $1.69 | 13d | 1 | 0.58mi |
| 4812 27th St W Bradenton, FL | 2.0 | 2.0 | 912 | $1,599 | $1.75 | 13d | 1 | 0.58mi |
| 5001 22nd St W Unit B Bradenton, FL | 2.0 | 1.0 | 729 | $1,700 | $2.33 | 17d | 1 | 0.58mi |
| 206 Lakewood Dr Unit 206 Bradenton, FL | 2.0 | 2.0 | 940 | $2,700 | $2.87 | 25d | 1 | 0.65mi |
| 4906 21st St W Bradenton, FL | 2.0 | 1.0 | 918 | $1,700 | $1.85 | 17d | 1 | 0.66mi |
| 184 Pineneedle Dr Bradenton, FL | 2.0 | 2.0 | 940 | $2,100 | $2.23 | 25d | 1 | 0.67mi |
| 4705 27th St W Unit A Bradenton, FL | 2.0 | 1.0 | 750 | $1,325 | $1.77 | 4d | 1 | 0.69mi |
| 2004 49th Ave W Unit 2002 Bradenton, FL | 2.0 | 2.0 | 1021 | $1,950 | $1.91 | 25d | 1 | 0.70mi |
| 5513 18th St W Bradenton, FL | 2.0 | 1.0 | 1000 | $1,499 | $1.50 | 25d | 1 | 0.70mi |
| 3848 59th Ave W Bradenton, FL | 2.0 | 2.0 | 912 | $1,395 | $1.53 | 25d | 1 | 0.70mi |
| 3851 59th Ave W Unit 3851 Bradenton, FL | 2.0 | 2.0 | 912 | $1,500 | $1.64 | 25d | 1 | 0.72mi |
| 3843 59th Ave W Bradenton, FL | 2.0 | 2.0 | 912 | $1,200 | $1.32 | 25d | 1 | 0.72mi |
| 5820 21st St W Bradenton, FL | 3.0 | 2.0 | 1116 | $1,995 | $1.79 | 5d | 1 | 0.77mi |
| 3774 59th Ave W Unit 3774 Bradenton, FL | 2.0 | 2.0 | 912 | $1,350 | $1.48 | 25d | 1 | 0.77mi |
| 3775 59th Ave W Unit 3775 Bradenton, FL | 2.0 | 2.0 | 912 | $3,500 | $3.84 | 25d | 1 | 0.77mi |
| 3773 59th Ave W Bradenton, FL | 2.0 | 2.0 | 912 | $1,595 | $1.75 | 25d | 1 | 0.78mi |
| 5531 16th St W Unit 5537 Bradenton, FL | 2.0 | 1.0 | 750 | $1,650 | $2.20 | 5d | 1 | 0.78mi |
| 3545 59th Ave W #3545 Bradenton, FL | 3.0 | 2.0 | 1037 | $1,600 | $1.54 | 17d | 1 | 0.81mi |
| 3739 59th Ave W Unit 3739 Bradenton, FL | 2.0 | 2.0 | 912 | $1,575 | $1.73 | 17d | 1 | 0.81mi |
| 3533 59th Ave W Unit 3533 Bradenton, FL | 2.0 | 2.0 | 912 | $1,500 | $1.64 | 17d | 1 | 0.82mi |
| 2423 60th Ave W Unit K29 Bradenton, FL | 2.0 | 2.0 | 1026 | $1,495 | $1.46 | 25d | 1 | 0.82mi |
| 2547 60th Ave W Unit L-36 Bradenton, FL | 1.0 | 1.0 | 576 | $1,100 | $1.91 | 17d | 1 | 0.82mi |
| 3527 59th Ave W Unit 3527 Bradenton, FL | 2.0 | 2.0 | 912 | $1,400 | $1.54 | 25d | 1 | 0.83mi |
HOA detail condo
- Monthly dues
- $385 · $4,620/yr
- Assessments
- None detected in remarks — confirm with the listing agent.
Listing history 15 events
-
2026-06-22days on market $159,000 Active 23 DOM
-
2026-06-18days on market $159,000 Active 20 DOM
-
2026-06-17days on market $159,000 Active 19 DOM
-
2026-06-16days on market $159,000 Active 18 DOM
-
2026-06-15days on market $159,000 Active 17 DOM
-
2026-06-13days on market $159,000 Active 15 DOM
-
2026-06-13days on market $159,000 Active 14 DOM
-
2026-06-10days on market $159,000 Active 12 DOM
-
2026-06-09days on market $159,000 Active 11 DOM
-
2026-06-08days on market $159,000 Active 10 DOM
-
2026-06-07days on market $159,000 Active 9 DOM
-
2026-06-03days on market $159,000 Active 5 DOM
-
2026-06-02days on market $159,000 Active 4 DOM
-
2026-06-01days on market $159,000 Active 3 DOM
-
2026-05-31days on market $159,000 Active 2 DOM
ⓘ Source: listings_history table (triggers on properties + properties_extension) + one-shot
backfill from property_details.listing_events for pre-trigger history.
Tax reassessment forecast FL · Resets to sale price
- Current annual tax
- $1,637 · $136/mo
- Projected year-2 tax
- $1,637 · $136/mo
- Expected delta
- $0/yr ($0/mo · 0.0%)
ⓘ Screening estimate from a state-policy table — verify with the county assessor before closing.
Climate risk First Street
- Flood 1/10 Low FEMA zone X (unshaded) · 0% chance over 30 yrs
- Wildfire 1/10 Low
- Heat 10/10 Extreme 7 d/yr ≥107°F today · 28 d/yr by 30 yrs out
- Wind 10/10 Extreme 99% chance of damaging wind over 30 yrs
- Air quality 2/10 Low 1 unhealthy d/yr today · 2 by 30 yrs out
Nearby sold comps map
Loading sold comps map…
Walkable amenities ~0.75 mi
Loading nearby amenities…
Taxation est. · year 1
- Rental income
- $20,780
- − Mortgage interest
- −$8,906
- − Property taxes
- −$1,637
- − Insurance
- −$795
- − Repairs & maintenance
- −$1,662
- − Management
- −$1,662
- − HOA
- −$4,620
- − Depreciation
- −$4,625
- Taxable loss
- −$3,129
- Est. tax savings @ 24.0%
- +$751
- After-tax cash flow
- $109/yr
For passive investors: Depreciation is non-cash, so a rental often shows a tax loss while cash-flowing — sheltering income. Rental losses are passive: they offset passive income freely, and up to $25,000/yr can offset ordinary (W-2) income if you actively participate and your MAGI is under $100k (phasing out to $0 by $150k); unused losses carry forward. On sale, claimed depreciation is recaptured at up to 25%, and gains may owe capital-gains tax (a 1031 exchange can defer both). Figures are a year-1 estimate at your 24.0% rate — not tax advice; consult a CPA.
Schools (NCES district)
- District
- Manatee
- NCES district ID
- 1201230
- Math proficiency
- 54% ▼ -6.00%
- Reading proficiency
- 50% ▼ -2.00%
- Median HH income
- $49,607
- Composite
- 44.43/100
- National rank
- #2806
- State rank
- #26 of 73 in FL
Livability — Bayshore Gardens
- Score
- 82/100
- State rank
- #72
- US rank
- #1180
Category grades
Schools grade is shown separately in the Schools card above.
Census & demographics
- Census place
- Bayshore Gardens, FL
- County
- Manatee County · 416,364 people
- City population
- 33,840
- Metro
- North Port-Sarasota-Bradenton, FL
- Population (ZIP)
- 34,081
- Household income
- $45,010
- Rent vs Own
- Severe rent burden
- 1474.0
Population outlook (Manatee County) Hauer SSP2
- Today (2025)
- 447,342 people
- By 2030
- 488,911 · +9.3%
- By 2040
- 567,934 · +27.0%
- By 2050
- 637,995 · +42.6%
- By 2075
- 781,970 · +74.8%
- By 2100
- 848,272 · +89.6%
Race, ethnicity, and origin ACS 2023
- Neighborhood character
- Diverse neighborhood (Simpson 0.57)
- Race & ethnicity
- White 58% Hispanic / Latino 29% Two or more races 13% Black 7%
- Hispanic origin (detail)
- Mexican 12% Puerto Rican 4% Cuban 3% Dominican 1%
- Common ancestry
- Lithuanian 3% Romanian 2% Slovak 2%
- Foreign-born
- 16% · Canada, Jamaica
- Languages at home
- 74% English-only · Spanish 22% Other Indo-European 1% French/Haitian/Cajun 1%
Political lean MEDSL · Manatee
- 2024 margin
- Strong R (+23.5) · D 37.9% · R 61.4%
- 2008→2024 swing
- -16.5pp toward R · 2008: -7.0pp · 2024: -23.5pp
- All cycles
- 2024: R+23.5 2020: R+16.1 2016: R+17.1 2012: R+12.5 2008: R+7.0
Not yet ingested
- Civics
- —
Market trends
- HPI YoY
- ▼ -305.32%
- Current HPI
- 369.9899
- Rent YoY
- ▼ -5.50%
- Metro
- North Port-Sarasota-Bradenton, FL
- State GDP YoY
- ▲ 3.28%
- F500 in state
- 36
Industry mix (Fortune 500 HQ in FL)
| Industry | F500 HQs | Revenue |
|---|---|---|
| Industrial Technology | 2 | $29B |
|
||
| Insurance | 2 | $17B |
|
||
| Retail | 1 | $60B |
|
||
| Technology Distribution | 1 | $58B |
|
||
| Homebuilding | 1 | $35B |
|
||
| Technology Manufacturing | 1 | $35B |
|
||
Price history
+34.9% since first listed6 events — show timeline
- 2026-05-29 Listed $159,000 Stellar MLS as Distributed by MLS Grid
- 2026-04-30 Listing Removed — Stellar MLS as Distributed by MLS Grid
- 2026-04-10 Price Changed $165,000 Stellar MLS as Distributed by MLS Grid
- 2025-10-09 Listed $179,000 Stellar MLS as Distributed by MLS Grid
- 2005-06-28 Sold (Public Records) $139,900 Public Records
- 2005-06-10 Sold (Public Records) $117,900 Public Records
Property tax history
+10.9%/yrLatest (2025): $1,637 · -0.1% YoY. Source: county tax records.
Cash-flow waterfall
monthlySold comps — $/sqft
last 12 mo · ≤1 miLoading sold comps…