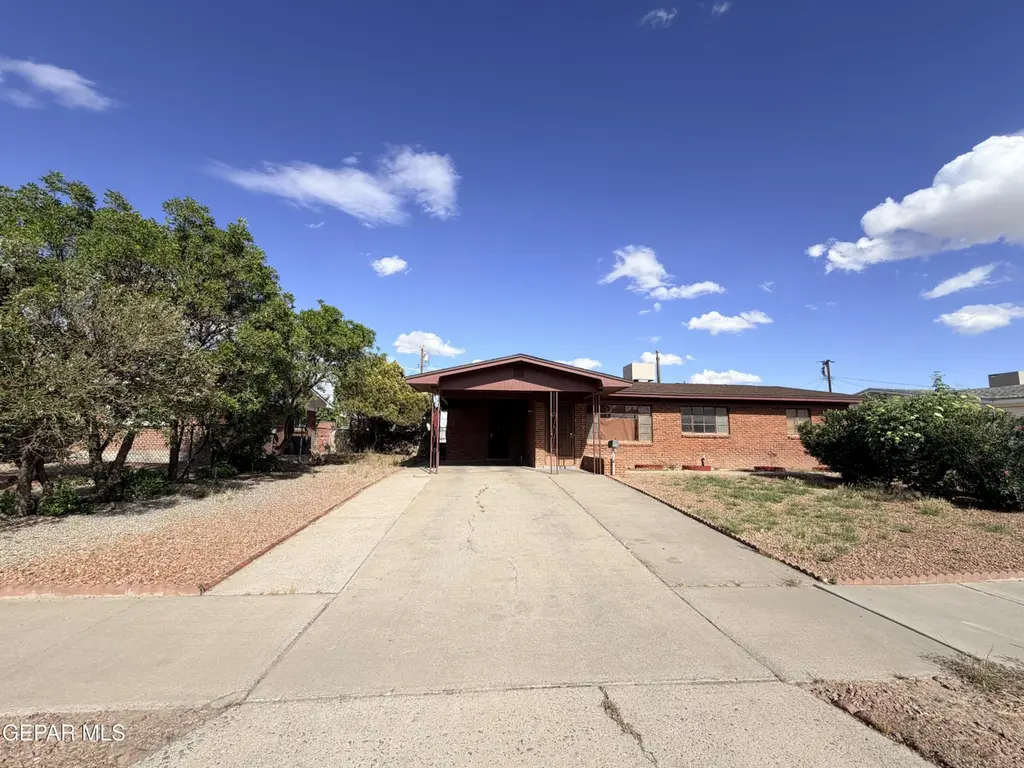
2712 Catnip St · El Paso, TX
Flood risk 1/10 · Minimal
- FEMA flood zone
- X (unshaded)
- Chance of flooding over 30 yrs
- 0.0%
- Est. flood insurance / yr
- $507 – $1,088
Fire risk 1/10 · Minimal
- Est. fire insurance / yr
- $1,222 – $2,270
Heat risk 6/10 · Moderate
- Hot days now (above 100°F)
- 7 days/yr
- Hot days in 30 yrs
- 24 days/yr
Wind risk 1/10 · Minimal
- Chance of severe wind over 30 yrs
- —
Air-quality risk 2/10 · Minimal
- Unhealthy air days now
- 1 days/yr
- Unhealthy air days in 30 yrs
- 2 days/yr
Risk factors via First Street. Map © Google.
Why this score? — see what drove the D grade
The composite is a weighted blend of 9 inputs, each scored 0–100. Each bar is that input's sub-score; the figure is the points it added to the 100-point composite (weight × sub-score).
- Cash flow +11.9/30.0
- ARV discount +7.5/15.0
- Rent growth +5.0/5.0
- 1% rule +4.7/10.0
- Livability +4.0/5.0
- DSCR +3.5/10.0
- Schools +2.6/10.0
- Condition / age +2.5/5.0
- Appreciation +0.0/10.0
$160,000
🖨 Deal sheet (PDF) 📄 Offer letter ✓ Due diligence
Listing remarks
Opportunity knocks in Montclair! This centrally located property sits on a large 8,400 sq ft lot and is perfectly positioned for those looking to invest, renovate, or build value. The home is in need of updates, but its prime location. Within walking distance to schools, shopping, and conveniences makes it a standout opportunity. With great bones and strong after-repair value potential, this is your chance to create something special. Whether you're an investor or a buyer with vision, this property offers endless potential in a fantastic neighborhood.
Key facts
- 8,400 sq ft lot
- Built 1959
- Listed 7 days
Neighborhood map
What this means for you Summary
Snapshot
- This is a 3-bed/2.0-bath single-family listed at $160k.
Deal economics
- At list price, monthly cash flow is $-40 ($-482/yr) — negative.
- To cash-flow at today's rent, offer at most $153k (4.4% below list).
- To meet the 1% rule (rent ≥ 1% of price), the offer needs to be $156k (2.5% below list).
- Recommended offer: $153k (4.4% below list) — sets the bar for cash-flow.
Location & tenants
- Location reads 81/100 on livability (#23 in TX, #1,375 nationally) — a professional / high-income tenant draw. Strengths: commute A+, cost of living A+, housing A+; Watch: employment D+.
- Ysleta ISD (urban): math 27% / reading 35% proficiency, ranked #626 of 826 in TX (top 76%) — families likely to look elsewhere, expect single-tenant / working-renter base with shorter leases; 68% free/reduced lunch — lower-income household profile, screen leases tightly.
- Zoned schools: Scotsdale El (math 36% / reading 39%, grade F, #1,744 of 4,322 statewide, top 41%, 679 students, 73% FRL); Eastwood Middle (math 28% / reading 41%, grade F, #858 of 1,662 statewide, top 54%, 1,265 students, 66% FRL); Eastwood H S (math 32% / reading 56%, grade F, #697 of 1,632 statewide, top 43%, 2,381 students, 54% FRL) — zoned schools at 64% FRL track the district average.
- Market conditions: Rents rising fast (+13.2%/yr); 76 active listings in the ZIP; 16 comparable units currently listed for rent nearby; rentals at typical pace (median 25d on market — plan ~3-4 weeks tenant-placement turnaround); 2,196 units permitted in El Paso County in 2024 (143 in 5+ unit buildings).
- This rent runs 32% of the median local income ($58k/yr) — at the standard rent-burdened threshold; future hikes will face affordability resistance.
Forward outlook
- Local home prices are declining (-3.0%/yr); year-one equity from $1k of loan paydown is wiped out by about $5k of value loss. Plan a longer hold.
- El Paso County population projected at +10% by 2050 — modest demand growth; plan on rents tracking national, not racing it.
Negotiation context
- Only 7 days on market — expect competitive offers; lowballing is unlikely to land.
- Current owner paid $40k; list at $160k implies a 300% gain — meaningful room to come down on a strong offer.
Risks & watch-outs
- Watch-outs: property tax is 2.7% of price; built in 1959 — expect roof / HVAC / electrical / plumbing capex.
- Climate carrying-cost: extreme-heat days projected 7→24/yr by 2055 (HVAC capex compounding) — expect insurance premiums to compound above CPI over the hold.
Questions for the listing agent
- What do current leases actually rent for vs. the listed asking? Can we see a recent rent roll and the last 12 months of T-12 income?
- Built in 1959 — when were the roof, HVAC, electrical panel, plumbing, and water heater last replaced?
- Property tax is high relative to price — has the assessment been appealed recently, and will the sale trigger a re-assessment?
- Is there a deadline driving the sale (1031 exchange, divorce, estate, relocation)? That informs how much negotiation room exists.
- Schools are B-rated — typically a magnet for longer-tenancy family renters. What's the average tenant stay here, and is there a school-zone premium baked into asking?
- The area grade is low — what's the realistic commute time and amenity access for the typical tenant pool here? Any planned neighborhood developments (good or bad) we should know about?
- What's the average days-on-market for RENTAL listings here right now (not sales)? A rising rental-DOM trend means longer vacancies and softer asking-rent achievability than the comps imply.
- What's the recent tenant-quality profile in this submarket — average credit score on applications, eviction rate, late-payment / NSF rate, and stable-employment percentage? A property-management company in the area should have these aggregated.
- How much new for-sale + rental construction is in the pipeline within 1–3 miles? Heavy new supply typically softens prices + rents 12–24 months out; constrained supply supports both.
Investment metrics
- 1% rule
- 0.97% ✗
- Cap rate
- 5.99%
- Cash-on-cash
- -1.08%
- DSCR
- 0.95
- GRM
- 8.5
CMA / ARV
No comps found within radius.
Projected returns pro-forma
-3.0% appreciation · 8.0% rent growth · sell at horizon
- IRR
- -11.8%
- Equity multiple
- 0.55×
- Total profit
- $-20,119
- Equity at exit
- $23,857
- IRR
- 4.2%
- Equity multiple
- 1.38×
- Total profit
- $17,209
- Equity at exit
- $13,834
Cash invested: $44,800 (down + closing). Projections, not guarantees.
Landlord ↔ Tenant lean methodology
- Overall (STATE)
- 87 Strongly Landlord-Friendly
- State Texas
- 87 Strongly Landlord-Friendly · R+5
- County
- — inherits STATE
- City
- — inherits STATE
ZIP-level market 79925
- Home prices YoY
- -16.3%
- Rents YoY
- 13.2%
- Active inventory
- 76
- Price-to-rent
- 8.5×
Monthly cashflow live
- Estimated rent
- $1,560 high interval (Pro) →
- Mortgage (P&I)
- −$839
- Tax from tax record
- −$367 /mo · $4,399/yr
- Insurance
- −$67
- HOA
- −$0
- Vacancy / Maint / Mgmt
- −$328
- Net cashflow
- $-40
Break-even live
Sensitivity live
| Price | -10% $50 | -5% $5 | +0% $-40 | +5% $-85 | +10% $-131 |
|---|---|---|---|---|---|
| Rent | -10% $-163 | -5% $-102 | +0% $-40 | +5% $21 | +10% $83 |
| Rate | -1.0pp $40 | -0.5pp $0 | base $-40 | +0.5pp $-82 | +1.0pp $-124 |
UW: 25.0% down · 7.5% · 30yr · 1.5% tax · 5.0% vac · 8.0% maint · 8.0% mgmt
Financing live
Cash to close
- Down payment
- $40,000
- Closing costs
- $4,800
- Reserves months
- —
- Total cash needed
- —
Loan-product check · same deal, 3 products live
Conventional
25% down · 7.5% · 30yr
- Down + closing
- —
- Monthly P&I
- —
- Monthly cashflow
- —
- DSCR
- —
- Eligible?
- —
Personal DTI + credit; lowest rate.
DSCR
20% down · 8.5% · 30yr
- Down + closing
- —
- Monthly P&I
- —
- Monthly cashflow
- —
- DSCR
- —
- Eligible?
- —
No personal income docs; deal must DSCR.
Hard money
10% down · 12.0% · 12mo
- Down + closing
- —
- Monthly P&I
- —
- Monthly cashflow
- —
- DSCR
- —
- Eligible?
- —
Short-term bridge; refi at stabilization.
Rent comps 16 comps
| Address | Beds | Baths | Sqft | Rent | $/sqft | DOM | Units | Dist |
|---|---|---|---|---|---|---|---|---|
| 9304 Lait Dr El Paso, TX | 3.0 | 2.0 | 1426 | $1,655 | $1.16 | 4d | 1 | 0.41mi |
| 9300 Viscount Blvd El Paso, TX | 2.0 | 1.0–2.0 | 761 | $1,105 | $1.45 | 25d | 6 | 0.60mi |
| 9455 Viscount Blvd El Paso, TX | 1.0–2.0 | 1.0–1.5 | 954 | $1,160 | $1.22 | 45d | 4 | 0.79mi |
| 2933 Wedgewood Dr El Paso, TX | 2.0 | 1.0 | 985 | $1,200 | $1.22 | 16d | 1 | 0.80mi |
| 9535 Acer Ave El Paso, TX | 1.0–2.0 | 1.0 | 740 | $1,470 | $1.99 | 4d | 18 | 0.83mi |
| 3020 Wedgewood Dr El Paso, TX | 3.0 | 2.0 | 1440 | $1,800 | $1.25 | 12d | 1 | 0.91mi |
| 3020 Wedgewood Dr El Paso, TX | 3.0 | 1.5 | 1440 | $1,800 | $1.25 | 25d | 1 | 0.92mi |
| 8500 Viscount Blvd El Paso, TX | 3.0 | 1.0–2.0 | 812 | $1,350 | $1.66 | 4d | 7 | 0.95mi |
| 8636 Mettler Dr Unit B El Paso, TX | 2.0 | 1.0 | 1000 | $1,395 | $1.40 | 45d | 1 | 1.01mi |
| 1513 Fir St El Paso, TX | 3.0 | 2.0 | 1430 | $1,875 | $1.31 | 45d | 1 | 1.03mi |
| 8208 Dempsey Ave El Paso, TX | 3.0 | 2.0 | 1291 | $1,675 | $1.30 | 4d | 1 | 1.15mi |
| 9800 Montana Ave Unit 2 Bedroom El Paso, TX | 2.0 | 1.0 | 902 | $1,199 | $1.33 | 45d | 1 | 1.16mi |
| 7900 Viscount Blvd El Paso, TX | 2.0 | 1.0–2.0 | 724 | $1,175 | $1.62 | 45d | 4 | 1.22mi |
| 1405 Cessna Dr Unit A El Paso, TX | 2.0 | 1.5 | 1480 | $1,095 | $0.74 | 45d | 1 | 1.28mi |
| 10421 Ashwood Dr Unit C El Paso, TX | 3.0 | 2.0 | 1000 | $1,500 | $1.50 | 25d | 1 | 1.38mi |
| 7423 Alpine Dr El Paso, TX | 3.0 | 1.0 | 957 | $1,485 | $1.55 | 4d | 1 | 1.39mi |
Listing history 4 events
-
2026-04-15status Pending
-
2026-04-08$160,000 Active
-
1986-03-04soldstatus $40,000
-
1986-03-03soldstatus
ⓘ Source: listings_history table (triggers on properties + properties_extension) + one-shot
backfill from property_details.listing_events for pre-trigger history.
Tax reassessment forecast TX · Resets to sale price
- Current annual tax
- $4,399 · $367/mo
- Projected year-2 tax
- $4,399 · $367/mo
- Expected delta
- $0/yr ($0/mo · 0.0%)
ⓘ Screening estimate from a state-policy table — verify with the county assessor before closing.
Climate risk First Street
- Flood 1/10 Low FEMA zone X (unshaded) · 0% chance over 30 yrs
- Wildfire 1/10 Low
- Heat 6/10 Major 7 d/yr ≥100°F today · 24 d/yr by 30 yrs out
- Wind 1/10 Low
- Air quality 2/10 Low 1 unhealthy d/yr today · 2 by 30 yrs out
Nearby sold comps map
Loading sold comps map…
Walkable amenities ~0.75 mi
Loading nearby amenities…
Taxation est. · year 1
- Rental income
- $18,715
- − Mortgage interest
- −$8,962
- − Property taxes
- −$4,399
- − Insurance
- −$800
- − Repairs & maintenance
- −$1,497
- − Management
- −$1,497
- − Depreciation
- −$4,655
- Taxable loss
- −$3,095
- Est. tax savings @ 24.0%
- +$743
- After-tax cash flow
- $260/yr
For passive investors: Depreciation is non-cash, so a rental often shows a tax loss while cash-flowing — sheltering income. Rental losses are passive: they offset passive income freely, and up to $25,000/yr can offset ordinary (W-2) income if you actively participate and your MAGI is under $100k (phasing out to $0 by $150k); unused losses carry forward. On sale, claimed depreciation is recaptured at up to 25%, and gains may owe capital-gains tax (a 1031 exchange can defer both). Figures are a year-1 estimate at your 24.0% rate — not tax advice; consult a CPA.
Schools (NCES district)
- District
- Ysleta ISD
- NCES district ID
- 4846680
- Math proficiency
- 27% ▼ -31.00%
- Reading proficiency
- 35% ▼ -11.00%
- Median HH income
- $35,826
- Composite
- 25.65/100
- National rank
- #7400
- State rank
- #626 of 826 in TX
Livability — El Paso
- Score
- 81/100
- State rank
- #23
- US rank
- #1375
Category grades
Schools grade is shown separately in the Schools card above.
Census & demographics
- Census place
- El Paso, TX
- County
- El Paso County · 761,266 people
- City population
- 630,223
- Metro
- El Paso, TX
- Population (ZIP)
- 38,621
- Household income
- $57,623
- Rent vs Own
- Severe rent burden
- 1545.0
Population outlook (El Paso County) Hauer SSP2
- Today (2025)
- 897,899 people
- By 2030
- 922,694 · +2.8%
- By 2040
- 960,492 · +7.0%
- By 2050
- 982,919 · +9.5%
- By 2075
- 997,266 · +11.1%
- By 2100
- 900,630 · +0.3%
Race, ethnicity, and origin ACS 2023
- Neighborhood character
- Predominantly Hispanic (81%)
- Race & ethnicity
- Hispanic / Latino 81% Two or more races 38% White 12% Black 3%
- Hispanic origin (detail)
- Mexican 75%
- Common ancestry
- Romanian 2%
- Foreign-born
- 20% · Canada, Philippines
- Languages at home
- 36% English-only · Spanish 61% French/Haitian/Cajun 1%
Political lean MEDSL · El Paso
- 2024 margin
- D (+15.1) · D 57.0% · R 41.8% · Other 1.2%
- 2008→2024 swing
- -17.4pp toward R · 2008: 32.5pp · 2024: 15.1pp
- All cycles
- 2024: D+15.1 2020: D+35.1 2016: D+43.2 2012: D+32.6 2008: D+32.5
Not yet ingested
- Civics
- —
Market trends
- HPI YoY
- ▼ -47.46%
- Current HPI
- 244.2058
- Rent YoY
- ▲ 13.23%
- Metro
- El Paso, TX
- State GDP YoY
- ▲ 3.95%
- F500 in state
- 110
Industry mix (Fortune 500 HQ in TX)
| Industry | F500 HQs | Revenue |
|---|---|---|
| Energy | 16 | $1,198B |
|
||
| Technology | 5 | $198B |
|
||
| Engineering / Construction | 4 | $72B |
|
||
| Energy Services | 3 | $60B |
|
||
| Utilities | 3 | $41B |
|
||
| Healthcare | 2 | $330B |
|
||
Price history
+300.0% since first listed4 events — show timeline
- 2026-04-15 Pending — GEPARMLS
- 2026-04-08 Listed $160,000 GEPARMLS
- 1986-03-04 Sold (Public Records) $40,000 Public Records
- 1986-03-03 Sold (Public Records) — Public Records
Property tax history
+4.9%/yrLatest (2025): $4,399 · +11.7% YoY. Source: county tax records.
Cash-flow waterfall
monthlySold comps — $/sqft
last 12 mo · ≤1 miLoading sold comps…