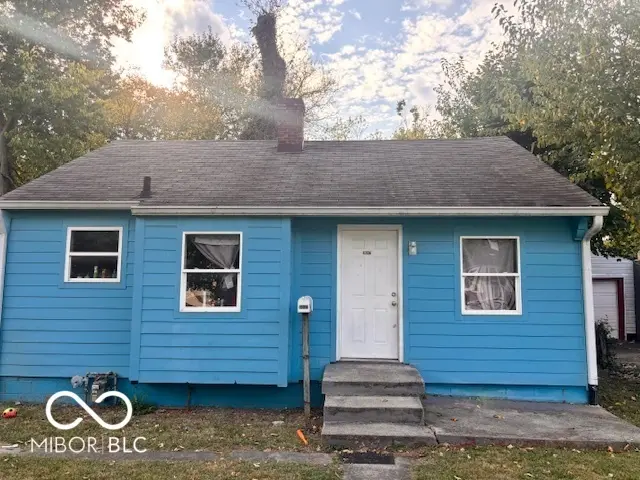
3042 N Temple Ave · Indianapolis city (balance), IN
Flood risk 7/10 · Major
- FEMA flood zone
- X (unshaded)
- Chance of flooding over 30 yrs
- 0.99%
- Est. flood insurance / yr
- $473 – $860
Fire risk 1/10 · Minimal
- Est. fire insurance / yr
- $717 – $1,331
Heat risk 3/10 · Minor
- Hot days now (above 102°F)
- 7 days/yr
- Hot days in 30 yrs
- 18 days/yr
Wind risk 2/10 · Minimal
- Chance of severe wind over 30 yrs
- 1.0%
Air-quality risk 4/10 · Minor
- Unhealthy air days now
- 5 days/yr
- Unhealthy air days in 30 yrs
- 7 days/yr
Risk factors via First Street. Map © Google.
Why this score? — see what drove the C- grade
The composite is a weighted blend of 9 inputs, each scored 0–100. Each bar is that input's sub-score; the figure is the points it added to the 100-point composite (weight × sub-score).
- Cash flow +18.6/30.0
- ARV discount +15.0/15.0
- DSCR +5.8/10.0
- 1% rule +5.3/10.0
- Rent growth +2.7/5.0
- Livability +2.5/5.0
- Condition / age +2.5/5.0
- Schools +1.4/10.0
- Appreciation +0.0/10.0
$95,000
🖨 Deal sheet 📄 Offer letter ✓ Due diligence
Listing remarks MLS
welcome to 3042 n temple Ave! this charming 2 bedroom, 1 bath home has comfort and convenience, ready for your personal touch the home sits in a spacious lot with a large backyard, ideal for gatherings, gardening locate just minutes from downtown Indianapolis, shopping dining schools and major highways, this property offers both accessibility and potential, whether you are first time home buyer, downsizing or looking for an investment ,this home checks all the boxes
Key facts
- Large backyard
- Spacious lot
- 6,839 sq ft lot
Tags
Neighborhood map
What this means for you Summary
Snapshot
- This is a 2-bed/1.0-bath single-family listed at $95k.
Deal economics
- At list price, monthly cash flow is $36 ($435/yr) — positive.
- The deal already cash-flows at list — no discount required.
- Meets the 1% rule at list price ($981 rent vs $95k).
- Recommended offer: $84k (12.0% below list) — sets the bar for market timing.
- Cap rate 7.5% vs local median 4.4% in Indianapolis city (balance) — top-decile yield for the area; either an underpriced asset or a hidden risk that comps aren't pricing in. Stress-test before assuming the spread holds.
Location & tenants
- Location reads: area grade C — affects rentability + tenant quality, not the cash-flow math above.
- Indianapolis Public Schools (urban): math 14% / reading 20% proficiency, ranked #286 of 301 in IN (top 95%) — low school quality limits family demand, transient renter base, plan for 1-2y turnover; 77% free/reduced lunch — lower-income household profile, screen leases tightly.
- Market conditions: Rents flat; 334 active listings in the ZIP; 29 comparable units currently listed for rent nearby; rentals at typical pace (median 24d on market — plan ~3-4 weeks tenant-placement turnaround); lower-income renter base — watch delinquency; 1,906 units permitted in Marion County in 2024 (621 in 5+ unit buildings).
- This rent runs 31% of the median local income ($38k/yr) — at the standard rent-burdened threshold; future hikes will face affordability resistance.
Forward outlook
- Local home prices are declining (-3.0%/yr); year-one equity from $657 of loan paydown is wiped out by about $3k of value loss. Plan a longer hold.
- Marion County population projected at +18% by 2050 — long-run rental-demand tailwind backs the buy-and-hold thesis.
Negotiation context
- It's been on market 223 days — a 12% lower offer ($84k) is reasonable based on typical stale-listing flexibility.
- 4 sale attempts since 10y ago; this cycle's ask has dropped $10k (10%) from the opening price — seller is motivated, your offer sets the floor, not the list.
- Current owner paid $40k; list at $95k implies a 138% gain — meaningful room to come down on a strong offer.
Risks & watch-outs
- Watch-outs: flood insurance adds $56/mo; built in 1946 — expect roof / HVAC / electrical / plumbing capex.
- Climate carrying-cost: major flood risk — expect insurance premiums to compound above CPI over the hold.
Questions for the listing agent
- It's been on market 223 days. Have you received any prior offers? Is the seller open to a 12% concession, seller financing, or rate buy-down credit?
- Built in 1946 — when were the roof, HVAC, electrical panel, plumbing, and water heater last replaced?
- What's the actual annual flood-insurance premium (NFIP or private), and is the property in a SFHA with mandatory coverage?
- Why hasn't it sold? Are there any deal-killer items the seller is aware of (foundation, flood, title, zoning, code violations)?
- Is there a deadline driving the sale (1031 exchange, divorce, estate, relocation)? That informs how much negotiation room exists.
- What's the average days-on-market for RENTAL listings here right now (not sales)? A rising rental-DOM trend means longer vacancies and softer asking-rent achievability than the comps imply.
- What's the recent tenant-quality profile in this submarket — average credit score on applications, eviction rate, late-payment / NSF rate, and stable-employment percentage? A property-management company in the area should have these aggregated.
- How much new for-sale + rental construction is in the pipeline within 1–3 miles? Heavy new supply typically softens prices + rents 12–24 months out; constrained supply supports both.
Investment metrics
- 1% rule
- 1.03% ✓
- Cap rate
- 7.45%
- Cash-on-cash
- 4.14%
- DSCR
- 1.18
- GRM
- 8.1
CMA / ARV
- ARV (median comp)
- $129,361
- List price
- $95,000
- Delta
- -26.56%
- Verdict
- UNDERPRICED
- Comps
- 20 within 1.0 mi
Show comp detail 12 sales within ~0.75 mi
| Address | Dist | Beds/Ba | Sqft | Sold | Price | $/sf | Match |
|---|---|---|---|---|---|---|---|
| 3135 N Temple Ave | 0.13mi | 1/1.0 (-1) | 725 (-0%) | 4mo | $78,000 | $108 | 86 |
| 3105 N Tacoma Ave | 0.08mi | 2/1.0 | 696 (-4%) | 10mo | $137,500 | $198 | 81 |
| 3061 N Tacoma Ave | 0.05mi | 2/1.0 | 672 (-8%) | 6mo | $43,000 | $64 | 80 |
| 3114 Adams St | 0.52mi | 2/1.0 | 725 (-0%) | 3mo | $63,000 | $87 | 73 |
| 2801 Brouse Ave | 0.36mi | 2/1.0 | 720 (-1%) | 13mo | $74,900 | $104 | 70 |
| 2959 N Lasalle St | 0.49mi | 2/1.0 | 720 (-1%) | 11mo | $59,900 | $83 | 66 |
| 2724 N Dearborn St | 0.57mi | 2/1.0 | 720 (-1%) | 10mo | $95,000 | $132 | 64 |
| 3331 Orchard Ave | 0.55mi | 2/1.0 | 720 (-1%) | 14mo | $115,000 | $160 | 61 |
| 2839 N Lasalle St | 0.56mi | 2/1.0 | 768 (+6%) | 5mo | $55,000 | $72 | 60 |
| 3145 Stuart St | 0.60mi | 2/1.0 | 725 (-0%) | 14mo | $79,000 | $109 | 60 |
| 2942 N Dearborn St | 0.41mi | 2/1.0 | 825 (+14%) | 7mo | $70,000 | $85 | 52 |
| 3015 Adams St | 0.55mi | 2/1.0 | 819 (+13%) | 9mo | $155,000 | $189 | 46 |
Match score weights: distance 35% · size 25% · config 20% · recency 20%. Top-matched comps best support the ARV.
Projected returns pro-forma
-3.0% appreciation · 0.81% rent growth · sell at horizon
- IRR
- -16.4%
- Equity multiple
- 0.43×
- Total profit
- $-15,134
- Equity at exit
- $14,165
- IRR
- -13.2%
- Equity multiple
- 0.31×
- Total profit
- $-18,246
- Equity at exit
- $8,214
Cash invested: $26,600 (down + closing). Projections, not guarantees.
Landlord ↔ Tenant lean methodology
- Overall (STATE)
- 90 Strongly Landlord-Friendly
- State Indiana
- 90 Strongly Landlord-Friendly · R+11
- County
- — inherits STATE
- City
- — inherits STATE
ZIP-level market 46218
- Home prices YoY
- -17.1%
- Rents YoY
- 0.8%
- Active inventory
- 334
- Price-to-rent
- 8.1×
Monthly cashflow live
- Estimated rent
- $981 high interval (Pro) →
- Mortgage (P&I)
- −$498
- Tax from tax record
- −$145 /mo · $1,745/yr
- Insurance
- −$40
- Flood insurance flood zone
- −$56 /mo · $666/yr
- HOA
- −$0
- Vacancy / Maint / Mgmt
- −$206
- Net cashflow
- $36
Break-even live
UW: 25.0% down · 7.5% · 30yr · 1.5% tax · 5.0% vac · 8.0% maint · 8.0% mgmt
Financing live
Cash to close
- Down payment
- $23,750
- Closing costs
- $2,850
- Reserves months
- —
- Total cash needed
- —
Loan-product check · same deal, 3 products live
Conventional
25% down · 7.5% · 30yr
- Down + closing
- —
- Monthly P&I
- —
- Monthly cashflow
- —
- DSCR
- —
- Eligible?
- —
Personal DTI + credit; lowest rate.
DSCR
20% down · 8.5% · 30yr
- Down + closing
- —
- Monthly P&I
- —
- Monthly cashflow
- —
- DSCR
- —
- Eligible?
- —
No personal income docs; deal must DSCR.
Hard money
10% down · 12.0% · 12mo
- Down + closing
- —
- Monthly P&I
- —
- Monthly cashflow
- —
- DSCR
- —
- Eligible?
- —
Short-term bridge; refi at stabilization.
Rent comps 29 comps
| Address | Beds | Baths | Sqft | Rent | $/sqft | DOM | Units | Dist |
|---|---|---|---|---|---|---|---|---|
| 2930 N Dearborn St Indianapolis, IN | 1.0 | 1.0 | 536 | $599 | $1.12 | 23d | 1 | 0.44mi |
| 3363 Nicholas Ave Indianapolis, IN | 2.0 | 1.0 | 720 | $1,000 | $1.39 | 4d | 1 | 0.52mi |
| 2530 N Temple Ave Indianapolis, IN | 1.0 | 1.0 | 720 | $750 | $1.04 | 20d | 1 | 0.54mi |
| 2821 Oxford Ln Indianapolis, IN | 1.0 | 1.0 | 640 | $825 | $1.29 | 43d | 1 | 0.60mi |
| 2519 Baltimore Ave Unit B Indianapolis, IN | 2.0 | 1.0 | 482 | $775 | $1.61 | 23d | 1 | 0.64mi |
| 3011 Oxford Ln Indianapolis, IN | 1.0 | 1.0 | 640 | $800 | $1.25 | 43d | 1 | 0.66mi |
| 2449 Wheeler St Indianapolis, IN | 1.0 | 1.0 | 600 | $950 | $1.58 | 23d | 1 | 0.72mi |
| 2722 N Olney St Indianapolis, IN | 2.0 | 1.0 | 650 | $795 | $1.22 | 43d | 1 | 0.79mi |
| 2372 Beckwith Dr Indianapolis, IN | 4.0 | 1.0–1.5 | 779 | $1,064 | $1.36 | 1d | 32 | 0.82mi |
| 3719 Hillside Ave Indianapolis, IN | 1.0 | 1.0 | 644 | $725 | $1.13 | 23d | 1 | 0.84mi |
| 2422 Adams St Unit 2 Indianapolis, IN | 1.0 | 1.0 | 700 | $850 | $1.21 | 43d | 1 | 0.84mi |
| 3421 N Olney St Indianapolis, IN | 2.0 | 1.0 | 720 | $1,195 | $1.66 | 16d | 1 | 0.85mi |
| 3132 Dr Andrew J Brown Ave Indianapolis, IN | 2.0 | 1.0–2.0 | 791 | $2,120 | $2.68 | 1d | 46 | 0.87mi |
| 3709 Kinnear Ave Indianapolis, IN | 2.0 | 1.0 | 650 | $1,000 | $1.54 | 43d | 1 | 0.87mi |
| 2846 Doctor Andrew J Brown Ave Indianapolis, IN | 1.0 | 1.0 | 420 | $700 | $1.67 | 43d | 1 | 0.88mi |
| 3763 Baltimore Ave Unit 3765 Indianapolis, IN | 1.0 | 1.0 | 750 | $750 | $1.00 | 43d | 1 | 0.90mi |
| 3723 Orchard Ave Unit 3723 Indianapolis, IN | 1.0 | 1.5 | 700 | $1,300 | $1.86 | 23d | 1 | 0.92mi |
| 3383 Station St Indianapolis, IN | 3.0 | 1.0 | 744 | $1,250 | $1.68 | 23d | 1 | 0.93mi |
| 3519 Balsam Ave Unit 7 Indianapolis, IN | 1.0 | 1.0 | 450 | $850 | $1.89 | 23d | 1 | 1.11mi |
| 3519 Balsam Ave Unit 6 Indianapolis, IN | 1.0 | 1.0 | 450 | $775 | $1.72 | 43d | 1 | 1.11mi |
| 3609 Balsam Ave Indianapolis, IN | 1.0 | 1.0 | 541 | $775 | $1.43 | 3d | 1 | 1.17mi |
| 3609 Balsam Ave Indianapolis, IN | 1.0 | 1.0 | 541 | $755 | $1.40 | 14d | 1 | 1.17mi |
| 3610 Balsam Ave Indianapolis, IN | 1.0 | 1.0 | 464 | $775 | $1.67 | 3d | 9 | 1.19mi |
| 3725 N Sherman Dr #7 Indianapolis, IN | 2.0 | 1.0 | 729 | $845 | $1.16 | 4d | 1 | 1.26mi |
| 1040 Fairfield Ave Unit 104011 Indianapolis, IN | 1.0 | 1.0 | 519 | $799 | $1.54 | 23d | 1 | 1.26mi |
| 3615 Sherman Forest Dr Indianapolis, IN | 4.0 | 1.0–2.5 | 1057 | $1,288 | $1.22 | 4d | 1 | 1.28mi |
| 1931 N Oxford St Indianapolis, IN | 1.0 | 1.0 | 616 | $875 | $1.42 | 4d | 1 | 1.33mi |
| 4115 Meadows Dr Indianapolis, IN | 1.0–3.0 | 1.0–2.0 | 1013 | $1,374 | $1.36 | 43d | 9 | 1.46mi |
| 2827 E 18th St Indianapolis, IN | 2.0 | 1.0 | 726 | $1,300 | $1.79 | 23d | 1 | 1.47mi |
Listing history 23 events
-
2026-06-18days on market $95,000 Active 223 DOM
-
2026-06-17days on market $95,000 Active 222 DOM
-
2026-06-16days on market $95,000 Active 221 DOM
-
2026-06-15days on market $95,000 Active 220 DOM
-
2026-06-13days on market $95,000 Active 218 DOM
-
2026-06-13days on market $95,000 Active 217 DOM
-
2026-06-09days on market $95,000 Active 214 DOM
-
2026-06-08days on market $95,000 Active 213 DOM
-
2026-06-07days on market $95,000 Active 212 DOM
-
2026-06-03days on market $95,000 Active 208 DOM
-
2026-06-02days on market $95,000 Active 207 DOM
-
2026-06-01days on market $95,000 Active 206 DOM
-
2026-05-31days on market $95,000 Active 205 DOM
-
2026-01-08status Active 477-char remark
Show marketing remark (477 chars)
welcome to 3042 n temple Ave! this charming 2 bedroom, 1 bath home has comfort and convenience, ready for your personal touch the home sits in a spacious lot with a large backyard, ideal for gatherings, gardening locate just minutes from downtown Indianapolis, shopping dining schools and major highways, this property offers both accessibility and potential, whether you are first time home buyer, downsizing or looking for an investment ,this home checks all the boxes
-
2025-11-25status Pending 477-char remark
Show marketing remark (477 chars)
welcome to 3042 n temple Ave! this charming 2 bedroom, 1 bath home has comfort and convenience, ready for your personal touch the home sits in a spacious lot with a large backyard, ideal for gatherings, gardening locate just minutes from downtown Indianapolis, shopping dining schools and major highways, this property offers both accessibility and potential, whether you are first time home buyer, downsizing or looking for an investment ,this home checks all the boxes
-
2025-10-10price $95,000 477-char remark
Show marketing remark (477 chars)
welcome to 3042 n temple Ave! this charming 2 bedroom, 1 bath home has comfort and convenience, ready for your personal touch the home sits in a spacious lot with a large backyard, ideal for gatherings, gardening locate just minutes from downtown Indianapolis, shopping dining schools and major highways, this property offers both accessibility and potential, whether you are first time home buyer, downsizing or looking for an investment ,this home checks all the boxes
-
2025-09-21$105,000 Active 477-char remark
Show marketing remark (477 chars)
welcome to 3042 n temple Ave! this charming 2 bedroom, 1 bath home has comfort and convenience, ready for your personal touch the home sits in a spacious lot with a large backyard, ideal for gatherings, gardening locate just minutes from downtown Indianapolis, shopping dining schools and major highways, this property offers both accessibility and potential, whether you are first time home buyer, downsizing or looking for an investment ,this home checks all the boxes
-
2017-08-03soldstatus $40,000 Sold 358-char remark
Show marketing remark (358 chars)
Move in ready turn key home. Is fully rehabbed from the basement to shingles. All electric, plumbing, furnace, and hot water heater. All new Laminate floors bedrooms, family room, and kitchen. Bathroom fresh ceramic tile floors and ceramic shower surround. New toilet and vanity. Lot is peaceful with private back yard space. This little jewel is a must see.
-
2017-07-11status Pending 358-char remark
Show marketing remark (358 chars)
Move in ready turn key home. Is fully rehabbed from the basement to shingles. All electric, plumbing, furnace, and hot water heater. All new Laminate floors bedrooms, family room, and kitchen. Bathroom fresh ceramic tile floors and ceramic shower surround. New toilet and vanity. Lot is peaceful with private back yard space. This little jewel is a must see.
-
2017-07-08$45,900 Active 358-char remark
Show marketing remark (358 chars)
Move in ready turn key home. Is fully rehabbed from the basement to shingles. All electric, plumbing, furnace, and hot water heater. All new Laminate floors bedrooms, family room, and kitchen. Bathroom fresh ceramic tile floors and ceramic shower surround. New toilet and vanity. Lot is peaceful with private back yard space. This little jewel is a must see.
-
2016-12-07historical
-
2016-06-16price $44,900
-
2016-06-07$50,000 Active
ⓘ Source: listings_history table (triggers on properties + properties_extension) + one-shot
backfill from property_details.listing_events for pre-trigger history.
Tax reassessment forecast IN · Partial reset (capped growth)
- Current annual tax
- $1,745 · $145/mo
- Projected year-2 tax
- $1,745 · $145/mo
- Expected delta
- $0/yr ($0/mo · 0.0%)
ⓘ Screening estimate from a state-policy table — verify with the county assessor before closing.
Climate risk First Street
- Flood 7/10 Severe FEMA zone X (unshaded) · 99% chance over 30 yrs
- Wildfire 1/10 Low
- Heat 3/10 Moderate 7 d/yr ≥102°F today · 18 d/yr by 30 yrs out
- Wind 2/10 Low 100% chance of damaging wind over 30 yrs
- Air quality 4/10 Moderate 5 unhealthy d/yr today · 7 by 30 yrs out
Nearby sold comps map
Loading sold comps map…
Walkable amenities ~0.75 mi
Loading nearby amenities…
Taxation est. · year 1
- Rental income
- $11,773
- − Mortgage interest
- −$5,321
- − Property taxes
- −$1,745
- − Insurance
- −$1,142
- − Repairs & maintenance
- −$942
- − Management
- −$942
- − Depreciation
- −$2,764
- Taxable loss
- −$1,083
- Est. tax savings @ 24.0%
- +$260
- After-tax cash flow
- $695/yr
For passive investors: Depreciation is non-cash, so a rental often shows a tax loss while cash-flowing — sheltering income. Rental losses are passive: they offset passive income freely, and up to $25,000/yr can offset ordinary (W-2) income if you actively participate and your MAGI is under $100k (phasing out to $0 by $150k); unused losses carry forward. On sale, claimed depreciation is recaptured at up to 25%, and gains may owe capital-gains tax (a 1031 exchange can defer both). Figures are a year-1 estimate at your 24.0% rate — not tax advice; consult a CPA.
Schools (NCES district)
- District
- Indianapolis Public Schools
- NCES district ID
- 1804770
- Math proficiency
- 14% ▼ -7.00%
- Reading proficiency
- 20% ▼ -3.00%
- Median HH income
- $32,034
- Composite
- 13.69/100
- National rank
- #9499
- State rank
- #286 of 301 in IN
Livability — Indianapolis city (balance)
No livability data for this city. (Only ~50 U.S. cities are tracked.)
Census & demographics
- Census place
- Indianapolis city (balance), IN
- County
- Marion County · 998,460 people
- City population
- 881,119
- Metro
- Indianapolis-Carmel-Anderson, IN
- Population (ZIP)
- 29,360
- Household income
- $38,063
- Rent vs Own
- Severe rent burden
- 2340.0
Population outlook (Marion County) Hauer SSP2
- Today (2025)
- 1,025,572 people
- By 2030
- 1,065,727 · +3.9%
- By 2040
- 1,141,577 · +11.3%
- By 2050
- 1,208,920 · +17.9%
- By 2075
- 1,367,288 · +33.3%
- By 2100
- 1,438,201 · +40.2%
Race, ethnicity, and origin ACS 2023
- Neighborhood character
- Predominantly Black (68%)
- Race & ethnicity
- Black 68% White 18% Hispanic / Latino 9% Two or more races 6%
- Hispanic origin (detail)
- Mexican 6%
- Common ancestry
- Romanian 1%
- Foreign-born
- 5% · Canada, Philippines
- Languages at home
- 92% English-only · Spanish 7%
Political lean MEDSL · Marion
- 2024 margin
- Strong D (+27.7) · D 63.0% · R 35.3% · Other 1.7%
- 2008→2024 swing
- -0.7pp no change · 2008: 28.4pp · 2024: 27.7pp
- All cycles
- 2024: D+27.7 2020: D+29.1 2016: D+22.8 2012: D+22.2 2008: D+28.4
Not yet ingested
- Civics
- —
Market trends
- HPI YoY
- ▼ -81.57%
- Current HPI
- 395.7071
- Rent YoY
- ▲ 0.81%
- Metro
- Indianapolis-Carmel-Anderson, IN
- State GDP YoY
- ▲ 2.90%
- F500 in state
- 18
Industry mix (Fortune 500 HQ in IN)
| Industry | F500 HQs | Revenue |
|---|---|---|
| Industrial Machinery | 2 | $37B |
|
||
| Healthcare | 1 | $177B |
|
||
| Pharmaceuticals | 1 | $45B |
|
||
| Metals / Steel | 1 | $18B |
|
||
| Agriculture | 1 | $17B |
|
||
| Packaging | 1 | $12B |
|
||
Price history
+90.0% since first listed10 events — show timeline
- 2026-01-08 Relisted — MIBOR as Distributed by MLS Grid
- 2025-11-25 Pending — MIBOR as Distributed by MLS Grid
- 2025-10-10 Price Changed $95,000 MIBOR as Distributed by MLS Grid
- 2025-09-21 Listed $105,000 MIBOR as Distributed by MLS Grid
- 2017-08-03 Sold (MLS) $40,000 MIBOR as Distributed by MLS Grid
- 2017-07-11 Pending — MIBOR as Distributed by MLS Grid
- 2017-07-08 Listed $45,900 MIBOR as Distributed by MLS Grid
- 2016-12-07 Listing Removed — MIBOR as Distributed by MLS Grid
- 2016-06-16 Price Changed $44,900 MIBOR as Distributed by MLS Grid
- 2016-06-07 Listed $50,000 MIBOR as Distributed by MLS Grid
Property tax history
+12.1%/yrLatest (2025): $1,745 · +28.2% YoY. Source: county tax records.
Cash-flow waterfall
monthlySold comps — $/sqft
last 12 mo · ≤1 miLoading sold comps…