2846 Davis Ln · Rockledge, FL
Flood risk 1/10 · Minimal
- FEMA flood zone
- X (unshaded)
- Chance of flooding over 30 yrs
- 0.0%
- Est. flood insurance / yr
- $507 – $1,088
Fire risk 3/10 · Minor
- Est. fire insurance / yr
- $947 – $1,759
Heat risk 10/10 · Severe
- Hot days now (above 106°F)
- 7 days/yr
- Hot days in 30 yrs
- 23 days/yr
Wind risk 10/10 · Severe
- Chance of severe wind over 30 yrs
- 99.0%
Air-quality risk 1/10 · Minimal
- Unhealthy air days now
- 0 days/yr
- Unhealthy air days in 30 yrs
- 0 days/yr
Risk factors via First Street. Map © Google.
Why this score? — see what drove the D grade
The composite is a weighted blend of 9 inputs, each scored 0–100. Each bar is that input's sub-score; the figure is the points it added to the 100-point composite (weight × sub-score).
- Cash flow +13.0/30.0
- ARV discount +7.5/15.0
- Schools +4.7/10.0
- Livability +4.0/5.0
- DSCR +3.9/10.0
- 1% rule +2.9/10.0
- Rent growth +2.5/5.0
- Condition / age +2.5/5.0
- Appreciation +0.0/10.0
$225,000
🖨 Deal sheet (PDF) 📄 Offer letter ✓ Due diligence
Listing remarks
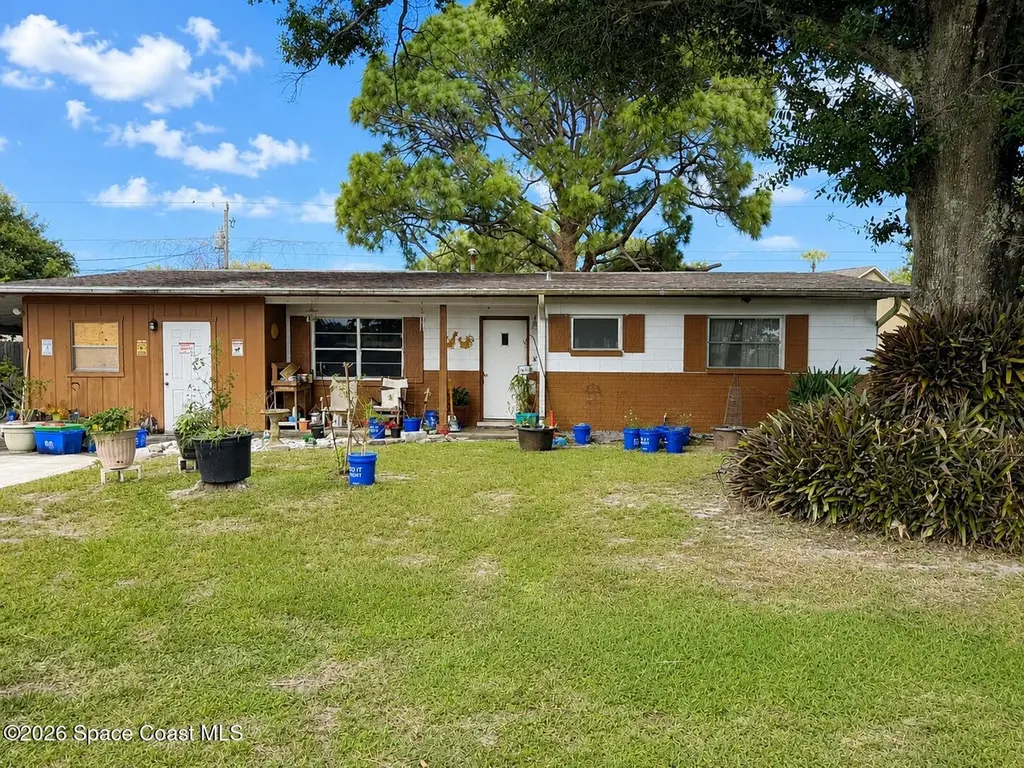
Cash only investment opportunity located on a quiet dead-end street in Rockledge! This 4-bedroom, 2-bath home offers approximately 1,530 living sq ft with a comfortable layout, indoor laundry, and nice yard space. Conveniently located near I-95 and US-1 with easy access to Viera, shopping, restaurants, schools, Orlando, and the beaches. The property needs a full renovation that may include roof, electrical, and possible plumbing updates, but remains livable for buyers looking to renovate while occupying the home. Ideal for investors, flippers, or buyers looking to customize, renovate, or create a future rental property. Sold As-Is. Photography Coming Soon.
Key facts
- Nice yard space
- Full renovation
- Indoor laundry
Tags
Property features AI
Exterior
- Parking: Attached 1-car carport
- Utilities: Septic tank; Cable available; Electricity connected; Natural gas connected; Water connected
- Home design: Single family residence; One story; Faces west
- Construction: Block construction; Shingle roof
- Exterior features: Storm shutters; Back yard fencing; Fenced yard; Dead-end street; Drainage canal; Asphalt road
Interior
- Kitchen: Electric range; Refrigerator
- Bedrooms: 4 bedrooms
- Flooring: Terrazzo flooring; Tile flooring
- Bathrooms: 2 full bathrooms
- Heating & cooling: Natural gas heat; Central air conditioning
- Interior features: Entrance foyer; His and hers closets; In-law floorplan
- Laundry & utility: In-unit laundry; Gas dryer hookup; Dryer; Gas water heater
Neighborhood map
What this means for you Summary
Snapshot
- This is a 2-bed/2.0-bath single-family listed at $225k.
Deal economics
- At list price, monthly cash flow is $-13 ($-156/yr) — negative.
- To cash-flow at today's rent, offer at most $223k (1.0% below list).
- To meet the 1% rule (rent ≥ 1% of price), the offer needs to be $178k (21.0% below list).
- Recommended offer: $178k (21.0% below list) — sets the bar for 1% rule.
Location & tenants
- Location reads 81/100 on livability (#81 in FL, #1,315 nationally) — a professional / high-income tenant draw. Strengths: housing A+, health & safety A, commute A-; Watch: amenities F.
- Brevard (suburban): math 53% / reading 57% proficiency, ranked #19 of 73 in FL (top 26%) — acceptable for families but not a draw, mixed tenant base, ~2y average lease.
- Zoned schools: Golfview Elementary Magnet School (math 32% / reading 36%, grade F, #1,744 of 2,144 statewide, top 82%, 441 students, 74% FRL); John F. Kennedy Middle School (math 67% / reading 59%, grade B+, #111 of 571 statewide, top 20%, 673 students, 41% FRL); Rockledge Senior High School (math 27% / reading 49%, grade F, #328 of 667 statewide, top 50%, 1,558 students, 50% FRL).
- Market conditions: Rents flat; 317 active listings in the ZIP; 19 comparable units currently listed for rent nearby; rentals at typical pace (median 25d on market — plan ~3-4 weeks tenant-placement turnaround); solid renter incomes; 4,602 units permitted in Brevard County in 2024 (702 in 5+ unit buildings).
Forward outlook
- Local home prices are declining (-3.0%/yr); year-one equity from $2k of loan paydown is wiped out by about $7k of value loss. Plan a longer hold.
- Brevard County population projected at +15% by 2050 — modest demand growth; plan on rents tracking national, not racing it.
Negotiation context
- Only 10 days on market — expect competitive offers; lowballing is unlikely to land.
Risks & watch-outs
- Climate carrying-cost: severe wind risk, 99% chance of damaging wind over 30y; extreme-heat days projected 7→23/yr by 2055 (HVAC capex compounding) — expect insurance premiums to compound above CPI over the hold.
Questions for the listing agent
- What do current leases actually rent for vs. the listed asking? Can we see a recent rent roll and the last 12 months of T-12 income?
- Built in 1965 — when were the roof, HVAC, electrical panel, plumbing, and water heater last replaced?
- Is there a deadline driving the sale (1031 exchange, divorce, estate, relocation)? That informs how much negotiation room exists.
- Schools are B-rated — typically a magnet for longer-tenancy family renters. What's the average tenant stay here, and is there a school-zone premium baked into asking?
- The area grade is low — what's the realistic commute time and amenity access for the typical tenant pool here? Any planned neighborhood developments (good or bad) we should know about?
- What's the average days-on-market for RENTAL listings here right now (not sales)? A rising rental-DOM trend means longer vacancies and softer asking-rent achievability than the comps imply.
- What's the recent tenant-quality profile in this submarket — average credit score on applications, eviction rate, late-payment / NSF rate, and stable-employment percentage? A property-management company in the area should have these aggregated.
- How much new for-sale + rental construction is in the pipeline within 1–3 miles? Heavy new supply typically softens prices + rents 12–24 months out; constrained supply supports both.
Investment metrics
- 1% rule
- 0.79% ✗
- Cap rate
- 6.22%
- Cash-on-cash
- -0.25%
- DSCR
- 0.99
- GRM
- 10.5
CMA / ARV
No comps found within radius.
Projected returns pro-forma
-3.0% appreciation · 0.12% rent growth · sell at horizon
- IRR
- -19.7%
- Equity multiple
- 0.33×
- Total profit
- $-42,352
- Equity at exit
- $33,548
- IRR
- -19.5%
- Equity multiple
- 0.09×
- Total profit
- $-57,575
- Equity at exit
- $19,454
Cash invested: $63,000 (down + closing). Projections, not guarantees.
Landlord ↔ Tenant lean methodology
- Overall (STATE)
- 87 Strongly Landlord-Friendly
- State Florida
- 87 Strongly Landlord-Friendly · R+3
- County
- — inherits STATE
- City
- — inherits STATE
ZIP-level market 32955
- Home prices YoY
- -20.7%
- Rents YoY
- 0.1%
- Active inventory
- 317
- Price-to-rent
- 10.5×
Monthly cashflow live
- Estimated rent
- $1,777 high interval (Pro) →
- Mortgage (P&I)
- −$1,180
- Tax from tax record
- −$143 /mo · $1,721/yr
- Insurance
- −$94
- HOA
- −$0
- Vacancy / Maint / Mgmt
- −$373
- Net cashflow
- $-13
Break-even live
Sensitivity live
| Price | -10% $114 | -5% $51 | +0% $-13 | +5% $-77 | +10% $-140 |
|---|---|---|---|---|---|
| Rent | -10% $-153 | -5% $-83 | +0% $-13 | +5% $57 | +10% $127 |
| Rate | -1.0pp $100 | -0.5pp $44 | base $-13 | +0.5pp $-71 | +1.0pp $-131 |
UW: 25.0% down · 7.5% · 30yr · 1.5% tax · 5.0% vac · 8.0% maint · 8.0% mgmt
Financing live
Cash to close
- Down payment
- $56,250
- Closing costs
- $6,750
- Reserves months
- —
- Total cash needed
- —
Loan-product check · same deal, 3 products live
Conventional
25% down · 7.5% · 30yr
- Down + closing
- —
- Monthly P&I
- —
- Monthly cashflow
- —
- DSCR
- —
- Eligible?
- —
Personal DTI + credit; lowest rate.
DSCR
20% down · 8.5% · 30yr
- Down + closing
- —
- Monthly P&I
- —
- Monthly cashflow
- —
- DSCR
- —
- Eligible?
- —
No personal income docs; deal must DSCR.
Hard money
10% down · 12.0% · 12mo
- Down + closing
- —
- Monthly P&I
- —
- Monthly cashflow
- —
- DSCR
- —
- Eligible?
- —
Short-term bridge; refi at stabilization.
Rent comps 19 comps
| Address | Beds | Baths | Sqft | Rent | $/sqft | DOM | Units | Dist |
|---|---|---|---|---|---|---|---|---|
| 1913 Woodhaven Cir Rockledge, FL | 2.0 | 2.0 | 930 | $1,597 | $1.72 | 15d | 3 | 0.11mi |
| 1001 Cascade Cir Rockledge, FL | 2.0–3.0 | 2.0 | 1274 | $1,705 | $1.34 | 15d | 6 | 0.23mi |
| 412 Clarence Rowe Ave Rockledge, FL | 3.0 | 1.0 | 960 | $1,600 | $1.67 | 24d | 1 | 0.63mi |
| 1515 Huntington Ln Rockledge, FL | 2.0 | 1.0–2.0 | 470 | $1,725 | $3.67 | 15d | 4 | 0.72mi |
| 1515 Huntington Ln Rockledge, FL | 2.0 | 1.0–2.0 | 470 | $1,762 | $3.75 | 24d | 3 | 0.72mi |
| 897 Levitt Pkwy Rockledge, FL | 3.0 | 2.0 | 1386 | $2,200 | $1.59 | 24d | 1 | 0.79mi |
| 2990 S Fiske Blvd Rockledge, FL | 3.0 | 2.5 | 1600 | $1,800 | $1.12 | 15d | 1 | 0.83mi |
| 2990 S Fiske Blvd Rockledge, FL | 2.0–3.0 | 2.5 | 1598 | $1,750 | $1.10 | 24d | 2 | 0.83mi |
| 1880 Murrell Rd Unit Q63 Rockledge, FL | 2.0 | 1.5 | 1200 | $1,700 | $1.42 | 24d | 1 | 0.87mi |
| 1675 S Fiske Blvd #155 Rockledge, FL | 2.0 | 2.0 | 1170 | $1,750 | $1.50 | 14d | 1 | 0.89mi |
| 256 Barton Blvd Rockledge, FL | 3.0 | 1.0–2.0 | 1012 | $1,905 | $1.88 | 15d | 23 | 0.89mi |
| 1720 Murrell Rd #217 Rockledge, FL | 2.0 | 2.0 | 928 | $1,550 | $1.67 | 24d | 1 | 0.93mi |
| 3140 Southgate Dr Rockledge, FL | 2.0–3.0 | 2.0 | 1092 | $1,386 | $1.27 | 15d | 6 | 0.93mi |
| 823 Angela Ave Unit A Rockledge, FL | 2.0 | 2.0 | 1117 | $1,750 | $1.57 | 15d | 1 | 1.01mi |
| 1525 S Fiske Blvd Rockledge, FL | 1.0–2.0 | 1.0 | 890 | $1,500 | $1.69 | 24d | 1 | 1.10mi |
| 1600 Woodland Dr Unit 1 Rockledge, FL | 3.0 | 2.0 | 1426 | $1,995 | $1.40 | 15d | 1 | 1.21mi |
| 39 E Azalea Cir Rockledge, FL | 3.0 | 2.0 | 1096 | $2,100 | $1.92 | 24d | 1 | 1.34mi |
| 39 E Azalea Cir Unit 1 Rockledge, FL | 3.0 | 2.0 | 1096 | $2,200 | $2.01 | 24d | 1 | 1.34mi |
| 34 E Azalea Cir Rockledge, FL | 3.0 | 2.0 | 1224 | $1,800 | $1.47 | 24d | 1 | 1.38mi |
Listing history 8 events
-
2026-06-18days on market $225,000 Active 10 DOM
-
2026-06-17days on market $225,000 Active 9 DOM
-
2026-06-16days on market $225,000 Active 8 DOM
-
2026-06-15days on market $225,000 Active 7 DOM
-
2026-06-14days on market $225,000 Active 5 DOM
-
2026-06-10days on market $225,000 Active 2 DOM
-
2026-06-09remarks 664-char remark
-
2026-06-09$225,000 Active 1 DOM
ⓘ Source: listings_history table (triggers on properties + properties_extension) + one-shot
backfill from property_details.listing_events for pre-trigger history.
Tax reassessment forecast FL · Resets to sale price
- Current annual tax
- $1,721 · $143/mo
- Projected year-2 tax
- $1,868 · $156/mo
- Expected delta
- +$146/yr (+$12/mo · 8.5%)
ⓘ Screening estimate from a state-policy table — verify with the county assessor before closing.
Climate risk First Street
- Flood 1/10 Low FEMA zone X (unshaded) · 0% chance over 30 yrs
- Wildfire 3/10 Moderate
- Heat 10/10 Extreme 7 d/yr ≥106°F today · 23 d/yr by 30 yrs out
- Wind 10/10 Extreme 99% chance of damaging wind over 30 yrs
- Air quality 1/10 Low 0 unhealthy d/yr today · 0 by 30 yrs out
Nearby sold comps map
Loading sold comps map…
Walkable amenities ~0.75 mi
Loading nearby amenities…
Taxation est. · year 1
- Rental income
- $21,328
- − Mortgage interest
- −$12,603
- − Property taxes
- −$1,721
- − Insurance
- −$1,125
- − Repairs & maintenance
- −$1,706
- − Management
- −$1,706
- − Depreciation
- −$6,545
- Taxable loss
- −$4,080
- Est. tax savings @ 24.0%
- +$979
- After-tax cash flow
- $823/yr
For passive investors: Depreciation is non-cash, so a rental often shows a tax loss while cash-flowing — sheltering income. Rental losses are passive: they offset passive income freely, and up to $25,000/yr can offset ordinary (W-2) income if you actively participate and your MAGI is under $100k (phasing out to $0 by $150k); unused losses carry forward. On sale, claimed depreciation is recaptured at up to 25%, and gains may owe capital-gains tax (a 1031 exchange can defer both). Figures are a year-1 estimate at your 24.0% rate — not tax advice; consult a CPA.
Schools (NCES district)
- District
- Brevard
- NCES district ID
- 1200150
- Math proficiency
- 53% ▼ -9.00%
- Reading proficiency
- 57% ▼ -4.00%
- Median HH income
- $49,426
- Composite
- 46.86/100
- National rank
- #2370
- State rank
- #19 of 73 in FL
Livability — Rockledge
- Score
- 81/100
- State rank
- #81
- US rank
- #1315
Category grades
Schools grade is shown separately in the Schools card above.
Census & demographics
- County
- Brevard County · 602,871 people
- City population
- 41,008
- Metro
- Palm Bay-Melbourne-Titusville, FL
- Population (ZIP)
- 41,008
- Household income
- $86,457
- Rent vs Own
- Severe rent burden
- 1273.0
Population outlook (Brevard County) Hauer SSP2
- Today (2025)
- 623,254 people
- By 2030
- 648,420 · +4.0%
- By 2040
- 690,009 · +10.7%
- By 2050
- 715,669 · +14.8%
- By 2075
- 775,744 · +24.5%
- By 2100
- 776,687 · +24.6%
Race, ethnicity, and origin ACS 2023
- Neighborhood character
- Predominantly White (69%)
- Race & ethnicity
- White 69% Black 14% Hispanic / Latino 9% Two or more races 8% Asian 2%
- Hispanic origin (detail)
- Mexican 1% Puerto Rican 3%
- Common ancestry
- Slovak 3% Romanian 2% Serbian 2%
- Foreign-born
- 7% · Canada, Jamaica, Mexico
- Languages at home
- 91% English-only · Spanish 5% Other Indo-European 2%
Political lean MEDSL · Brevard
- 2024 margin
- Strong R (+20.8) · D 39.1% · R 59.9% · Other 1.0%
- 2008→2024 swing
- -10.4pp toward R · 2008: -10.4pp · 2024: -20.8pp
- All cycles
- 2024: R+20.8 2020: R+16.4 2016: R+19.8 2012: R+12.7 2008: R+10.4
Not yet ingested
- Civics
- —
Market trends
- HPI YoY
- ▼ -81.70%
- Current HPI
- 312.7435
- Rent YoY
- ▲ 0.12%
- Metro
- Palm Bay-Melbourne-Titusville, FL
- State GDP YoY
- ▲ 3.28%
- F500 in state
- 36
Industry mix (Fortune 500 HQ in FL)
| Industry | F500 HQs | Revenue |
|---|---|---|
| Industrial Technology | 2 | $29B |
|
||
| Insurance | 2 | $17B |
|
||
| Retail | 1 | $60B |
|
||
| Technology Distribution | 1 | $58B |
|
||
| Homebuilding | 1 | $35B |
|
||
| Technology Manufacturing | 1 | $35B |
|
||
Price history
1 event — show timeline
- 2026-06-08 Listed $225,000 SCMLS
Property tax history
+7.6%/yrLatest (2025): $1,721 · +8.4% YoY. Source: county tax records.
Cash-flow waterfall
monthlySold comps — $/sqft
last 12 mo · ≤1 miLoading sold comps…