1800 N 9th Ave · Virginia, MN
Flood risk 1/10 · Minimal
- FEMA flood zone
- —
- Chance of flooding over 30 yrs
- 0.0%
- Est. flood insurance / yr
- —
Fire risk 4/10 · Minor
- Est. fire insurance / yr
- $888 – $1,650
Heat risk 1/10 · Minimal
- Hot days now (above 90°F)
- 7 days/yr
- Hot days in 30 yrs
- 13 days/yr
Wind risk 1/10 · Minimal
- Chance of severe wind over 30 yrs
- —
Air-quality risk 2/10 · Minimal
- Unhealthy air days now
- 2 days/yr
- Unhealthy air days in 30 yrs
- 2 days/yr
Risk factors via First Street. Map © Google.
Why this score? — see what drove the C grade
The composite is a weighted blend of 9 inputs, each scored 0–100. Each bar is that input's sub-score; the figure is the points it added to the 100-point composite (weight × sub-score).
- Cash flow +20.3/30.0
- ARV discount +15.0/15.0
- DSCR +6.4/10.0
- Schools +5.0/10.0
- 1% rule +4.1/10.0
- Livability +3.2/5.0
- Rent growth +2.5/5.0
- Condition / age +2.5/5.0
- Appreciation +0.0/10.0
$129,000
🖨 Deal sheet 📄 Offer letter ✓ Due diligence
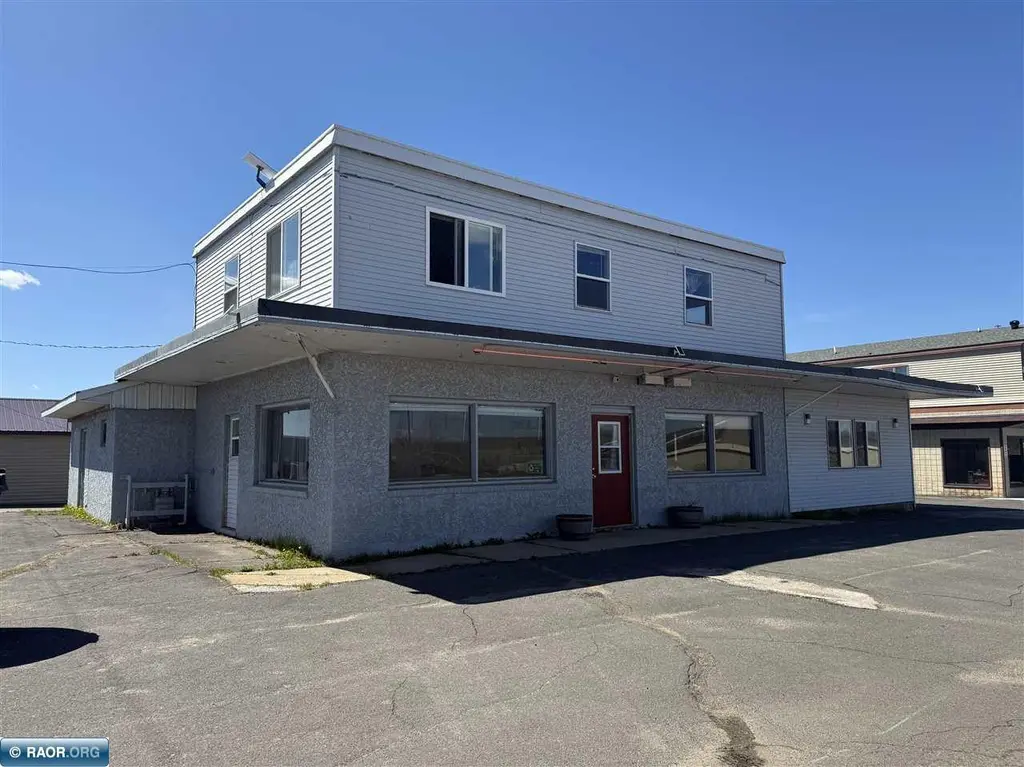
Listing remarks
This versatile commercial property offers an exceptional opportunity in a prime, high-traffic location. Situated near top attractions—including hotels, snowmobile and ATV trails, cross-country skiing, hiking, and golfing—the setting is perfectly positioned to capture year-round interest from both visitors and locals. The property serves as a blank canvas for your entrepreneurial vision, whether you are considering a café, retail shop, outfitter, or rental business. As an added benefit, the upper level features a comfortable two-bedroom, one-bath apartment, providing a convenient on-site live-work arrangement. Whether you are an investor, a first-time business owner, or a
Key facts
- Golfing
- Cross country skiing
- Near top attractions
Tags
Property features AI
Exterior
- Parking: No designated parking
- Utilities: Public water; Public sewer
- Home design: Residential property
- Construction: Frame construction; Stucco siding; Vinyl siding; Wood siding; Rubber roof
- Exterior features: Irregular lot shape
Interior
- Kitchen: Electric range; Gas range; Refrigerator; Electric water heater
- Heating & cooling: Central air conditioning; Electric heating; Forced air heating; Natural gas heating
- Interior features: Electric water heater; Dryer; Washer; Electric range; Gas range; Refrigerator
- Laundry & utility: Washer and dryer included; Electric dryer hookup
Neighborhood map
What this means for you Summary
Snapshot
- This is a 2-bed/2.0-bath single-family listed at $129k.
Deal economics
- At list price, monthly cash flow is $165 ($2k/yr) — positive.
- The deal already cash-flows at list — no discount required.
- To meet the 1% rule (rent ≥ 1% of price), the offer needs to be $118k (8.7% below list).
- Recommended offer: $118k (8.7% below list) — sets the bar for 1% rule.
Location & tenants
- Location reads 63/100 on livability (#664 in MN) — a middle-class / working-renter tenant base. Strengths: cost of living A+, housing A+; Watch: schools C-, crime D, health & safety D.
- Market conditions: 64 active listings in the ZIP; 639 units permitted in St. Louis County in 2024 (338 in 5+ unit buildings).
Forward outlook
- Local home prices are declining (-3.0%/yr); year-one equity from $892 of loan paydown is wiped out by about $4k of value loss. Plan a longer hold.
Negotiation context
- It's been on market 24 days — a 2% lower offer ($127k) is reasonable based on typical stale-listing flexibility.
- Current owner paid $45k; list at $129k implies a 187% gain — meaningful room to come down on a strong offer.
Risks & watch-outs
- Watch-outs: built in 1953 — expect roof / HVAC / electrical / plumbing capex.
Questions for the listing agent
- Built in 1953 — when were the roof, HVAC, electrical panel, plumbing, and water heater last replaced?
- Is there a deadline driving the sale (1031 exchange, divorce, estate, relocation)? That informs how much negotiation room exists.
- Crime grade is D in this area — have there been break-ins, vandalism, or insurance claims at this property in the last 3 years? What carrier currently insures it and at what premium?
- What's the average days-on-market for RENTAL listings here right now (not sales)? A rising rental-DOM trend means longer vacancies and softer asking-rent achievability than the comps imply.
- What's the recent tenant-quality profile in this submarket — average credit score on applications, eviction rate, late-payment / NSF rate, and stable-employment percentage? A property-management company in the area should have these aggregated.
- How much new for-sale + rental construction is in the pipeline within 1–3 miles? Heavy new supply typically softens prices + rents 12–24 months out; constrained supply supports both.
Investment metrics
- 1% rule
- 0.91% ✗
- Cap rate
- 7.83%
- Cash-on-cash
- 5.48%
- DSCR
- 1.24
- GRM
- 9.1
CMA / ARV
- ARV (on-the-fly)
- $251,664
- Comps found
- 2
Show comp detail 2 sales within ~0.75 mi
| Address | Dist | Beds/Ba | Sqft | Sold | Price | $/sf | Match |
|---|---|---|---|---|---|---|---|
| 928 16th St St N | 0.16mi | 3/1.8 (+1) | 2,429 (+3%) | 10mo | $260,000 | $107 | 73 |
| 824 14th St N | 0.27mi | 2/1.8 | 2,208 (-6%) | 14mo | $141,000 | $64 | 64 |
Match score weights: distance 35% · size 25% · config 20% · recency 20%. Top-matched comps best support the ARV.
Projected returns pro-forma
-3.0% appreciation · 3.0% rent growth · sell at horizon
- IRR
- -7.9%
- Equity multiple
- 0.71×
- Total profit
- $-10,466
- Equity at exit
- $19,234
- IRR
- 1.6%
- Equity multiple
- 1.12×
- Total profit
- $4,161
- Equity at exit
- $11,154
Cash invested: $36,120 (down + closing). Projections, not guarantees.
Landlord ↔ Tenant lean methodology
- Overall (STATE)
- 46 Balanced
- State Minnesota
- 46 Balanced · D+2
- County
- — inherits STATE
- City
- — inherits STATE
ZIP-level market 55792
- Home prices YoY
- -26.5%
- Active inventory
- 64
- Price-to-rent
- 9.1×
Monthly cashflow live
- Estimated rent
- $1,178 medium interval (Pro) →
- Mortgage (P&I)
- −$676
- Tax from tax record
- −$35 /mo · $424/yr
- Insurance
- −$54
- HOA
- −$0
- Vacancy / Maint / Mgmt
- −$247
- Net cashflow
- $165
Break-even live
UW: 25.0% down · 7.5% · 30yr · 1.5% tax · 5.0% vac · 8.0% maint · 8.0% mgmt
Financing live
Cash to close
- Down payment
- $32,250
- Closing costs
- $3,870
- Reserves months
- —
- Total cash needed
- —
Loan-product check · same deal, 3 products live
Conventional
25% down · 7.5% · 30yr
- Down + closing
- —
- Monthly P&I
- —
- Monthly cashflow
- —
- DSCR
- —
- Eligible?
- —
Personal DTI + credit; lowest rate.
DSCR
20% down · 8.5% · 30yr
- Down + closing
- —
- Monthly P&I
- —
- Monthly cashflow
- —
- DSCR
- —
- Eligible?
- —
No personal income docs; deal must DSCR.
Hard money
10% down · 12.0% · 12mo
- Down + closing
- —
- Monthly P&I
- —
- Monthly cashflow
- —
- DSCR
- —
- Eligible?
- —
Short-term bridge; refi at stabilization.
Listing history 19 events
-
2026-06-19days on market $129,000 Active 24 DOM
-
2026-06-18days on market $129,000 Active 23 DOM
-
2026-06-17days on market $129,000 Active 22 DOM
-
2026-06-16days on market $129,000 Active 21 DOM
-
2026-06-15days on market $129,000 Active 20 DOM
-
2026-06-14days on market $129,000 Active 18 DOM
-
2026-06-13pricedays on market $129,000 Active 17 DOM
-
2026-06-10days on market $145,000 Active 15 DOM
-
2026-06-09days on market $145,000 Active 14 DOM
-
2026-06-08days on market $145,000 Active 13 DOM
-
2026-06-07days on market $145,000 Active 12 DOM
-
2026-06-05days on market $145,000 Active 9 DOM
-
2026-06-03days on market $145,000 Active 8 DOM
-
2026-06-02days on market $145,000 Active 7 DOM
-
2026-06-01days on market $145,000 Active 6 DOM
-
2026-05-31days on market $145,000 Active 5 DOM
-
2026-05-30days on market $145,000 Active 4 DOM
-
2026-05-15$145,000 Active
-
2015-06-12soldstatus $45,000
ⓘ Source: listings_history table (triggers on properties + properties_extension) + one-shot
backfill from property_details.listing_events for pre-trigger history.
Tax reassessment forecast MN · Partial reset (capped growth)
- Current annual tax
- $424 · $35/mo
- Projected year-2 tax
- $934 · $78/mo
- Expected delta
- +$510/yr (+$43/mo · 120.4%)
ⓘ Screening estimate from a state-policy table — verify with the county assessor before closing.
Climate risk First Street
- Flood 1/10 Low 0% chance over 30 yrs
- Wildfire 4/10 Moderate
- Heat 1/10 Low 7 d/yr ≥90°F today · 13 d/yr by 30 yrs out
- Wind 1/10 Low
- Air quality 2/10 Low 2 unhealthy d/yr today · 2 by 30 yrs out
Nearby sold comps map
Loading sold comps map…
Walkable amenities ~0.75 mi
Loading nearby amenities…
Taxation est. · year 1
- Rental income
- $14,133
- − Mortgage interest
- −$7,226
- − Property taxes
- −$424
- − Insurance
- −$645
- − Repairs & maintenance
- −$1,131
- − Management
- −$1,131
- − Depreciation
- −$3,753
- Taxable loss
- −$176
- Est. tax savings @ 24.0%
- +$42
- After-tax cash flow
- $2,020/yr
For passive investors: Depreciation is non-cash, so a rental often shows a tax loss while cash-flowing — sheltering income. Rental losses are passive: they offset passive income freely, and up to $25,000/yr can offset ordinary (W-2) income if you actively participate and your MAGI is under $100k (phasing out to $0 by $150k); unused losses carry forward. On sale, claimed depreciation is recaptured at up to 25%, and gains may owe capital-gains tax (a 1031 exchange can defer both). Figures are a year-1 estimate at your 24.0% rate — not tax advice; consult a CPA.
Schools (NCES district)
No district data.
Livability — Virginia
- Score
- 63/100
- State rank
- #664
- US rank
- #15991
Category grades
Schools grade is shown separately in the Schools card above.
Census & demographics
- Census place
- Virginia, MN
- County
- Saint Louis County · 115,152 people
- City population
- 9,663
- Metro
- Duluth, MN-WI
- Population (ZIP)
- 9,663
- Household income
- $53,750
- Rent vs Own
- Severe rent burden
- 286.0
Population outlook (St. Louis County) Hauer SSP2
- Today (2025)
- 202,411 people
- By 2030
- 203,234 · +0.4%
- By 2040
- 202,520 · +0.1%
- By 2050
- 200,853 · -0.8%
- By 2075
- 200,943 · -0.7%
- By 2100
- 192,058 · -5.1%
Race, ethnicity, and origin ACS 2023
- Neighborhood character
- Predominantly White (90%)
- Race & ethnicity
- White 90% Two or more races 4% Native American 3% Asian 1%
- Common ancestry
- Portuguese 12% Romanian 4% Lithuanian 2%
- Foreign-born
- 2% · Canada, Vietnam
- Languages at home
- 96% English-only · Spanish 1% Other Asian/Pacific 1%
Political lean MEDSL · St. Louis
- 2024 margin
- D (+13.7) · D 55.9% · R 42.2% · Other 1.8%
- 2008→2024 swing
- -18.8pp toward R · 2008: 32.5pp · 2024: 13.7pp
- All cycles
- 2024: D+13.7 2020: D+15.6 2016: D+11.8 2012: D+29.6 2008: D+32.5
Not yet ingested
- Civics
- —
Market trends
- HPI YoY
- ▼ -72.05%
- Current HPI
- 199.7165
- Rent YoY
- —
- Metro
- Duluth, MN-WI
- State GDP YoY
- ▲ 2.41%
- F500 in state
- 34
Industry mix (Fortune 500 HQ in MN)
| Industry | F500 HQs | Revenue |
|---|---|---|
| Healthcare | 2 | $407B |
|
||
| Retail | 2 | $150B |
|
||
| Consumer Goods | 2 | $32B |
|
||
| Industrial Machinery | 2 | $6B |
|
||
| Agriculture | 1 | $40B |
|
||
| Healthcare / Medical Devices | 1 | $32B |
|
||
Price history
+222.2% since first listed2 events — show timeline
- 2026-05-15 Listed $145,000 RAOR
- 2015-06-12 Sold (Public Records) $45,000 Public Records
Property tax history
-14.8%/yrLatest (2021): $424 · +26.9% YoY. Source: county tax records.
Cash-flow waterfall
monthlySold comps — $/sqft
last 12 mo · ≤1 miLoading sold comps…