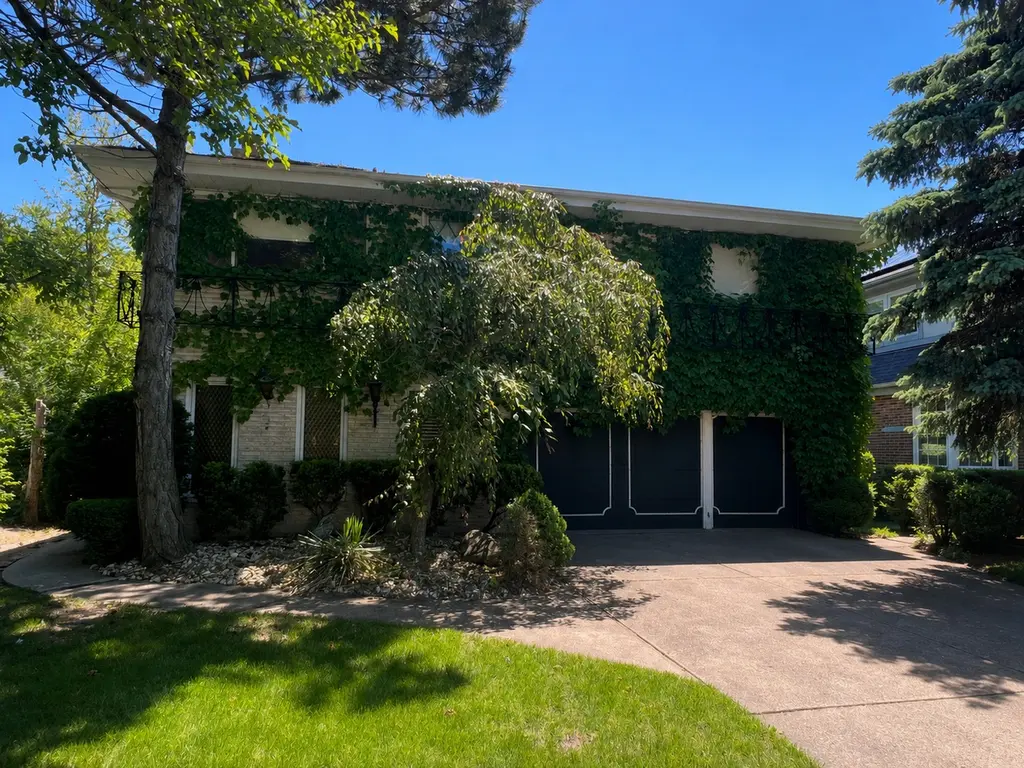
2419 Lake Ave · Wilmette, IL
Flood risk No data
- FEMA flood zone
- —
- Chance of flooding over 30 yrs
- —
- Est. flood insurance / yr
- —
Fire risk No data
- Est. fire insurance / yr
- —
Heat risk No data
- Hot days now (above threshold)
- —
- Hot days in 30 yrs
- —
Wind risk No data
- Chance of severe wind over 30 yrs
- —
Air-quality risk No data
- Unhealthy air days now
- —
- Unhealthy air days in 30 yrs
- —
Risk factors via First Street. Map © Google.
Why this score? — see what drove the C- grade
The composite is a weighted blend of 9 inputs, each scored 0–100. Each bar is that input's sub-score; the figure is the points it added to the 100-point composite (weight × sub-score).
- Cash flow +18.3/30.0
- Schools +7.7/10.0
- ARV discount +7.5/15.0
- DSCR +5.8/10.0
- 1% rule +4.9/10.0
- Livability +4.2/5.0
- Rent growth +2.5/5.0
- Condition / age +2.5/5.0
- Appreciation +0.0/10.0
$499,000
🖨 Deal sheet 📄 Offer letter ✓ Due diligence
Listing remarks
Exceptional opportunity in sought-after Wilmette! Situated on a generous lot in a prime location, this 4-bedroom, 2.5 -bath home offers endless potential for renovation or new construction. All four bedrooms are conveniently located on the second level, including a primary suite with a private bath and walk in closet. The main level features a spacious family room, large living and dining areas, and great natural light throughout. For buyers looking to create their dream home, this property provides a rare chance to update, expand, or start fresh. Additional features include an unfinished sub-basement offering abundant storage and future possibilities. Mature landscaping and an expansive ya
Key facts
- Generous lot
- Expansive yard
- Primary suite
Tags
Property features AI
Exterior
- Parking: Garage
- Home design: Single-family home
- Exterior features: Private balcony
Interior
- Bedrooms: 4 bedrooms
- Bathrooms: 2.5 bathrooms
- Heating & cooling: Air conditioning
- Interior features: Private balcony
- Laundry & utility: Washer and dryer included
Neighborhood map
What this means for you Summary
Snapshot
- This is a 4-bed/2.0-bath single-family listed at $499k.
Deal economics
- At list price, monthly cash flow is $460 ($6k/yr) — positive.
- The deal already cash-flows at list — no discount required.
- To meet the 1% rule (rent ≥ 1% of price), the offer needs to be $495k (0.8% below list).
- Recommended offer: $495k (0.8% below list) — sets the bar for 1% rule.
- Cap rate 7.4% vs local median 2.0% in Wilmette — top-decile yield for the area; either an underpriced asset or a hidden risk that comps aren't pricing in. Stress-test before assuming the spread holds.
Location & tenants
- Location reads 83/100 on livability (#43 in IL, #892 nationally) — a professional / high-income tenant draw. Strengths: schools A+, crime A+, commute A+; Watch: cost of living F.
- New Trier Twp Hsd 203 (suburban): math 76% / reading 80% proficiency, ranked #2 of 620 in IL (top 0%) — strong family-tenant draw, lease renewals of 3-5y typical.
- Market conditions: 80 active listings in the ZIP; 12 comparable units currently listed for rent nearby; rentals at typical pace (median 23d on market — plan ~3-4 weeks tenant-placement turnaround); high-income renter base; 6,272 units permitted in Cook County in 2024 (4,658 in 5+ unit buildings).
- This rent runs 31% of the median local income ($190k/yr) — at the standard rent-burdened threshold; future hikes will face affordability resistance.
Forward outlook
- Local home prices are declining (-3.0%/yr); year-one equity from $3k of loan paydown is wiped out by about $15k of value loss. Plan a longer hold.
Negotiation context
- Only 2 days on market — expect competitive offers; lowballing is unlikely to land.
Questions for the listing agent
- Built in 1968 — when were the roof, HVAC, electrical panel, plumbing, and water heater last replaced?
- Is there a deadline driving the sale (1031 exchange, divorce, estate, relocation)? That informs how much negotiation room exists.
- Schools are A-rated — typically a magnet for longer-tenancy family renters. What's the average tenant stay here, and is there a school-zone premium baked into asking?
- What's the average days-on-market for RENTAL listings here right now (not sales)? A rising rental-DOM trend means longer vacancies and softer asking-rent achievability than the comps imply.
- What's the recent tenant-quality profile in this submarket — average credit score on applications, eviction rate, late-payment / NSF rate, and stable-employment percentage? A property-management company in the area should have these aggregated.
- How much new for-sale + rental construction is in the pipeline within 1–3 miles? Heavy new supply typically softens prices + rents 12–24 months out; constrained supply supports both.
Investment metrics
- 1% rule
- 0.99% ✗
- Cap rate
- 7.40%
- Cash-on-cash
- 3.95%
- DSCR
- 1.18
- GRM
- 8.4
CMA / ARV
- ARV (on-the-fly)
- $1,164,464
- Comps found
- 12
Show comp detail 12 sales within ~0.75 mi
| Address | Dist | Beds/Ba | Sqft | Sold | Price | $/sf | Match |
|---|---|---|---|---|---|---|---|
| 912 Hunter Rd | 0.20mi | 4/2.0 | 1,807 (-8%) | 0mo | $1,200,000 | $664 | 77 |
| 2403 Lake Ave | 0.03mi | 4/3.0 | 2,100 (+7%) | 15mo | $825,000 | $393 | 71 |
| 2407 Iroquois Rd | 0.11mi | 3/2.0 (-1) | 2,196 (+12%) | 0mo | $1,605,000 | $731 | 70 |
| 1213 Dartmouth St | 0.43mi | 4/2.0 | 1,800 (-8%) | 1mo | $1,220,000 | $678 | 65 |
| 2133 Birchwood Ave | 0.38mi | 4/2.5 | 2,114 (+8%) | 11mo | $1,365,000 | $646 | 58 |
| 2237 Thornwood Ave | 0.40mi | 3/2.5 (-1) | 2,187 (+11%) | 3mo | $1,351,000 | $618 | 54 |
| 246 Vista Ct | 0.69mi | 4/2.5 | 1,796 (-9%) | 2mo | $692,500 | $386 | 50 |
| 2038 Highland Ave | 0.53mi | 4/2.5 | 1,691 (-14%) | 1mo | $965,000 | $571 | 49 |
| 2740 Orchard Ln | 0.43mi | 4/2.5 | 1,673 (-15%) | 6mo | $675,000 | $403 | 48 |
| 2013 Highland Ave | 0.60mi | 4/3.5 | 2,200 (+12%) | 3mo | $1,300,000 | $591 | 44 |
| 839 Chilton Ln | 0.69mi | 4/2.5 | 2,209 (+12%) | 6mo | $856,000 | $388 | 40 |
| 2100 Beechwood Ave | 0.70mi | 3/2.5 (-1) | 2,152 (+9%) | 12mo | $1,275,000 | $592 | 34 |
Match score weights: distance 35% · size 25% · config 20% · recency 20%. Top-matched comps best support the ARV.
Projected returns pro-forma
-3.0% appreciation · 3.0% rent growth · sell at horizon
- IRR
- -10.1%
- Equity multiple
- 0.63×
- Total profit
- $-51,478
- Equity at exit
- $74,403
- IRR
- -0.7%
- Equity multiple
- 0.95×
- Total profit
- $-6,786
- Equity at exit
- $43,144
Cash invested: $139,720 (down + closing). Projections, not guarantees.
Landlord ↔ Tenant lean methodology
- Overall (STATE)
- 43 Moderately Tenant-Leaning
- State Illinois
- 43 Moderately Tenant-Leaning · D+7
- County
- — inherits STATE
- City
- — inherits STATE
ZIP-level market 60091
- Active inventory
- 80
- Price-to-rent
- 8.4×
Monthly cashflow live
- Estimated rent
- $4,948 high interval (Pro) →
- Mortgage (P&I)
- −$2,617
- Tax est. 1.5%
- −$624 /mo · $7,485/yr
- Insurance
- −$208
- HOA
- −$0
- Vacancy / Maint / Mgmt
- −$1,039
- Net cashflow
- $460
Break-even live
UW: 25.0% down · 7.5% · 30yr · 1.5% tax · 5.0% vac · 8.0% maint · 8.0% mgmt
Financing live
Cash to close
- Down payment
- $124,750
- Closing costs
- $14,970
- Reserves months
- —
- Total cash needed
- —
Loan-product check · same deal, 3 products live
Conventional
25% down · 7.5% · 30yr
- Down + closing
- —
- Monthly P&I
- —
- Monthly cashflow
- —
- DSCR
- —
- Eligible?
- —
Personal DTI + credit; lowest rate.
DSCR
20% down · 8.5% · 30yr
- Down + closing
- —
- Monthly P&I
- —
- Monthly cashflow
- —
- DSCR
- —
- Eligible?
- —
No personal income docs; deal must DSCR.
Hard money
10% down · 12.0% · 12mo
- Down + closing
- —
- Monthly P&I
- —
- Monthly cashflow
- —
- DSCR
- —
- Eligible?
- —
Short-term bridge; refi at stabilization.
Rent comps 12 comps
| Address | Beds | Baths | Sqft | Rent | $/sqft | DOM | Units | Dist |
|---|---|---|---|---|---|---|---|---|
| 460 Highcrest Dr Wilmette, IL | 3.0 | 2.0 | 1750 | $5,175 | $2.96 | 1d | 1 | 0.45mi |
| 2036 Lake Ave Wilmette, IL | 3.0 | 2.0 | 1600 | $3,850 | $2.41 | 2d | 1 | 0.47mi |
| 1120 Romona Rd Wilmette, IL | 4.0 | 3.5 | 2300 | $6,800 | $2.96 | 22d | 1 | 0.61mi |
| 1110 Ridge Rd Wilmette, IL | 4.0 | 2.0 | 2000 | $5,500 | $2.75 | 4d | 1 | 0.74mi |
| 3115 Lake Ave Unit 3119-ER Wilmette, IL | 3.0 | 2.5 | 1646 | $4,147 | $2.52 | 19d | 1 | 0.85mi |
| 3119 Lake Ave Unit E Wilmette, IL | 3.0 | 2.5 | 1458 | $4,147 | $2.84 | 25d | 1 | 0.86mi |
| 237 Sunset Dr Unit NA Wilmette, IL | 4.0 | 2.0 | 1608 | $4,500 | $2.80 | 25d | 1 | 0.90mi |
| 651 Brier St Kenilworth, IL | 3.0 | 2.5 | 2335 | $6,200 | $2.66 | 20d | 1 | 1.09mi |
| 1428 Wilmette Ave Unit 1 Wilmette, IL | 3.0 | 2.0 | 1500 | $3,800 | $2.53 | 3d | 1 | 1.27mi |
| 614 Leamington Ave Wilmette, IL | 3.0 | 2.0 | 1600 | $3,200 | $2.00 | 25d | 1 | 1.27mi |
| 716 Laramie Ave Wilmette, IL | 3.0 | 2.0 | 2100 | $4,200 | $2.00 | 25d | 1 | 1.31mi |
| 704 Laramie Ave Wilmette, IL | 4.0 | 2.0 | 1502 | $3,950 | $2.63 | 25d | 1 | 1.31mi |
Listing history 6 events
-
2026-06-18days on market $499,000 Active 2 DOM
-
2026-06-17remarks 699-char remark
-
2026-06-17statusdays on market $499,000 Active 1 DOM
-
2026-06-16days on market $499,000 Coming Soon 4 DOM
-
2026-06-15days on market $499,000 Coming Soon 3 DOM
-
2026-06-13$499,000 Coming Soon 1 DOM
ⓘ Source: listings_history table (triggers on properties + properties_extension) + one-shot
backfill from property_details.listing_events for pre-trigger history.
Nearby sold comps map
Loading sold comps map…
Walkable amenities ~0.75 mi
Loading nearby amenities…
Taxation est. · year 1
- Rental income
- $59,371
- − Mortgage interest
- −$27,952
- − Property taxes
- −$7,485
- − Insurance
- −$2,495
- − Repairs & maintenance
- −$4,750
- − Management
- −$4,750
- − Depreciation
- −$14,516
- Taxable loss
- −$2,576
- Est. tax savings @ 24.0%
- +$618
- After-tax cash flow
- $6,140/yr
For passive investors: Depreciation is non-cash, so a rental often shows a tax loss while cash-flowing — sheltering income. Rental losses are passive: they offset passive income freely, and up to $25,000/yr can offset ordinary (W-2) income if you actively participate and your MAGI is under $100k (phasing out to $0 by $150k); unused losses carry forward. On sale, claimed depreciation is recaptured at up to 25%, and gains may owe capital-gains tax (a 1031 exchange can defer both). Figures are a year-1 estimate at your 24.0% rate — not tax advice; consult a CPA.
Schools (NCES district)
- District
- New Trier Twp Hsd 203
- NCES district ID
- 1728200
- Math proficiency
- 76% ▼ -4.00%
- Reading proficiency
- 80% ▼ -1.00%
- Median HH income
- $164,521
- Composite
- 76.94/100
- National rank
- #103
- State rank
- #2 of 620 in IL
Livability — Wilmette
- Score
- 83/100
- State rank
- #43
- US rank
- #892
Category grades
Schools grade is shown separately in the Schools card above.
Census & demographics
- Census place
- Wilmette, IL
- County
- Cook County · 4,486,803 people
- City population
- 27,333
- Metro
- Chicago-Naperville-Elgin, IL-IN-WI
- Population (ZIP)
- 27,333
- Household income
- $189,909
- Rent vs Own
- Severe rent burden
- 317.0
Population outlook (Cook County) Hauer SSP2
- Today (2025)
- 5,347,519 people
- By 2030
- 5,357,703 · +0.2%
- By 2040
- 5,324,924 · -0.4%
- By 2050
- 5,230,762 · -2.2%
- By 2075
- 4,785,735 · -10.5%
- By 2100
- 4,188,836 · -21.7%
Race, ethnicity, and origin ACS 2023
- Neighborhood character
- Predominantly White (78%)
- Race & ethnicity
- White 78% Asian 12% Two or more races 5% Hispanic / Latino 5%
- Hispanic origin (detail)
- Mexican 2%
- Common ancestry
- Romanian 7% Scotch-Irish 4% Italian 3%
- Foreign-born
- 16% · China, Canada, South Korea
- Languages at home
- 80% English-only · Chinese 5% Russian/Polish/Slavic 3% Other Indo-European 3%
Political lean MEDSL · Cook
- 2024 margin
- Solid D (+42.0) · D 70.4% · R 28.4% · Other 1.2%
- 2008→2024 swing
- -11.4pp toward R · 2008: 53.4pp · 2024: 42.0pp
- All cycles
- 2024: D+42.0 2020: D+50.3 2016: D+53.0 2012: D+49.4 2008: D+53.4
Not yet ingested
- Civics
- —
Market trends
- HPI YoY
- ▼ -420.87%
- Current HPI
- 188.5259
- Rent YoY
- —
- Metro
- Chicago-Naperville-Elgin, IL-IN-WI
- State GDP YoY
- ▲ 1.59%
- F500 in state
- 60
Industry mix (Fortune 500 HQ in IL)
| Industry | F500 HQs | Revenue |
|---|---|---|
| Insurance | 4 | $201B |
|
||
| Consumer Goods | 4 | $87B |
|
||
| Industrial Machinery | 3 | $64B |
|
||
| Healthcare | 2 | $55B |
|
||
| Retail / Pharmacy | 1 | $148B |
|
||
| Agriculture / Food | 1 | $86B |
|
||
Cash-flow waterfall
monthlySold comps — $/sqft
last 12 mo · ≤1 miLoading sold comps…