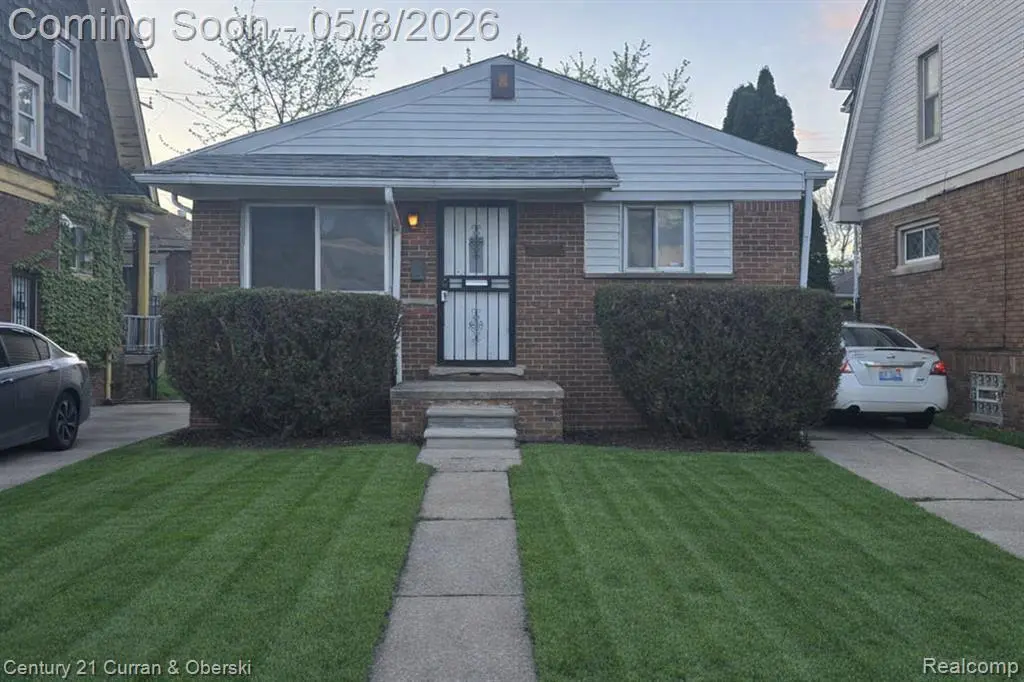
4030 W Davison St · Detroit, MI
Flood risk 1/10 · Minimal
- FEMA flood zone
- X (unshaded)
- Chance of flooding over 30 yrs
- 0.0%
- Est. flood insurance / yr
- $473 – $860
Fire risk 1/10 · Minimal
- Est. fire insurance / yr
- $784 – $1,456
Heat risk 3/10 · Minor
- Hot days now (above 97°F)
- 7 days/yr
- Hot days in 30 yrs
- 15 days/yr
Wind risk 2/10 · Minimal
- Chance of severe wind over 30 yrs
- —
Air-quality risk 4/10 · Minor
- Unhealthy air days now
- 4 days/yr
- Unhealthy air days in 30 yrs
- 6 days/yr
Risk factors via First Street. Map © Google.
Why this score? — see what drove the C+ grade
The composite is a weighted blend of 9 inputs, each scored 0–100. Each bar is that input's sub-score; the figure is the points it added to the 100-point composite (weight × sub-score).
- Cash flow +21.7/30.0
- ARV discount +15.0/15.0
- 1% rule +7.0/10.0
- DSCR +6.9/10.0
- Rent growth +4.0/5.0
- Livability +3.7/5.0
- Condition / age +2.5/5.0
- Schools +1.3/10.0
- Appreciation +0.0/10.0
$99,000
🖨 Deal sheet (PDF) 📄 Offer letter ✓ Due diligence
Listing remarks MLS
Well-maintained 3-bedroom, 1.5-bath brick ranch featuring fresh updates throughout! This home offers new carpet, new kitchen flooring, and fresh paint, giving it a clean, move-in-ready feel. Updated electrical adds peace of mind. Spacious layout with great natural light and a functional floor plan. Conveniently located near major roads, shopping, and local amenities. Don't miss this solid opportunity!
Key facts
- 3,920 sq ft lot
- 2 garage spots
- Built 1962
Property features AI
Finance
- Financial info: Annual tax listed
Exterior
- Parking: Detached 2-car garage
- Utilities: Public water; Public sewer
- Home design: Single-family residence; One level; Ground-level entry with steps; Brick exterior
- Construction: Brick construction
- Exterior features: Paved road access; Lot dimensions 36 x 109.7 (0.09 acres)
Interior
- Bedrooms: 3 total rooms
- Bathrooms: 1 full bathroom; 1 half bathroom
- Heating & cooling: Forced air heating (natural gas); No central air
- Interior features: Partially finished basement; Basement present
Neighborhood map
What this means for you Summary
Snapshot
- This is a 3-bed/1.0-bath single-family listed at $99k.
Deal economics
- At list price, monthly cash flow is $153 ($2k/yr) — positive.
- The deal already cash-flows at list — no discount required.
- Meets the 1% rule at list price ($1k rent vs $99k).
- Recommended offer: $96k (3.0% below list) — sets the bar for market timing.
Location & tenants
- Location reads 73/100 on livability (#218 in MI) — a middle-class / working-renter tenant base. Strengths: amenities A+, commute A+, cost of living A+; Watch: schools F, crime F, employment F.
- Detroit Public Schools Community District (urban): math 10% / reading 24% proficiency, ranked #499 of 540 in MI (top 92%) — low school quality limits family demand, transient renter base, plan for 1-2y turnover; 90% free/reduced lunch — lower-income household profile, screen leases tightly.
- Market conditions: Rents rising fast (+6.1%/yr); 348 active listings in the ZIP; 34 comparable units currently listed for rent nearby; rentals at typical pace (median 23d on market — plan ~3-4 weeks tenant-placement turnaround); lower-income renter base — watch delinquency; 2,639 units permitted in Wayne County in 2024 (1,216 in 5+ unit buildings).
- This rent runs 43% of the median local income ($33k/yr) — at the standard rent-burdened threshold; future hikes will face affordability resistance.
Forward outlook
- Local home prices are declining (-3.0%/yr); year-one equity from $684 of loan paydown is wiped out by about $3k of value loss. Plan a longer hold.
- Wayne County population projected at -17% by 2050 — secular population decline; favor cash flow + early exit over multi-decade hold.
- At projected returns (-3.0% appreciation + 6.1% rent growth), your $28k cash investment doubles in ~10 years — after that, you're playing with house money.
Negotiation context
- It's been on market 45 days — a 3% lower offer ($96k) is reasonable based on typical stale-listing flexibility.
- 6 sale attempts since 28y ago with the ask held roughly flat each time — persistent listings suggest the price (not the market) is what's stuck; bring a comps-based counter.
- Current owner paid $72k; 38% above their basis — modest negotiation headroom, anchor on the comps not their cost.
Risks & watch-outs
- Watch-outs: property tax is 2.8% of price.
Questions for the listing agent
- It's been on market 45 days. Have you received any prior offers? Is the seller open to a 3% concession, seller financing, or rate buy-down credit?
- Built in 1962 — when were the roof, HVAC, electrical panel, plumbing, and water heater last replaced?
- Property tax is high relative to price — has the assessment been appealed recently, and will the sale trigger a re-assessment?
- Is there a deadline driving the sale (1031 exchange, divorce, estate, relocation)? That informs how much negotiation room exists.
- Schools are F-rated, which usually means shorter tenancies and higher turnover. Who's the typical renter profile here, and what's been the actual vacancy rate?
- Crime grade is F in this area — have there been break-ins, vandalism, or insurance claims at this property in the last 3 years? What carrier currently insures it and at what premium?
- What's the average days-on-market for RENTAL listings here right now (not sales)? A rising rental-DOM trend means longer vacancies and softer asking-rent achievability than the comps imply.
- What's the recent tenant-quality profile in this submarket — average credit score on applications, eviction rate, late-payment / NSF rate, and stable-employment percentage? A property-management company in the area should have these aggregated.
- How much new for-sale + rental construction is in the pipeline within 1–3 miles? Heavy new supply typically softens prices + rents 12–24 months out; constrained supply supports both.
Investment metrics
- 1% rule
- 1.20% ✓
- Cap rate
- 8.15%
- Cash-on-cash
- 6.62%
- DSCR
- 1.29
- GRM
- 6.9
CMA / ARV
- ARV (median comp)
- $152,579
- List price
- $99,000
- Delta
- -35.12%
- Verdict
- UNDERPRICED
- Comps
- 20 within 1.0 mi
Show comp detail 5 sales within ~0.75 mi
| Address | Dist | Beds/Ba | Sqft | Sold | Price | $/sf | Match |
|---|---|---|---|---|---|---|---|
| 13503 Monica St | 0.48mi | 3/1.0 | 953 (+3%) | 7mo | $47,500 | $50 | 67 |
| 2075 Ewald Cir | 0.40mi | 2/1.0 (-1) | 949 (+3%) | 19mo | $70,000 | $74 | 56 |
| 2081 Ewald Cir | 0.39mi | 2/1.0 (-1) | 957 (+4%) | 20mo | $65,000 | $68 | 54 |
| 4203 Monterey St | 0.62mi | 3/1.0 | 1,000 (+8%) | 10mo | $40,000 | $40 | 50 |
| 14752 Petoskey Ave | 0.69mi | 3/1.5 | 1,029 (+11%) | 0mo | $40,000 | $39 | 47 |
Match score weights: distance 35% · size 25% · config 20% · recency 20%. Top-matched comps best support the ARV.
Projected returns pro-forma
-3.0% appreciation · 6.14% rent growth · sell at horizon
- IRR
- -2.2%
- Equity multiple
- 0.92×
- Total profit
- $-2,343
- Equity at exit
- $14,761
- IRR
- 11.0%
- Equity multiple
- 2.00×
- Total profit
- $27,822
- Equity at exit
- $8,560
Cash invested: $27,720 (down + closing). Projections, not guarantees.
Landlord ↔ Tenant lean methodology
- Overall (STATE)
- 62 Landlord-Friendly
- State Michigan
- 62 Landlord-Friendly · EVEN
- County
- — inherits STATE
- City
- — inherits STATE
ZIP-level market 48238
- Home prices YoY
- -14.4%
- Rents YoY
- 6.1%
- Active inventory
- 348
- Price-to-rent
- 6.9×
Monthly cashflow live
- Estimated rent
- $1,191 high interval (Pro) →
- Mortgage (P&I)
- −$519
- Tax from tax record
- −$228 /mo · $2,734/yr
- Insurance
- −$41
- HOA
- −$0
- Vacancy / Maint / Mgmt
- −$250
- Net cashflow
- $153
Break-even live
Sensitivity live
| Price | -10% $209 | -5% $181 | +0% $153 | +5% $125 | +10% $97 |
|---|---|---|---|---|---|
| Rent | -10% $59 | -5% $106 | +0% $153 | +5% $200 | +10% $247 |
| Rate | -1.0pp $203 | -0.5pp $178 | base $153 | +0.5pp $127 | +1.0pp $101 |
UW: 25.0% down · 7.5% · 30yr · 1.5% tax · 5.0% vac · 8.0% maint · 8.0% mgmt
Financing live
Cash to close
- Down payment
- $24,750
- Closing costs
- $2,970
- Reserves months
- —
- Total cash needed
- —
Loan-product check · same deal, 3 products live
Conventional
25% down · 7.5% · 30yr
- Down + closing
- —
- Monthly P&I
- —
- Monthly cashflow
- —
- DSCR
- —
- Eligible?
- —
Personal DTI + credit; lowest rate.
DSCR
20% down · 8.5% · 30yr
- Down + closing
- —
- Monthly P&I
- —
- Monthly cashflow
- —
- DSCR
- —
- Eligible?
- —
No personal income docs; deal must DSCR.
Hard money
10% down · 12.0% · 12mo
- Down + closing
- —
- Monthly P&I
- —
- Monthly cashflow
- —
- DSCR
- —
- Eligible?
- —
Short-term bridge; refi at stabilization.
Rent comps 34 comps
| Address | Beds | Baths | Sqft | Rent | $/sqft | DOM | Units | Dist |
|---|---|---|---|---|---|---|---|---|
| 4045 Clements St Detroit, MI | 3.0 | 1.0 | 850 | $1,150 | $1.35 | 45d | 1 | 0.03mi |
| 4045 Clements St Detroit, MI | 3.0 | 1.0 | 850 | $1,150 | $1.35 | 25d | 1 | 0.03mi |
| 3824 Tyler St Apt 1 Detroit, MI | 3.0 | 1.0 | 900 | $1,523 | $1.69 | 18d | 1 | 0.12mi |
| 3812 W Grand St Detroit, MI | 2.0 | 1.0 | 1100 | $1,025 | $0.93 | 18d | 1 | 0.13mi |
| 3783 Tyler St Unit Lower Detroit, MI | 3.0 | 1.0 | 1000 | $1,150 | $1.15 | 45d | 1 | 0.16mi |
| 4203 Tyler St Detroit, MI | 2.0 | 1.0 | 950 | $895 | $0.94 | 45d | 1 | 0.18mi |
| 2034 Ewald Cir Detroit, MI | 2.0 | 1.0 | 1000 | $995 | $0.99 | 6d | 1 | 0.43mi |
| 2690 Ewald Cir Detroit, MI | 1.0–2.0 | 1.0 | 750 | $900 | $1.20 | 25d | 4 | 0.45mi |
| 4268 Cortland St Unit 1 Detroit, MI | 2.0 | 1.0 | 1000 | $1,050 | $1.05 | 45d | 1 | 0.51mi |
| 12663 Stoepel St Detroit, MI | 2.0 | 1.0 | 1100 | $1,050 | $0.95 | 23d | 1 | 0.59mi |
| 12663 Stoepel St Unit 1 Detroit, MI | 2.0 | 1.0 | 750 | $975 | $1.30 | 19d | 1 | 0.59mi |
| 2926 Ewald Cir Detroit, MI | 2.0 | 1.0 | 800 | $900 | $1.12 | 18d | 1 | 0.60mi |
| 13620 Tuller St Detroit, MI | 4.0 | 1.0 | 1064 | $1,374 | $1.29 | 13d | 1 | 0.63mi |
| 12415 Monica St Detroit, MI | 2.0 | 1.0 | 1000 | $1,200 | $1.20 | 45d | 1 | 0.72mi |
| 2676 Sturtevant St Unit 1 Detroit, MI | 2.0 | 1.0 | 1000 | $1,000 | $1.00 | 25d | 1 | 0.72mi |
| 2433 Pasadena St Unit 2435 Detroit, MI | 2.0 | 1.0 | 700 | $1,025 | $1.46 | 45d | 1 | 0.81mi |
| 13639 La Salle Blvd Detroit, MI | 2.0 | 1.0 | 800 | $695 | $0.87 | 12d | 1 | 0.83mi |
| 2638 Richton St Unit 2638 Richton Upper Detroit, MI | 2.0 | 1.0 | 1000 | $900 | $0.90 | 45d | 1 | 0.83mi |
| 14950 Stoepel St Detroit, MI | 2.0 | 1.0 | 600 | $900 | $1.50 | 25d | 1 | 0.85mi |
| 12032 Santa Rosa Dr Unit 1 Detroit, MI | 3.0 | 1.0 | 900 | $1,278 | $1.42 | 0d | 1 | 0.92mi |
| 12019 Stoepel St Detroit, MI | 2.0 | 1.0 | 1000 | $943 | $0.94 | 6d | 1 | 0.93mi |
| 14656 Roselawn St Detroit, MI | 3.0 | 1.0 | 1000 | $1,200 | $1.20 | 18d | 1 | 1.05mi |
| 14550 Northlawn St Detroit, MI | 3.0 | 2.0 | 950 | $1,200 | $1.26 | 18d | 1 | 1.09mi |
| 3226 Calvert Ave Detroit, MI | 3.0 | 1.0 | 1100 | $1,200 | $1.09 | 13d | 1 | 1.10mi |
| 2285 Cortland St Detroit, MI | 2.0 | 1.0 | 900 | $1,000 | $1.11 | 18d | 1 | 1.11mi |
| 14570 Cherrylawn St Detroit, MI | 3.0 | 1.0 | 840 | $1,250 | $1.49 | 13d | 1 | 1.14mi |
| 3295 Rochester St Unit 2 Detroit, MI | 2.0 | 1.0 | 800 | $1,000 | $1.25 | 5d | 1 | 1.27mi |
| 3295 Rochester St Unit 2 Detroit, MI | 2.0 | 1.0 | 782 | $850 | $1.09 | 45d | 1 | 1.27mi |
| 2023 Tuxedo St Detroit, MI | 2.0 | 1.0 | 950 | $1,050 | $1.11 | 25d | 1 | 1.31mi |
| 9917 Woodside St Apt 1 Detroit, MI | 2.0 | 1.0 | 800 | $800 | $1.00 | 45d | 1 | 1.34mi |
| 7350 Globe St Detroit, MI | 3.0 | 1.0 | 1000 | $1,550 | $1.55 | 4d | 1 | 1.35mi |
| 9376 Otsego St Detroit, MI | 3.0 | 1.0 | 873 | $1,396 | $1.60 | 45d | 1 | 1.37mi |
| 15906 Alden St Detroit, MI | 3.0 | 1.0 | 1030 | $1,150 | $1.12 | 18d | 1 | 1.42mi |
| 15771 Turner St Detroit, MI | 2.0 | 1.0 | 1000 | $1,049 | $1.05 | 45d | 1 | 1.47mi |
Listing history 27 events
-
2026-06-21days on market $99,000 Active 45 DOM
-
2026-06-18days on market $99,000 Active 42 DOM
-
2026-06-17days on market $99,000 Active 41 DOM
-
2026-06-15days on market $99,000 Active 39 DOM
-
2026-06-13days on market $99,000 Active 37 DOM
-
2026-06-13days on market $99,000 Active 36 DOM
-
2026-06-09days on market $99,000 Active 33 DOM
-
2026-06-08days on market $99,000 Active 32 DOM
-
2026-06-07days on market $99,000 Active 31 DOM
-
2026-06-04days on market $99,000 Active 28 DOM
-
2026-06-03days on market $99,000 Active 27 DOM
-
2026-06-02days on market $99,000 Active 26 DOM
-
2026-06-01days on market $99,000 Active 25 DOM
-
2026-05-31days on market $99,000 Active 24 DOM
-
2026-05-08$99,000 Active 404-char remark
Show marketing remark (404 chars)
Well-maintained 3-bedroom, 1.5-bath brick ranch featuring fresh updates throughout! This home offers new carpet, new kitchen flooring, and fresh paint, giving it a clean, move-in-ready feel. Updated electrical adds peace of mind. Spacious layout with great natural light and a functional floor plan. Conveniently located near major roads, shopping, and local amenities. Don't miss this solid opportunity!
-
2026-05-08$99,000 Active 410-char remark
Show marketing remark (404 chars)
Well-maintained 3-bedroom, 1.5-bath brick ranch featuring fresh updates throughout! This home offers new carpet, new kitchen flooring, and fresh paint, giving it a clean, move-in-ready feel. Updated electrical adds peace of mind. Spacious layout with great natural light and a functional floor plan. Conveniently located near major roads, shopping, and local amenities. Don't miss this solid opportunity!
-
2026-05-01historical $99,000 404-char remark
Show marketing remark (404 chars)
Well-maintained 3-bedroom, 1.5-bath brick ranch featuring fresh updates throughout! This home offers new carpet, new kitchen flooring, and fresh paint, giving it a clean, move-in-ready feel. Updated electrical adds peace of mind. Spacious layout with great natural light and a functional floor plan. Conveniently located near major roads, shopping, and local amenities. Don't miss this solid opportunity!
-
2006-07-28soldstatus $72,000
-
2004-10-12historical
-
2004-10-12historical
-
2004-08-25$64,900
-
2004-08-25$64,900
-
2002-08-29historical
-
2002-05-29$61,900
-
2000-11-09soldstatus $50,000
-
1998-12-09historical
-
1998-06-26$53,500
ⓘ Source: listings_history table (triggers on properties + properties_extension) + one-shot
backfill from property_details.listing_events for pre-trigger history.
Tax reassessment forecast MI · Partial reset (capped growth)
- Current annual tax
- $2,734 · $228/mo
- Projected year-2 tax
- $2,734 · $228/mo
- Expected delta
- $0/yr ($0/mo · 0.0%)
ⓘ Screening estimate from a state-policy table — verify with the county assessor before closing.
Climate risk First Street
- Flood 1/10 Low FEMA zone X (unshaded) · 0% chance over 30 yrs
- Wildfire 1/10 Low
- Heat 3/10 Moderate 7 d/yr ≥97°F today · 15 d/yr by 30 yrs out
- Wind 2/10 Low
- Air quality 4/10 Moderate 4 unhealthy d/yr today · 6 by 30 yrs out
Nearby sold comps map
Loading sold comps map…
Walkable amenities ~0.75 mi
Loading nearby amenities…
Taxation est. · year 1
- Rental income
- $14,296
- − Mortgage interest
- −$5,546
- − Property taxes
- −$2,734
- − Insurance
- −$495
- − Repairs & maintenance
- −$1,144
- − Management
- −$1,144
- − Depreciation
- −$2,880
- Taxable income
- $354
- Est. tax owed @ 24.0%
- −$85
- After-tax cash flow
- $1,749/yr
For passive investors: Depreciation is non-cash, so a rental often shows a tax loss while cash-flowing — sheltering income. Rental losses are passive: they offset passive income freely, and up to $25,000/yr can offset ordinary (W-2) income if you actively participate and your MAGI is under $100k (phasing out to $0 by $150k); unused losses carry forward. On sale, claimed depreciation is recaptured at up to 25%, and gains may owe capital-gains tax (a 1031 exchange can defer both). Figures are a year-1 estimate at your 24.0% rate — not tax advice; consult a CPA.
Schools (NCES district)
- District
- Detroit Public Schools Community District
- NCES district ID
- 2601103
- Math proficiency
- 10% ▼ -2.00%
- Reading proficiency
- 24% ▲ 6.00%
- Median HH income
- $25,815
- Composite
- 13.06/100
- National rank
- #9564
- State rank
- #499 of 540 in MI
Livability — Detroit
- Score
- 73/100
- State rank
- #218
- US rank
- #5427
Category grades
Schools grade is shown separately in the Schools card above.
Census & demographics
- Census place
- Detroit, MI
- County
- Wayne County · 1,562,939 people
- City population
- 572,865
- Metro
- Detroit-Warren-Dearborn, MI
- Population (ZIP)
- 24,731
- Household income
- $33,315
- Rent vs Own
- Severe rent burden
- 2172.0
Population outlook (Wayne County) Hauer SSP2
- Today (2025)
- 1,675,273 people
- By 2030
- 1,620,300 · -3.3%
- By 2040
- 1,502,341 · -10.3%
- By 2050
- 1,384,039 · -17.4%
- By 2075
- 1,124,592 · -32.9%
- By 2100
- 881,193 · -47.4%
Race, ethnicity, and origin ACS 2023
- Neighborhood character
- Predominantly Black (94%)
- Race & ethnicity
- Black 94% Two or more races 3% White 1%
- Foreign-born
- 1%
Political lean MEDSL · Wayne
- 2024 margin
- Strong D (+29.0) · D 62.7% · R 33.7% · Other 3.6%
- 2008→2024 swing
- -20.5pp toward R · 2008: 49.5pp · 2024: 29.0pp
- All cycles
- 2024: D+29.0 2020: D+38.1 2016: D+37.3 2012: D+46.9 2008: D+49.5
Not yet ingested
- Civics
- —
Market trends
- HPI YoY
- ▼ -31.96%
- Current HPI
- 189.6227
- Rent YoY
- ▲ 6.14%
- Metro
- Detroit-Warren-Dearborn, MI
- State GDP YoY
- ▲ 1.37%
- F500 in state
- 28
Industry mix (Fortune 500 HQ in MI)
| Industry | F500 HQs | Revenue |
|---|---|---|
| Automotive Parts | 3 | $48B |
|
||
| Automotive | 2 | $372B |
|
||
| Chemicals | 1 | $45B |
|
||
| Automotive Retail | 1 | $29B |
|
||
| Healthcare / Medical Devices | 1 | $23B |
|
||
| Automotive Technology | 1 | $20B |
|
||
Price history
+85.0% since first listed13 events — show timeline
- 2026-05-08 Listed $99,000 MiRealSource-MiMLS
- 2026-05-08 Listed $99,000 REALCOMP
- 2026-05-01 Coming Soon $99,000 MiRealSource-MiMLS
- 2006-07-28 Sold (Public Records) $72,000 Public Records
- 2004-10-12 Listing Removed — REALCOMP
- 2004-10-12 Listing Removed — MiRealSource-MiMLS
- 2004-08-25 Listed $64,900 REALCOMP
- 2004-08-25 Listed $64,900 MiRealSource-MiMLS
- 2002-08-29 Listing Removed — REALCOMP
- 2002-05-29 Listed $61,900 REALCOMP
- 2000-11-09 Sold (Public Records) $50,000 Public Records
- 1998-12-09 Listing Removed — REALCOMP
- 1998-06-26 Listed $53,500 REALCOMP
Property tax history
+7.5%/yrLatest (2025): $2,734 · +0.8% YoY. Source: county tax records.
Cash-flow waterfall
monthlySold comps — $/sqft
last 12 mo · ≤1 miLoading sold comps…