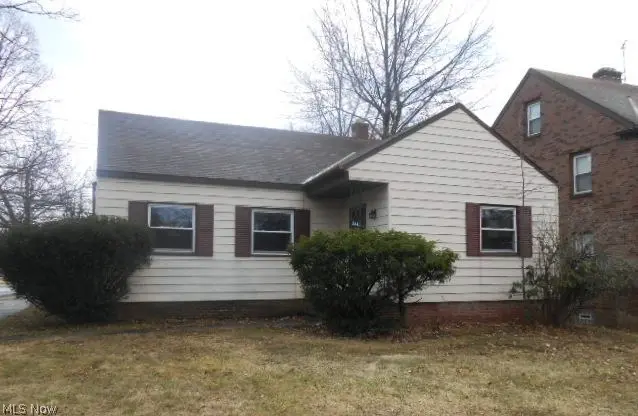
3540 Bainbridge Rd · Cleveland Heights, OH
Flood risk 1/10 · Minimal
- FEMA flood zone
- X (unshaded)
- Chance of flooding over 30 yrs
- 0.0%
- Est. flood insurance / yr
- $507 – $1,088
Fire risk 1/10 · Minimal
- Est. fire insurance / yr
- $713 – $1,323
Heat risk 2/10 · Minimal
- Hot days now (above 96°F)
- 7 days/yr
- Hot days in 30 yrs
- 17 days/yr
Wind risk 1/10 · Minimal
- Chance of severe wind over 30 yrs
- —
Air-quality risk 3/10 · Minor
- Unhealthy air days now
- 3 days/yr
- Unhealthy air days in 30 yrs
- 5 days/yr
Risk factors via First Street. Map © Google.
Why this score? — see what drove the C- grade
The composite is a weighted blend of 9 inputs, each scored 0–100. Each bar is that input's sub-score; the figure is the points it added to the 100-point composite (weight × sub-score).
- ARV discount +15.0/15.0
- Cash flow +14.4/30.0
- 1% rule +4.9/10.0
- Livability +4.5/5.0
- DSCR +4.4/10.0
- Rent growth +3.9/5.0
- Schools +2.8/10.0
- Condition / age +2.5/5.0
- Appreciation +0.0/10.0
$169,000
🖨 Deal sheet 📄 Offer letter ✓ Due diligence
Listing remarks MLS
Cute 4 bedroom, 2 bath bungalow with a finished 2nd floor. Hardwood floors and natural woodwork throughout. Kitchen with hardwood cabinets with and eating area. Full basement has glass block windows. Fenced yard and a 2 car detached garage. This will make a great place to start! Buyer to assume ANY/ALL POS violations, POS report in 'attachments'.
Key facts
- Finished attic space
- Corner lot
- 6,120 sq ft lot
Tags
Neighborhood map
What this means for you Summary
Snapshot
- This is a 2-bed/1.0-bath single-family listed at $169k.
Deal economics
- At list price, monthly cash flow is $34 ($411/yr) — positive.
- The deal already cash-flows at list — no discount required.
- To meet the 1% rule (rent ≥ 1% of price), the offer needs to be $167k (1.4% below list).
- Recommended offer: $167k (1.4% below list) — sets the bar for 1% rule.
- Cap rate 6.5% vs local median 4.4% in Cleveland Heights — top-decile yield for the area; either an underpriced asset or a hidden risk that comps aren't pricing in. Stress-test before assuming the spread holds.
Location & tenants
- Location reads 89/100 on livability (#12 in OH, #124 nationally) — a professional / high-income tenant draw. Strengths: amenities A+, commute A+, cost of living A+.
- Cleveland Heights-University Heights City (suburban): math 23% / reading 41% proficiency, ranked #568 of 656 in OH (top 87%) — families likely to look elsewhere, expect single-tenant / working-renter base with shorter leases; 64% free/reduced lunch — lower-income household profile, screen leases tightly.
- Market conditions: Rents rising fast (+5.7%/yr); 253 active listings in the ZIP; 40 comparable units currently listed for rent nearby; rentals at typical pace (median 17d on market — plan ~3-4 weeks tenant-placement turnaround); solid renter incomes; 1,441 units permitted in Cuyahoga County in 2024 (700 in 5+ unit buildings).
Forward outlook
- Local home prices are declining (-3.0%/yr); year-one equity from $1k of loan paydown is wiped out by about $5k of value loss. Plan a longer hold.
- Cuyahoga County population projected to shrink 8% by 2050 — rents likely to lag national; underwrite the cash flow, not the appreciation.
Negotiation context
- Only 7 days on market — expect competitive offers; lowballing is unlikely to land.
- 12 sale attempts since 34y ago with the ask held roughly flat each time — persistent listings suggest the price (not the market) is what's stuck; bring a comps-based counter.
- Current owner paid $110k; list at $169k implies a 54% gain — meaningful room to come down on a strong offer.
Risks & watch-outs
- Watch-outs: built in 1956 — expect roof / HVAC / electrical / plumbing capex.
Questions for the listing agent
- Built in 1956 — when were the roof, HVAC, electrical panel, plumbing, and water heater last replaced?
- Is there a deadline driving the sale (1031 exchange, divorce, estate, relocation)? That informs how much negotiation room exists.
- Schools are A-rated — typically a magnet for longer-tenancy family renters. What's the average tenant stay here, and is there a school-zone premium baked into asking?
- What's the average days-on-market for RENTAL listings here right now (not sales)? A rising rental-DOM trend means longer vacancies and softer asking-rent achievability than the comps imply.
- What's the recent tenant-quality profile in this submarket — average credit score on applications, eviction rate, late-payment / NSF rate, and stable-employment percentage? A property-management company in the area should have these aggregated.
- How much new for-sale + rental construction is in the pipeline within 1–3 miles? Heavy new supply typically softens prices + rents 12–24 months out; constrained supply supports both.
Investment metrics
- 1% rule
- 0.99% ✗
- Cap rate
- 6.54%
- Cash-on-cash
- 0.87%
- DSCR
- 1.04
- GRM
- 8.5
CMA / ARV
- ARV (on-the-fly)
- $260,496
- Comps found
- 12
Show comp detail 12 sales within ~0.75 mi
| Address | Dist | Beds/Ba | Sqft | Sold | Price | $/sf | Match |
|---|---|---|---|---|---|---|---|
| 3484 Bainbridge Rd | 0.10mi | 3/1.5 (+1) | 1,631 (-10%) | 0mo | $155,600 | $95 | 71 |
| 3540 Berkeley Rd | 0.05mi | 3/4.0 (+1) | 2,016 (+11%) | 1mo | $290,000 | $144 | 60 |
| 1936 Revere Rd | 0.34mi | 3/2.5 (+1) | 1,671 (-8%) | 1mo | $251,500 | $151 | 59 |
| 3545 Raymont Blvd | 0.45mi | 3/3.5 (+1) | 1,911 (+6%) | 0mo | $330,000 | $173 | 54 |
| 3566 Grosvenor Rd | 0.26mi | 3/2.0 (+1) | 2,074 (+15%) | 1mo | $250,000 | $121 | 54 |
| 3697 Washington Blvd | 0.55mi | 3/1.5 (+1) | 1,662 (-8%) | 0mo | $261,000 | $157 | 53 |
| 3733 E Antisdale Rd | 0.41mi | 3/1.5 (+1) | 1,582 (-12%) | 1mo | $155,000 | $98 | 52 |
| 3601 Tullamore Rd | 0.65mi | 3/1.5 (+1) | 1,712 (-5%) | 3mo | $195,000 | $114 | 52 |
| 2017 Goodnor Rd | 0.48mi | 3/1.5 (+1) | 1,605 (-11%) | 1mo | $140,000 | $87 | 51 |
| 3494 Raymont Blvd | 0.49mi | 3/2.0 (+1) | 1,580 (-13%) | 3mo | $153,000 | $97 | 44 |
| 3281 Kildare Rd | 0.75mi | 3/3.5 (+1) | 1,700 (-6%) | 3mo | $275,000 | $162 | 37 |
| 2208 Cranston Rd | 0.69mi | 3/1.5 (+1) | 1,563 (-14%) | 4mo | $240,000 | $154 | 35 |
Match score weights: distance 35% · size 25% · config 20% · recency 20%. Top-matched comps best support the ARV.
Projected returns pro-forma
-3.0% appreciation · 5.7% rent growth · sell at horizon
- IRR
- -11.6%
- Equity multiple
- 0.57×
- Total profit
- $-20,462
- Equity at exit
- $25,198
- IRR
- 1.5%
- Equity multiple
- 1.12×
- Total profit
- $5,533
- Equity at exit
- $14,612
Cash invested: $47,320 (down + closing). Projections, not guarantees.
Landlord ↔ Tenant lean methodology
- Overall (STATE)
- 73 Landlord-Friendly
- State Ohio
- 73 Landlord-Friendly · R+6
- County
- — inherits STATE
- City
- — inherits STATE
ZIP-level market 44118
- Rents YoY
- 5.7%
- Active inventory
- 253
- Price-to-rent
- 8.5×
Monthly cashflow live
- Estimated rent
- $1,666 high interval (Pro) →
- Mortgage (P&I)
- −$886
- Tax from tax record
- −$325 /mo · $3,901/yr
- Insurance
- −$70
- HOA
- −$0
- Vacancy / Maint / Mgmt
- −$350
- Net cashflow
- $34
Break-even live
UW: 25.0% down · 7.5% · 30yr · 1.5% tax · 5.0% vac · 8.0% maint · 8.0% mgmt
Financing live
Cash to close
- Down payment
- $42,250
- Closing costs
- $5,070
- Reserves months
- —
- Total cash needed
- —
Loan-product check · same deal, 3 products live
Conventional
25% down · 7.5% · 30yr
- Down + closing
- —
- Monthly P&I
- —
- Monthly cashflow
- —
- DSCR
- —
- Eligible?
- —
Personal DTI + credit; lowest rate.
DSCR
20% down · 8.5% · 30yr
- Down + closing
- —
- Monthly P&I
- —
- Monthly cashflow
- —
- DSCR
- —
- Eligible?
- —
No personal income docs; deal must DSCR.
Hard money
10% down · 12.0% · 12mo
- Down + closing
- —
- Monthly P&I
- —
- Monthly cashflow
- —
- DSCR
- —
- Eligible?
- —
Short-term bridge; refi at stabilization.
Rent comps 40 comps
| Address | Beds | Baths | Sqft | Rent | $/sqft | DOM | Units | Dist |
|---|---|---|---|---|---|---|---|---|
| 3428 Superior Park Dr Cleveland Heights, OH | 3.0 | 2.0 | 1704 | $1,325 | $0.78 | 21d | 1 | 0.26mi |
| 3699 Bainbridge Rd Cleveland, OH | 3.0 | 1.5 | 1866 | $1,900 | $1.02 | 16d | 1 | 0.31mi |
| 3411 Beechwood Ave Unit 2nd floor Cleveland Heights, OH | 3.0 | 1.0 | 1452 | $1,687 | $1.16 | 4d | 1 | 0.35mi |
| 3722 Bainbridge Rd Cleveland, OH | 3.0 | 1.5 | 1326 | $4,500 | $3.39 | 23d | 1 | 0.35mi |
| 3342 Desota Ave Unit 2 Cleveland Heights, OH | 3.0 | 1.0 | 1316 | $1,299 | $0.99 | 7d | 1 | 0.39mi |
| 3830 Berkeley Rd Cleveland, OH | 3.0 | 1.5 | 1318 | $1,800 | $1.37 | 23d | 1 | 0.56mi |
| 13630 Cedar Rd University Heights, OH | 2.0 | 2.5 | 1288 | $1,450 | $1.13 | 3d | 1 | 0.58mi |
| 3824 E Antisdale Rd Cleveland, OH | 3.0 | 1.0 | 1903 | $1,650 | $0.87 | 16d | 1 | 0.58mi |
| 3855 Grosvenor Rd Unit 1496039P South Euclid, OH | 2.0 | 1.0 | 1388 | $3,823 | $2.75 | 3d | 1 | 0.65mi |
| 3412 Kildare Rd Cleveland Heights, OH | 3.0 | 1.0 | 1296 | $1,731 | $1.34 | 3d | 1 | 0.65mi |
| 1584 Maple Rd Cleveland, OH | 3.0 | 2.0 | 1359 | $1,700 | $1.25 | 23d | 1 | 0.68mi |
| 500 Severance Place Ln Cleveland Heights, OH | 1.0 | 1.0 | 1150 | $1,575 | $1.37 | 23d | 2 | 0.74mi |
| 3895 Colony Rd Cleveland, OH | 3.0 | 2.0 | 1800 | $1,700 | $0.94 | 16d | 1 | 0.79mi |
| 3829 Washington Blvd University Heights, OH | 3.0 | 1.0 | 1577 | $2,250 | $1.43 | 16d | 1 | 0.81mi |
| 2267 Edgerton Rd University Heights, OH | 3.0 | 1.5 | 1958 | $1,750 | $0.89 | 16d | 1 | 0.87mi |
| 2223 Lee Rd Cleveland, OH | 2.0 | 1.0–2.0 | 1015 | $2,850 | $2.81 | 1d | 60 | 0.92mi |
| 3746 Northwood Rd Unit 1496093P University Heights, OH | 3.0 | 1.5 | 1291 | $5,767 | $4.47 | 2d | 1 | 0.94mi |
| 3300 Dellwood Rd Cleveland, OH | 3.0 | 1.0 | 1560 | $1,585 | $1.02 | 14d | 1 | 1.00mi |
| 3921 Bushnell Rd Cleveland, OH | 3.0 | 2.0 | 2175 | $2,400 | $1.10 | 19d | 1 | 1.01mi |
| 4023 Okalona Rd Cleveland, OH | 3.0 | 1.5 | 1400 | $2,500 | $1.79 | 44d | 1 | 1.02mi |
| 3062 E Derbyshire Rd Cleveland, OH | 3.0 | 1.0 | 1650 | $3,000 | $1.82 | 23d | 1 | 1.03mi |
| 4070 Wyncote Rd Cleveland, OH | 3.0 | 2.0 | 1233 | $1,749 | $1.42 | 2d | 1 | 1.05mi |
| 4093 Bexley Blvd Cleveland, OH | 3.0 | 1.5 | 1890 | $1,650 | $0.87 | 7d | 1 | 1.12mi |
| 3810 Parkdale Rd Cleveland, OH | 3.0 | 1.5 | 1281 | $2,067 | $1.61 | 2d | 1 | 1.16mi |
| 2401 N Taylor Rd Cleveland, OH | 3.0 | 1.0 | 1347 | $1,325 | $0.98 | 7d | 1 | 1.17mi |
| 4049 Bushnell Rd Cleveland, OH | 3.0 | 1.5 | 1552 | $2,100 | $1.35 | 1d | 1 | 1.20mi |
| 14172 Superior Rd Unit 1 Cleveland Heights, OH | 3.0 | 1.0 | 1446 | $1,295 | $0.90 | 23d | 1 | 1.20mi |
| 14172 Superior Rd Unit 2 Cleveland Heights, OH | 2.0 | 1.0 | 1446 | $1,195 | $0.83 | 23d | 1 | 1.20mi |
| 1599 Felton Rd Cleveland, OH | 3.0 | 1.5 | 1248 | $1,650 | $1.32 | 44d | 1 | 1.23mi |
| 4069 Bushnell Rd Cleveland, OH | 3.0 | 1.5 | 2397 | $2,000 | $0.83 | 12d | 1 | 1.23mi |
| 3232 Clarendon Rd Cleveland, OH | 2.0 | 1.0 | 1602 | $1,575 | $0.98 | 7d | 1 | 1.25mi |
| 4037 Washington Blvd University Heights, OH | 3.0 | 2.5 | 2403 | $2,750 | $1.14 | 1d | 1 | 1.28mi |
| 1633 Eddington Rd Unit 1 Cleveland Heights, OH | 3.0 | 1.0 | 1538 | $1,100 | $0.72 | 23d | 1 | 1.29mi |
| 2371 Warrensville Center Rd University Heights, OH | 3.0 | 1.5 | 1380 | $1,850 | $1.34 | 4d | 1 | 1.31mi |
| 14120 Superior Rd Cleveland, OH | 3.0 | 1.0 | 1390 | $1,400 | $1.01 | 44d | 1 | 1.34mi |
| 4241 Bayard Rd Cleveland, OH | 3.0 | 2.0 | 1350 | $1,995 | $1.48 | 23d | 1 | 1.34mi |
| 2113 Stillman Rd Cleveland, OH | 3.0 | 1.0 | 1372 | $1,150 | $0.84 | 16d | 1 | 1.37mi |
| 2119 Stillman Rd Unit 1 Cleveland Heights, OH | 2.0 | 1.0 | 1400 | $1,195 | $0.85 | 2d | 1 | 1.37mi |
| 1695 Glenmont Rd Unit 1695 Glenmont Lower Cleveland Heights, OH | 3.0 | 1.0 | 1336 | $1,435 | $1.07 | 7d | 1 | 1.38mi |
| 1695 Glenmont Rd Unit Lower Cleveland Heights, OH | 3.0 | 1.0 | 1336 | $1,435 | $1.07 | 23d | 1 | 1.38mi |
Listing history 5 events
-
2026-06-15status $169,000 Pending 7 DOM
-
2026-06-15days on market $169,000 Active 7 DOM
-
2026-06-13days on market $169,000 Active 5 DOM
-
2026-06-08remarks 699-char remark
-
2026-06-08$169,000 Active 1 DOM
ⓘ Source: listings_history table (triggers on properties + properties_extension) + one-shot
backfill from property_details.listing_events for pre-trigger history.
Tax reassessment forecast OH · Partial reset (capped growth)
- Current annual tax
- $3,901 · $325/mo
- Projected year-2 tax
- $3,901 · $325/mo
- Expected delta
- $0/yr ($0/mo · 0.0%)
ⓘ Screening estimate from a state-policy table — verify with the county assessor before closing.
Climate risk First Street
- Flood 1/10 Low FEMA zone X (unshaded) · 0% chance over 30 yrs
- Wildfire 1/10 Low
- Heat 2/10 Low 7 d/yr ≥96°F today · 17 d/yr by 30 yrs out
- Wind 1/10 Low
- Air quality 3/10 Moderate 3 unhealthy d/yr today · 5 by 30 yrs out
Nearby sold comps map
Loading sold comps map…
Walkable amenities ~0.75 mi
Loading nearby amenities…
Taxation est. · year 1
- Rental income
- $19,989
- − Mortgage interest
- −$9,467
- − Property taxes
- −$3,901
- − Insurance
- −$845
- − Repairs & maintenance
- −$1,599
- − Management
- −$1,599
- − Depreciation
- −$4,916
- Taxable loss
- −$2,338
- Est. tax savings @ 24.0%
- +$561
- After-tax cash flow
- $972/yr
For passive investors: Depreciation is non-cash, so a rental often shows a tax loss while cash-flowing — sheltering income. Rental losses are passive: they offset passive income freely, and up to $25,000/yr can offset ordinary (W-2) income if you actively participate and your MAGI is under $100k (phasing out to $0 by $150k); unused losses carry forward. On sale, claimed depreciation is recaptured at up to 25%, and gains may owe capital-gains tax (a 1031 exchange can defer both). Figures are a year-1 estimate at your 24.0% rate — not tax advice; consult a CPA.
Schools (NCES district)
- District
- Cleveland Heights-University Heights City
- NCES district ID
- 3904379
- Math proficiency
- 23% ▼ -22.00%
- Reading proficiency
- 41% ▼ -12.00%
- Median HH income
- $53,451
- Composite
- 28.12/100
- National rank
- #6822
- State rank
- #568 of 656 in OH
Livability — Cleveland Heights
- Score
- 89/100
- State rank
- #12
- US rank
- #124
Category grades
Schools grade is shown separately in the Schools card above.
Census & demographics
- Census place
- Cleveland Heights, OH
- County
- Cuyahoga County · 1,090,369 people
- City population
- 32,312
- Metro
- Cleveland-Elyria, OH
- Population (ZIP)
- 40,715
- Household income
- $77,555
- Rent vs Own
- Severe rent burden
- 1847.0
Population outlook (Cuyahoga County) Hauer SSP2
- Today (2025)
- 1,244,621 people
- By 2030
- 1,230,093 · -1.2%
- By 2040
- 1,189,108 · -4.5%
- By 2050
- 1,145,706 · -7.9%
- By 2075
- 1,076,557 · -13.5%
- By 2100
- 978,987 · -21.3%
Race, ethnicity, and origin ACS 2023
- Neighborhood character
- Diverse neighborhood (Simpson 0.56)
- Race & ethnicity
- White 57% Black 33% Two or more races 4% Asian 3% Hispanic / Latino 2%
- Common ancestry
- Romanian 4% Scotch-Irish 2% Italian 2%
- Foreign-born
- 6% · Canada, China
- Languages at home
- 92% English-only · Spanish 2% Russian/Polish/Slavic 1% Other Indo-European 1%
Political lean MEDSL · Cuyahoga
- 2024 margin
- Solid D (+31.5) · D 65.4% · R 33.9%
- 2008→2024 swing
- -7.4pp toward R · 2008: 38.9pp · 2024: 31.5pp
- All cycles
- 2024: D+31.5 2020: D+34.1 2016: D+35.0 2012: D+38.7 2008: D+38.9
Not yet ingested
- Civics
- —
Market trends
- HPI YoY
- ▼ -319.62%
- Current HPI
- 204.5504
- Rent YoY
- ▲ 5.70%
- Metro
- Cleveland-Elyria, OH
- State GDP YoY
- ▲ 1.98%
- F500 in state
- 48
Industry mix (Fortune 500 HQ in OH)
| Industry | F500 HQs | Revenue |
|---|---|---|
| Insurance | 3 | $145B |
|
||
| Industrial Machinery | 3 | $49B |
|
||
| Financial Services | 3 | $24B |
|
||
| Consumer Goods | 2 | $93B |
|
||
| Aerospace / Defense | 2 | $47B |
|
||
| Utilities | 2 | $33B |
|
||
Price history
+207.8% since first listed36 events — show timeline
- 2026-06-08 Listed $169,000 MLSNOW
- 2021-05-14 Sold (Public Records) $110,000 Public Records
- 2019-10-23 Listing Removed — MLSNOW
- 2019-09-03 Relisted — MLSNOW
- 2019-08-28 Listing Removed — MLSNOW
- 2019-04-10 Listed $125,000 MLSNOW
- 2016-03-03 Sold (MLS) $29,900 MLSNOW
- 2016-02-25 Pending — MLSNOW
- 2016-02-19 Contingent — MLSNOW
- 2016-02-09 Price Changed $29,900 MLSNOW
- 2016-02-09 Relisted — MLSNOW
- 2015-11-30 Pending — MLSNOW
- 2015-11-17 Contingent — MLSNOW
- 2015-11-05 Listed $34,900 MLSNOW
- 2015-09-10 Listing Removed — MLSNOW
- 2015-08-10 Price Changed $39,900 MLSNOW
- 2015-08-10 Relisted — MLSNOW
- 2015-08-09 Listing Removed — MLSNOW
- 2015-07-21 Relisted — MLSNOW
- 2015-07-09 Pending — MLSNOW
- 2015-07-07 Contingent — MLSNOW
- 2015-06-29 Price Changed $48,000 MLSNOW
- 2015-05-22 Relisted — MLSNOW
- 2015-05-15 Contingent — MLSNOW
- 2015-04-13 Listed $49,950 MLSNOW
- 2007-05-01 Listing Removed — MLSNOW
- 2006-11-17 Listed $120,000 MLSNOW
- 2002-02-18 Sold (MLS) $62,500 MLSNOW
- 2002-01-14 Listed $64,900 MLSNOW
- 1992-12-16 Sold (Public Records) $66,000 Public Records
- 1992-12-16 Sold (Public Records) $11,900 Public Records
- 1992-12-10 Sold (MLS) $68,000 MLSNOW
- 1992-11-02 Listed $69,900 MLSNOW
- 1991-07-22 Sold (Public Records) $54,679 Public Records
- 1991-07-22 Sold (Public Records) $13,675 Public Records
- 1989-03-28 Sold (Public Records) $54,900 Public Records
Property tax history
+2.1%/yrLatest (2025): $3,901 · -0.2% YoY. Source: county tax records.
Cash-flow waterfall
monthlySold comps — $/sqft
last 12 mo · ≤1 miLoading sold comps…